Liquidity Creation in a Short-Term Reversal Strategies and Volatility Risk
A new financial research paper related to:
#13 – Short Term Reversal in Stocks
Authors: Drechsler, Moreira, Savov
Title: Liquidity Creation As Volatility Risk
Link: https://papers.ssrn.com/sol3/papers.cfm?abstract_id=3133291
Abstract:
We show, both theoretically and empirically, that liquidity creation induces negative exposure to volatility risk. Intuitively, liquidity creation involves taking positions that can be exploited by privately informed investors. These investors' ability to predict future price changes makes their payoff resemble a straddle (a combination of a call and a put). By taking the other side, liquidity providers are implicitly short a straddle, suffering losses when volatility spikes. Empirically, we show that short-term reversal strategies, which mimic liquidity creation by buying stocks that go down and selling stocks that go up, have a large negative exposure to volatility shocks. This exposure, together with the large premium investors demand for bearing volatility risk, explains why liquidity creation earns a premium, why this premium is strongly increasing in volatility, and why times of high volatility like the 2008 financial crisis trigger a contraction in liquidity. Taken together, these results provide a new, asset-pricing view of the risks and rewards to financial intermediation.
Notable quotations from the academic research paper:
"We show, both theoretically and empirically, that liquidity creation—making assets cheaper to trade than they otherwise would be—induces exposure to volatility risk. Given the very large premium investors pay to avoid volatility risk, this explains why liquidity creation earns a premium, why this premium is strongly increasing in volatility, and why times of high volatility like the 2008 financial crisis trigger a contraction in liquidity.
Why does liquidity creation induce exposure to volatility risk? To create liquidity for some investors in an asset, a liquidity provider takes positions that can be exploited by other, privately informed investors. These investors buy the asset if they think it will rise in value and sell it if they think it will fall. Their ex post payoff therefore resembles a straddle (a combination of a call and a put option). Like any straddle, this payoff is high if volatility rises and low if it falls. By taking the other side, the liquidity provider is implicitly short the straddle, earning a low payoff if volatility rises and a high one if it falls. In other words, the liquidity provider is exposed to volatility risk.
The relation between liquidity creation and volatility risk is fundamental; it arises directly from the presence of asymmetric information. As a result, it applies widely across a variety of market structures. For instance, one way financial institutions create liquidity is by issuing relatively safe securities against risky assets. In doing so, they are betting against private information possessed by those who originate the assets or in some other way take a position against them (e.g. through derivatives). Consequently, when volatility spikes and this private information becomes more valuable, financial institutions suffer losses, as they did during the 2008 financial crisis.
Financial institutions and other investors also create liquidity by trading in secondary markets such as those for stocks and bonds. We present a model to formalize how this type of liquidity creation induces volatility risk and how this risk drives the liquidity premium. We also use the model to motivate our empirical analysis.
We test the predictions of our model using U.S. stock return data from 2001 to 2016 (covering the period after “decimalization,” when liquidity provision became competitive). Each day, we sort stocks into deciles based on their return (normalized by its rolling standard deviation) and quintiles based on their size (small stocks are known to be much less liquid). Within each size quintile, we construct longshort portfolios that buy stocks in the low return deciles and sell stocks in the high return deciles. These are known as short-term reversal portfolios in the literature. In our model, a large return reflects high order flow and hence high liquidity demand. The reversal portfolio therefore mimics the position of the liquidity provider, hence, we can use it to analyze the returns to liquidity creation.
Consistent with the model, and with the prior literature, our reversal portfolios earn substantial returns that cannot be explained by exposure to market risk. Among large stocks, which account for the bulk of the market by value, the reversal strategy across the lowest and highest return deciles has an average return of 27 bps over a five day holding period, or about 13.5% per year. The annual Sharpe ratio is 0.6.
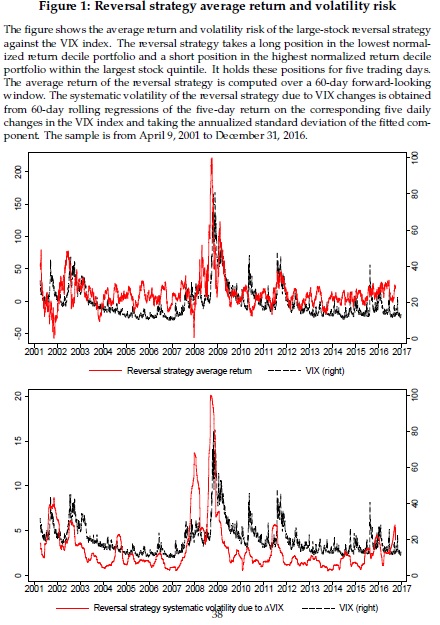
Figure 1 plots the return of the large-stock reversal strategy averaged over a 60-day forward-looking window against the level of VIX, a risk-neutral measure of the expected volatility of the S&P 500 over the next 30 days. The figure shows that the reversal return is strongly positively related to VIX (the raw correlation is 46%). In a regression, we find that a one-point higher VIX leads to a 5.37 bps higher reversal return over the next five days, which is large relative to the average return of the strategy. The R2 of this regression is 2.18%, which is very high for daily data. These findings confirm the main result of Nagel that VIX predicts reversal returns. They are also a prediction of our model. A high level of VIX is associated not only with high expected volatility but also with high volatility of volatility (and high aversion to volatility risk). In our model this makes liquidity creation riskier and raises the price of liquidity.
The bottom panel of Figure 1 tests this mechanism by plotting a measure of the volatility risk of the reversal strategy. We compute it by running 60-day rolling window regressions of the five-day large-stock reversal return on the daily VIX changes during the holding period. The figure plots the annualized standard deviation of the fitted value from this regression, which captures the systematic volatility of the reversal strategy due to VIX changes, i.e. its volatility risk. The figure shows that the volatility risk of the reversal strategy is substantial and that it covaries strongly with the level of VIX (the raw correlation is 58%). This confirms the prediction that when VIX is high the reversal strategy is exposed to more volatility risk, which is consistent with its higher premium.
"
Are you looking for more strategies to read about? Sign up for our newsletter or visit our Blog or Screener.
Do you want to learn more about Quantpedia Premium service? Check how Quantpedia works, our mission and Premium pricing offer.
Do you want to learn more about Quantpedia Pro service? Check its description, watch videos, review reporting capabilities and visit our pricing offer.
Do you want algorithmic access to the full Quantpedia database via the API? Subscribe to Quantpedia Pro, ask for an API key, and explore the in/out-of-sample statistics, source academic papers, and code snippets — ideal for quantitative research, systematic trading workflows, and AI model training.
Are you looking for historical data or backtesting platforms? Check our list of Algo Trading Discounts.
Or follow us on:
Facebook Group, Facebook Page, Telegram, Twitter, Linkedin, Medium or Youtube
Share onLinkedInTwitterFacebookRefer to a friend


