NFTs: Important Preliminary Risk and Return Analysis
NFTs are taking the cryptocurrency trading world by storm. NFTs stand for the non-fungible tokens which have emerged as another possible usage of blockchain technology. NFT can be used to record/verify/track the ownership of a unique – hence the non-fungible asset. Commonly, NFTs are connected with art (visual art, music, etc.), but there are also several decentralized finance or gaming-related projects.
Same as for the other blockchain-related projects, the critics are easy to find, so a research paper with hard data concerning the NFTs can be of great importance. The research paper by Mazur(2021) studies the NFT startups traded in the crypto markets. Therefore, the paper does not analyze the individual NFTs, such as some pieces of art available for purchase at the NFT marketplace for cryptoart, but rather the whole projects and their tokens traded on the Binance crypto exchange. For example, one of the projects is the Audius aiming to allow anybody to share, monetize, and listen to audio. The platform has its own token $AUDIO (examined by the paper), which is used to secure the platform, and by staking it, people can access exclusive features and receive a share of network fees.
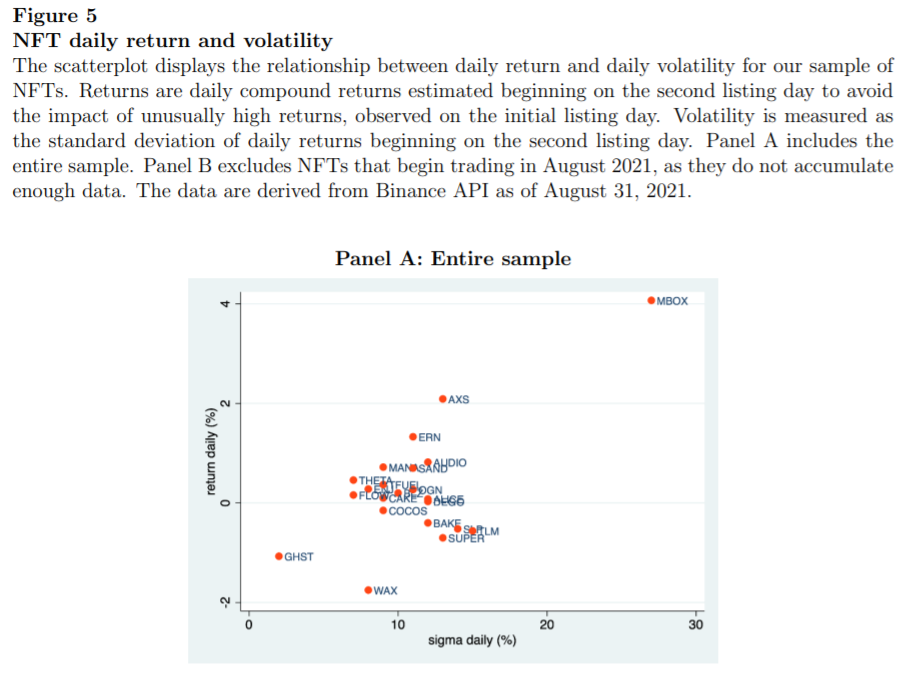
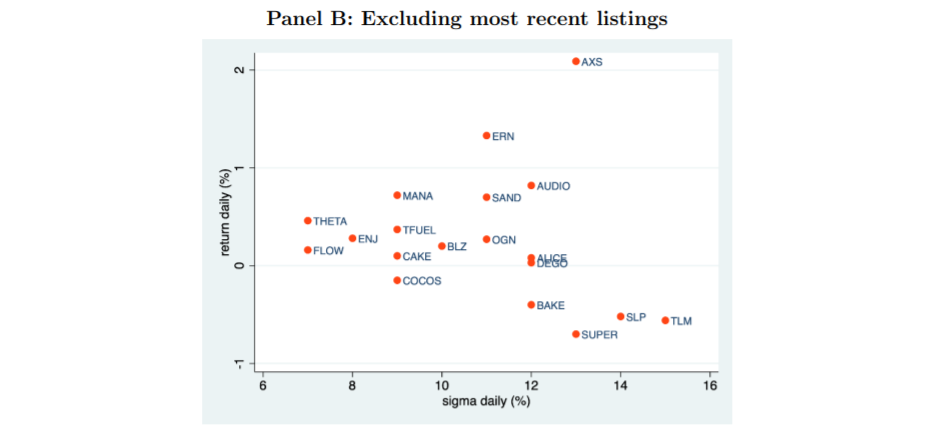
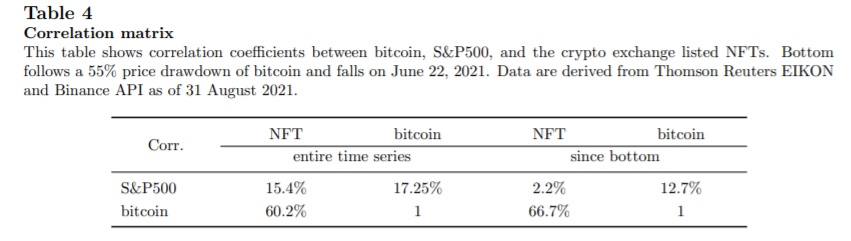
So what about the results? The NFTs are similar to the IPOs, earning a high first-day return with abnormally high volume. However, contrary to the IPOs, the subsequent long-term return is not negative but positive. As expected, the high returns also come with a high risk, measured by the volatility. Despite that, NFTs have a low correlation with S&P 500 and a positive Bitcoin CAPM alpha. But we advocate extreme caution because this data analysis is based on a short time period, and we all know that cryptocurrency markets are prone to crash at precisely the same time as the broad stock market. Plus, the skewness of this market is also extreme – one outlier (Axie Infinity Shards) drives the whole outperformance of NFTs against Bitcoin’s benchmark price index.
To sum it up, even though the NFTs are novel and by no means safe investments, the short up-to-date data shows that the NFTs might have their place in less risk-averse or even risk-hungry portfolios.
Author: Mieszko Mazur
Title: Non-Fungible Tokens (NFT). The Analysis of Risk and Return
Link: https://papers.ssrn.com/sol3/papers.cfm?abstract_id=3953535
Abstract:
This study examines the risk and return characteristics of the NFT-based startups listed on the cryptocurrency exchange. Our investigation is motivated by the recent surge in the NFT activity on the part of creators, investors, and traders. We begin by proposing novel classification of the existing NFTs that range from NFT blockchains through NFT metaverse to NFT DeFi. Next, we establish that NFTs: 1) earn 130% on the first-listing-day; 2) yield an investment multiple of 40 (roughly 4,000%) over the long-term, which is four times higher than bitcoin during the same period; 3) deliver positive and significant alpha and exhibit above-average beta. We also show that the NFT segment of the cryptocurrency market leads market recovery following the mid-2021 crash and generate a return of close to 350%. In the final analysis of the paper, we find that NFT infrastructure integrated within the existing blockchains increase market valuations of these networks.
As always we present several interesting figures:

Notable quotations from the academic research paper:
“Non-fungible token (NFT) is a way to record, verify, and track the ownership of a unique asset, either physical or digital. Consequently, NFTs can be utilized to represent a work of art, futures contract, music score, book, real estate, etc. – any type of object that could be considered unique or rare. NFTs are minted, stored and transferred on a blockchain, and therefore cannot be seized or tampered with by bad actors. On the other hand, NFTs can provide an instant proof of authenticity and provenance, thus eliminating the problem of counterfeiting. In the first half of 2021, NFT sales rose to a record $2.5 billion.
| Algo Trading Promo Codes are available exclusively for Quantpedia’s readers. |
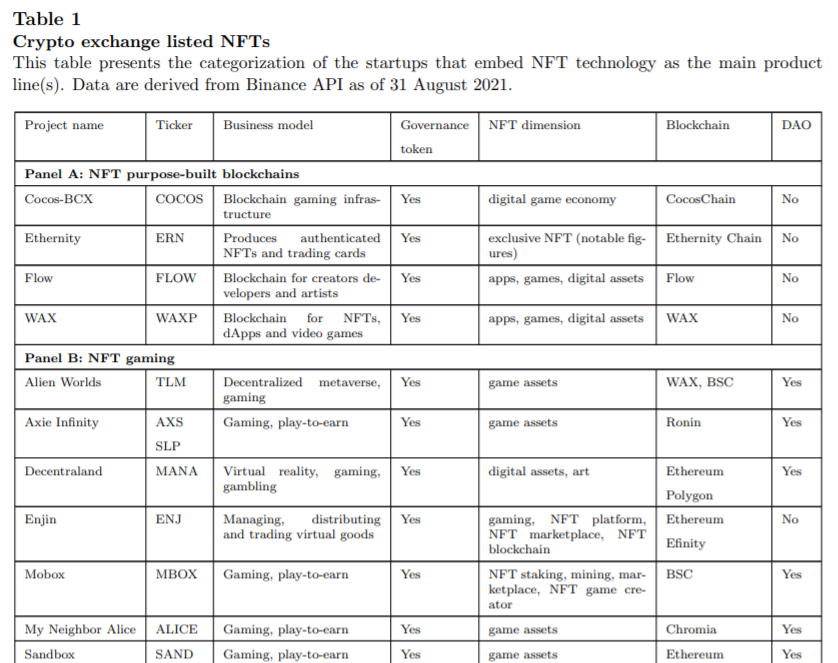
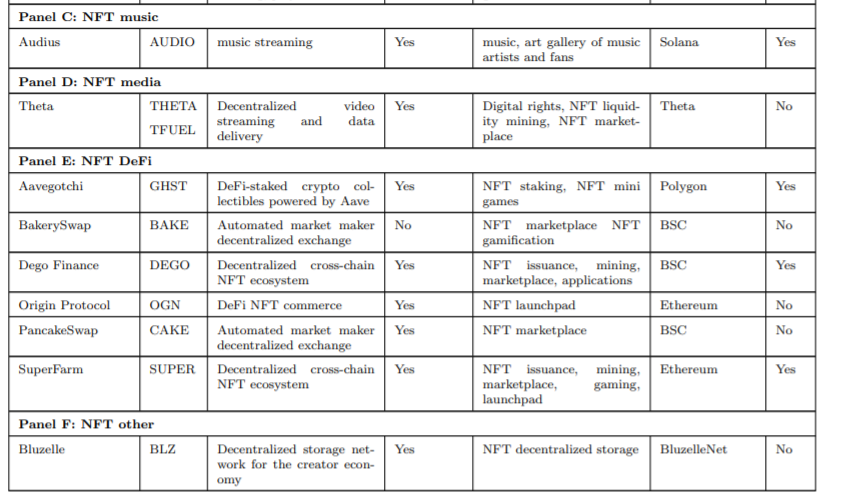
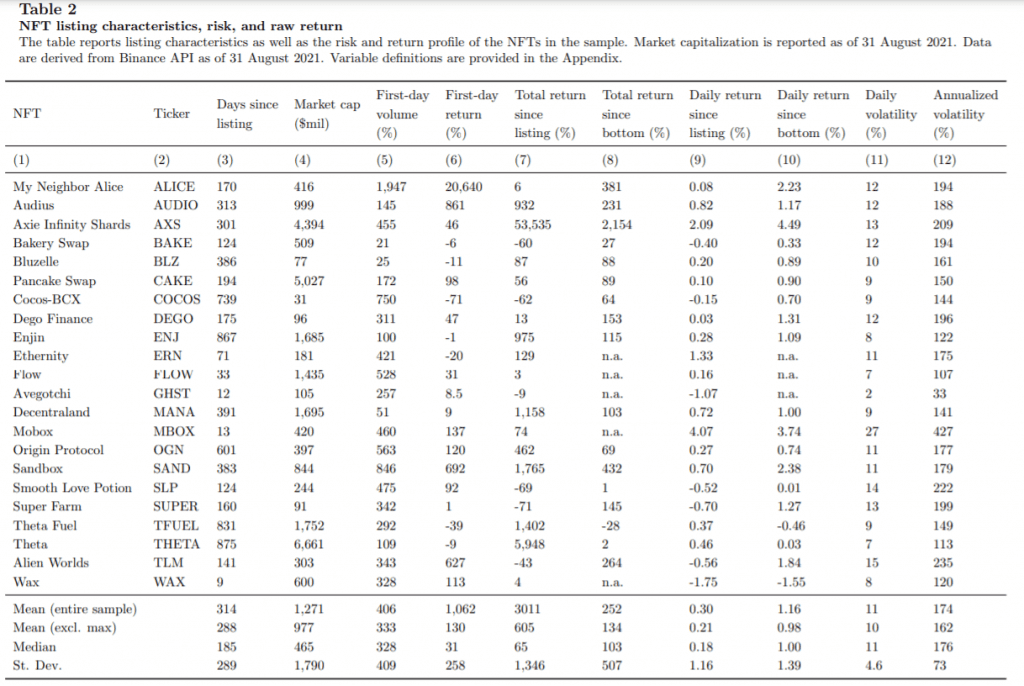
First, we propose the novel classification of the NFT firms driven by the advancements in the NFT technology. Most of these projects are linked to the NFT gaming, NFT decentralized finance (DeFi), and NFT-dedicated blockchains – networks built solely for the purpose of serving the NFT primary and secondary markets, as well as other NFT applications. Next, by analogy to the IPO, we move on to the analysis of the first-day trading characteristics. We find that, at the time of listing, the average NFT has roughly a unicorn status with 977 ($mil) of market capitalization. The average first trading day return is an astounding 130% on a raw basis, and the first trading day volume is about 333% of the average daily volume. To put these numbers into context, first day returns to IPO are an order of magnitude lower. For example, Loughran and McDonald (2013) report the first-day return of 35% at the mean (they consider it high), whereas Aggarwal et al. (2002) find the first-day post-IPO volume of about 130%.
We calculate raw buy-and-hold returns starting one day after the listing day – an approach that eliminates the impact of large returns observed on the first day of trading. We find that NFTs yield spectacularly high returns in the long-run. Because the returns are abnormally high, we adopt the approach used in the venture capital (VC) industry and present the results as investment multiples, defined as the net proceeds from selling the cryptocurrency divided by the net cost of buying the cryptocurrency. The average value of the multiple in our sample is 6 (600% in percentage terms). It implies that the typical NFT generates the return six times greater than the cost of investment.
Remarkably, compared to typical winners firm in a VC portfolio (see e.g., Harris, Jenkinson, and Kaplan, 2014), NFTs appear to yield much higher returns in a much shorter time frame. It is worth emphasizing that our analysis is based on the publicly available cryptocurrency trading data. Knowing that the prices at which tokens are sold to institutional investors in a private pre-sales are significantly lower than the priceson the first-listing day, the true magnitude of the NFT investment multiples must be substantially higher. Finally, our sample includes only about 23% NFTs that generate long-term losses.
The levels of volatility observed for the NFTs in our sample may seem excessive with the standard deviation of daily returns of 11% (175% annualized). By comparison, the annualized volatility of natural gas is 51%, oil 30%, and S&P 500 index 15% (Huang, Li, Wang, and Zhou, 2020). We also find that most volatile NFTs, yield the lowest returns. A similar pattern is observed for public equities (Campbell and Hentschel, 1992), whereby volatility tends to rise after the prices fall. However, in the context of cryptocurrencies, this finding cannot be in any way explained by the leverage effect, as the NFT startups are debt-free.
Next, we estimate the NFT alphas and betas. We follow Aggarwal, Green and Ren (2018) and use capital asset pricing model (CAPM), as a single-factor model seems to work better for alternative investments. We find that several NFTs deliver positive and significant alphas, whereas most NFTs have betas greater than 1. At the NFT portfolio level, alpha is positive and highly significant and the portfolio beta is roughly 1.1. Beta greater than 1 reflects greater volatility of NFTs with respect to bitcoin price movements. This finding makes sense, since if bitcoin were to fail as a technology then most likely other networks would fail as well – they are less resilient to common risk factors (lower security) and have significantly shorter history. Positive and significant alpha implies higher than expected returns due to additional risks to which NFTs might be exposed. These risks may arise from new and untested technology used by NFT-driven startups, prototype nature of their products and business models, regulatory uncertainty, and many others.
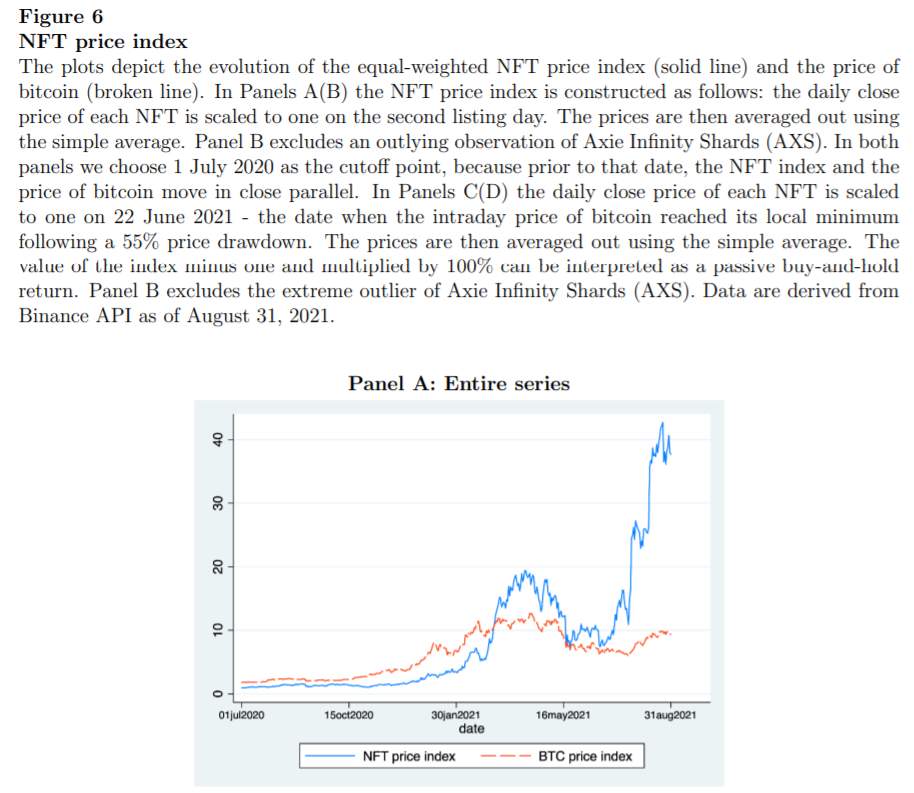
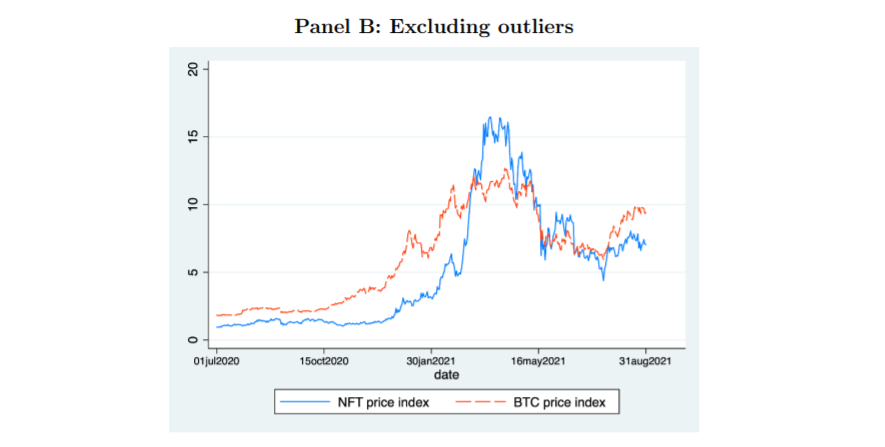
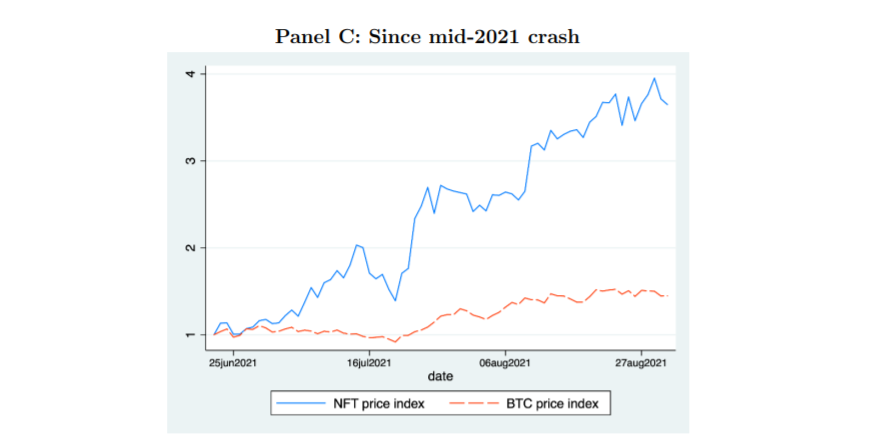
In the subsequent analysis, we construct the equal-weighted NFT price index. The objective is to indicate visually the performance of the NFT portfolio against the backdrop of the return to bitcoin – the oldest, most valuable, and trusted cryptocurrency. We are particularly interested in gauging how NFTs respond to the bitcoin drawdown that occurred in the mid 2021, when bitcoin lost about 55% of its market value (based on the intraday minimums and maximums). The magnitude of the drawdown compares in percentage terms with the bitcoin price drop in March 2020 triggered by COVID-19. First, we find that the portfolio of NFTs outperforms bitcoin in the long-run within the time-window starting on the initial listing day and ending on the last day of the sample period. The NFT investment multiple is close to 40 (4000%), compared to 10 (1000%) earned by bitcoin over the same time span. Second and equally important, the NFT portfolio outperforms bitcoin following the crash of mid-2021. The realized multiples are much smaller (3.5 vs. 1.5), however, what is perhaps more interesting is that NFT segment leads the crypto market recovery after the market bottoms out in the summer of 2021.
We follow the standard event study methodology to estimate daily cumulative abnormal returns around NFT announcements and report the valuation effects based on a two day window (-1 to 0). We find that the integration of the NFT studios and NFT marketplaces within the existing blockchain architecture generates billions of the combined dollar gains. For example, the announcement of the two innovative NFT endeavors to be built on Solana blockchain increases Solana’s market capitalization by 22% or $3 billion in dollar terms.”
Are you looking for more strategies to read about? Sign up for our newsletter or visit our Blog or Screener.
Do you want to learn more about Quantpedia Premium service? Check how Quantpedia works, our mission and Premium pricing offer.
Do you want to learn more about Quantpedia Pro service? Check its description, watch videos, review reporting capabilities and visit our pricing offer.
Do you want algorithmic access to the full Quantpedia database via the API? Subscribe to Quantpedia Pro, ask for an API key, and explore the in/out-of-sample statistics, source academic papers, and code snippets — ideal for quantitative research, systematic trading workflows, and AI model training.
Are you looking for historical data or backtesting platforms? Check our list of Algo Trading Discounts.
Or follow us on:
Facebook Group, Facebook Page, Telegram, Twitter, Linkedin, Medium or Youtube
Share onLinkedInTwitterFacebookRefer to a friend


