Out-of-Sample Test of Formula Investing Strategies
Can we simplify the complexities of the stock market and distill them into a simple set of quantifiable metrics? A lot of academic papers suggest this, and they offer formulas that should make the life of a stock picker easier. Some of the most compelling methodologies within this realm are the F-Score, Magic Formula, Acquirer’s Multiple, and the Conservative Formula. These quantitative strategies are designed to identify undervalued stocks with robust fundamentals and potential for high returns. But do they really work out-of-sample? A new paper by Marcel Schwartz and Matthias X. Hanauer tries to answer this interesting question…
Formula investing isn’t just a game of chance; it’s a methodical pursuit grounded in financial principles and economic theories. The F-Score, developed by Professor Joseph Piotroski, utilizes nine criteria to assess a company’s financial strength, providing a comprehensive snapshot of its viability. Joel Greenblatt’s Magic Formula targets stocks with high earnings yields and high returns on capital, simplifying the stock-picking process. The Acquirer’s Multiple, on the other hand, focuses on cash flows and earnings before interest and taxes, offering a unique perspective on valuation. Lastly, the Conservative Formula, emphasizing capital preservation and risk management, provides a balanced approach to investing.
Featured study evaluates the effectiveness of these four popular investing formulas over an extensive period from 1963 to 2022 for the U.S. market. The findings indicate that each formula generates significant raw and risk-adjusted returns, outperforming the market primarily by providing efficient exposure to value and quality factors. The Conservative Formula is the most distinct strategy, offering positive momentum exposure and consistently low volatility, making it the most defensive strategy among the four. The study confirms that all formulas exhibit predictive power in the cross-section of stock returns. However, no single formula consistently dominates across different performance metrics.
- The Acquirer’s Multiple achieves the highest returns for top-decile portfolios, while the Conservative Formula leads in CAPM alpha and return spread. After adjusting for established asset pricing factors, the Magic Formula displays the highest remaining alpha.
- The Magic Formula and Conservative Formula are particularly effective in the post-2000 period, especially in concentrated long-only portfolios.
- The Magic Formula demonstrates strong performance with moderate risk, achieving the highest raw returns among the formulas for capped-value-weighted portfolios. Conversely, the Conservative Formula excels in risk-adjusted performance, with the lowest maximum draw-down and a notably low beta.
Compared to the existing literature, the study’s findings align with previous research on the profitability of these formulas. All formulas continue to generate market out-performance, although the returns tend to be lower than the original findings, primarily due to the exclusion of microcaps, the inclusion of out-of-sample years, and methodological differences. The study demonstrates that formula-based investing can still generate market out-performance, providing investors with efficient exposure to well-documented factor premiums. These strategies thus offer relatively easy-to-implement options for investors but also require investor discipline as these strategies may underperform in the short term. As the effectiveness of these formulas has weakened in recent years, findings also indicate the importance of continuous innovation in investing strategies.
Authors: Marcel Schwartz and Matthias X. Hanauer
Title: Formula Investing
Link: https://papers.ssrn.com/sol3/papers.cfm?abstract_id=5043197
Abstract:
This study evaluates the effectiveness of four popular investing formulas—the F-Score, Magic Formula, Acquirer’s Multiple, and Conservative Formula—within a unified framework over an extensive period. Each formula generates significant raw and risk-adjusted returns, primarily by providing efficient exposure to well-established style factors. However, no single formula consistently outperforms across all metrics. The Acquirer’s Multiple achieves the highest returns for top decile portfolios, the Conservative Formula leads in CAPM alpha and return spread, and the Magic Formula exhibits the highest remaining alpha after adjusting for common factors. While all formulas remain successful for concentrated long-only portfolios in the post-2000 period, we observe some performance decay relative to earlier periods, underscoring the need for continuous innovation in investing strategies.
As usual, we present several enjoyable figures and tables:


Notable quotations from the academic research paper:
“Our main findings are summarized as follows. First, we find that all formulas lead to near-monotonically increasing returns when sorting stocks into decile portfolios. As a result, the top portfolios outperform both the market and the bottom portfolios. Furthermore, the top-minus-bottom portfolios exhibit significant annual raw returns ranging from 5.6% to 6.4%, while the CAPM alphas range from 7.0% to 12.2%. While the formulas show strong performance over the full sample, they also exhibit periods of pronounced underperformance and indications of performance decay in the post-2000 period. Second, factor-spanning tests reveal that the formulas achieve this outperformance primarily by providing efficient exposure to established asset pricing factors such as value, profitability, and momentum. Third, concentrated long-only portfolios of the 40 top-ranked formula stocks also outperform the market in the post-2000 period, both in terms of raw and risk-adjusted returns. However, all investing formulas suffer from substantial relative drawdowns during the 2018-2020 period. Finally, we document that no single investing formula dominates across all performance evaluation metrics. In the decile analysis, the Acquirer’s Multiple exhibits the highest return for the top portfolio, while the Conservative Formula has the highest top-minus-bottom return and CAPM alpha spread. Conversely, the Magic Formula achieves the highest remaining alpha when controlling for common asset pricing factors. For concentrated capped-value-weighted portfolios of 40 stocks in the post-2000 period, the Magic and Conservative Formulas offer the highest raw and risk-adjusted performance, respectively.
Finally, the investigated investment formulas are relatively easy to implement, which distinguishes them from more complex and sophisticated models, such as machine-learning prediction models, which have become popular in recent years, cf., Rasekhschaffe and Jones (2019), Gu et al. (2020) or Hanauer and Kalsbach (2023). Although these more complex models typically provide higher gross returns (cf., Blitz et al. 2023a), they also entail higher turnover and transaction costs. Moreover, investors may encounter additional investment barriers, including limited access to the necessary data, missing infrastructure to process the data, or the inability to execute the resulting signals in a timely and efficient manner (cf., Blitz et al. 2023b). These more sophisticated models present therefore only genuine opportunities for those investors who are able to overcome these challenges. In contrast, the investigated investing formulas provide investors with efficient exposure to established factor premiums and are relatively easy to implement.
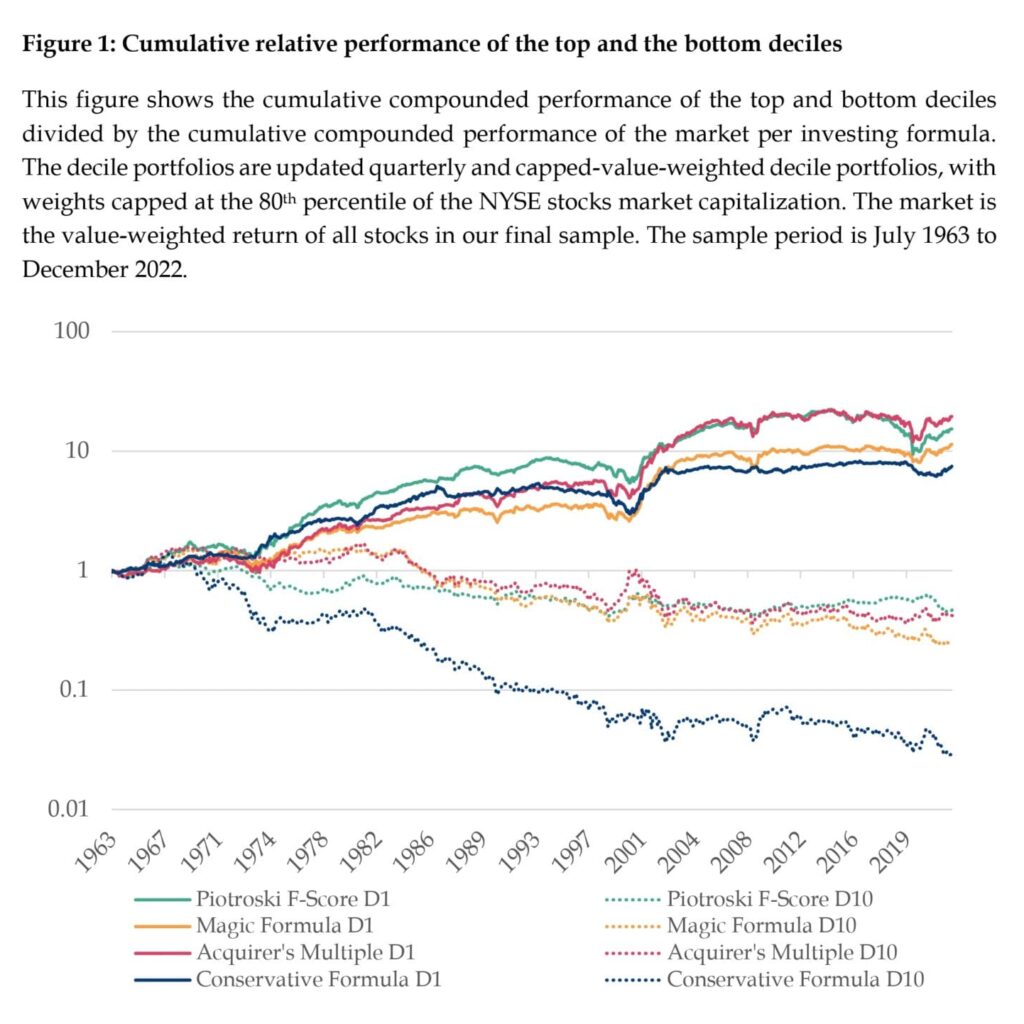
The full-sample period consists of almost 60 years of data, and we will test for consistency over time. Figure 1 displays the cumulative compounded performance of the top and bottom deciles divided by the cumulative compounded performance of the market per investing formula.10
Evidence from the previous long-short analyses indicates that the formulas have predictive power on stock returns. Still, this standard academic approach requires shorting, and the results over time also revealed a weakening of alphas after 2000. Therefore, we apply a “do-it-yourself” perspective on all four formulas.
Table 3 presents the performance summary statistics for concentrated long-only portfolios of the 40 top-ranked stocks per investing formula, both for capped-value-weighted and equally-weighted portfolios from January 2000 to December 2022.11 The results reveal several key insights into the effectiveness and risk profiles of each formula. We always start with the results for the value-weighted portfolios and mention differences for the equal-weighted portfolios.”
Are you looking for more strategies to read about? Sign up for our newsletter or visit our Blog or Screener.
Do you want to learn more about Quantpedia Premium service? Check how Quantpedia works, our mission and Premium pricing offer.
Do you want to learn more about Quantpedia Pro service? Check its description, watch videos, review reporting capabilities and visit our pricing offer.
Are you looking for historical data or backtesting platforms? Check our list of Algo Trading Discounts.
Would you like free access to our services? Then, open an account with Lightspeed and enjoy one year of Quantpedia Premium at no cost.
Or follow us on:
Facebook Group, Facebook Page, Twitter, Linkedin, Medium or Youtube
Share onLinkedInTwitterFacebookRefer to a friend


