Periodicity in Cryptocurrencies – Recurrent Patterns in Volatility and Volume
In the financial markets, recurrent patterns have significant implications for volatility measurement, modeling, and forecasting. For example, while measuring volatility, it is valuable to know if the observed change in volatility merely follows the expected pattern or reflects an unanticipated change. Similarly, understanding the empirical patterns in trading volume makes it easier to distinguish between the usual variations and unexpected shifts.
The high-frequency data in cryptocurrency markets is available at any time of the day, which facilitates the studies of periodicity measures beyond what’s possible in other markets. Previous studies have documented the recurrent patterns in cryptocurrencies and found that variation in volatility and volume coincides with the stock exchange trading hours or algorithmic trading activities. The research paper by Hansen, Kim, and Kimbrough (2021) investigates the periodicity in volatility and liquidity in two major cryptocurrencies, Bitcoin and Ether, using data from three exchanges, Binance, Coinbase Pro, and Uniswap V2. In particular, the authors measure relative volatility and relative volume across days, hours, and minutes. Their results have confirmed the presence of recurrent patterns in volatility and volume in studied cryptocurrencies for the periods day-of-the-week, hour-of-the-day, and within the hour. Although the first two findings were already reported in previous research, this is the first study to document the distinct patterns within an hour. Specifically, Bitcoin and Ether exhibit a large burst in volatility during the first minute of the hour, medium bursts immediately after 15, 30, and 45 minutes, and smaller bursts every five minutes. The authors postulate that many of these patterns are driven by algorithmic trading, while some are likely related to funding rates for perpetual futures. Therefore, understanding the periodicity in cryptocurrency markets is crucial for the proper interpretation of real-time changes in volatility and volume.
Authors: Peter Reinhard Hansen, Chan Kim, and Wade Kimbrough
Title: Periodicity in Cryptocurrency Volatility and Liquidity
Link: https://arxiv.org/abs/2109.12142
Abstract:
We study recurrent patterns in volatility and volume for major cryptocurrencies, Bitcoin and Ether, using data from two centralized exchanges (Coinbase Pro and Binance) and a decentralized exchange (Uniswap V2). We find systematic patterns in both volatility and volume across day-of-the-week, hour-of-the-day, and within the hour. These patterns have grown stronger over the years and can be related to algorithmic trading and funding times in futures markets. We also document that price formation mainly takes place on the centralized exchanges while price adjustments on the decentralized exchanges can be sluggish.
As always we present several interesting figures:
Notable quotations from the academic research paper:
“Cryptocurrencies differ from most other markets by being open for trading 24 hours a day, seven days a week. Trading activity is continuously high, and therefore, high-frequency data is available at any time of the day for all major cryptocurrencies. This availability of data facilitates studies of periodicity in volatility and market liquidity measures beyond what is possible in other markets. In this paper, we investigate periodicity in volatility and liquidity in two leading cryptocurrencies, Bitcoin and Ether, using data from three exchanges, Binance, Coinbase Pro, and Uniswap V2.
| Do you want to test these ideas yourself? We offer our readers Historical Trading Data Discounts. |
To measure patterns in volatility and volume, we introduce relative measures of volatility and volume across days, hours, and minutes. We measure volatility using absolute returns rather than squared returns. The reason being that absolute returns are less sensitive to “outliers” and suffice for measuring relative volatility. Absolute returns and the closely related range-based measures are commonly used to measure and model volatility, see e.g. Alizadeh et al. (2002). The corresponding results, based on squared returns, are very similar and, as expected, are a bit more noisy. The relative measures gain additional robustness by being averages of variables that are bounded between zero and one.
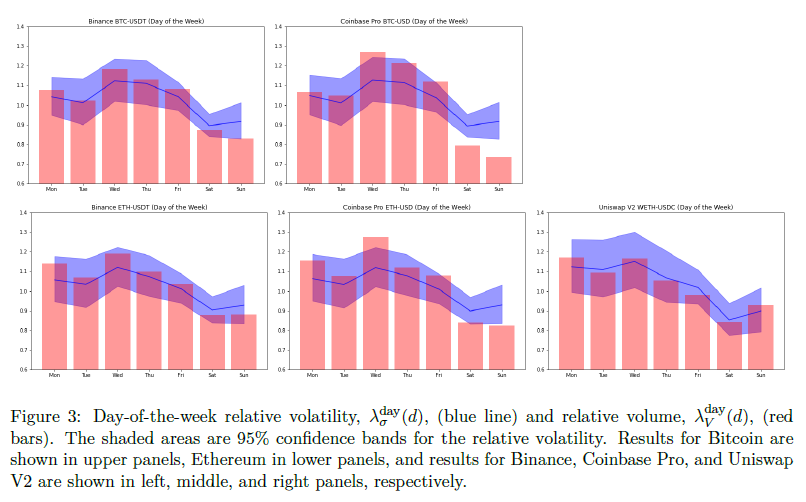
We present the daily relative measures of volatility and volume in Figure 3 for each of the five currency pairs. If volatility and/or volume was evenly distributed over the week, we would expect all measures to be about one. However, both volatility and volume tend to be smaller on weekends, which is most pronounced on Saturdays. Note that the relative volume varies more than the relative volatility on the centralized exchanges, which suggests that volume is more concentrated than volatility.
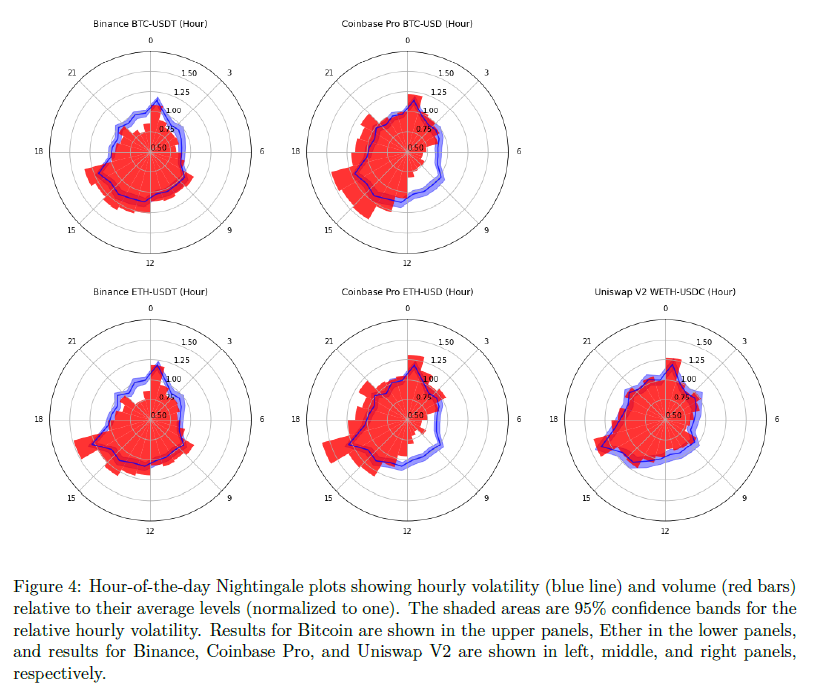
For hours-of-the-day we present our results in Figure 4. Due to arbitrageurs, price and volatility show high levels of agreement between Binance and Coinbase Pro. For hour-of-the-day, WETH/USDC on Uniswap V2 also demonstrates similar intraday volatility patterns as the centralized exchanges, volatility tends to be high around 16 UTC and hit bottom near 5 UTC. Unlike volatility, we observe some differences in the patterns of hour-of-the-day volume. These patterns are consistent with the geographical distribution of users. Coinbase Pro has substantially less volume in the hours from 5 UTC to 12 UTC, which coincides with night time in North America. This finding is intuitive because the majority of web-traffic to Coinbase Pro is from the US. The web-traffic to Binance is less concentrated on time-zones, which is consistent with a relatively more even distribution of volume. Notice that relative volatility and volume have very similar patterns for Uniswap V2. This is a natural consequence of AMM protocols where a price change is directly tied to trading volume (i.e. the amount of a trade determines the price movement along the constant function curve). This is in contrast to order book based markets where prices can change without trading volume and large price changes can in principle take place with little trading volume. Notice the spikes in volume and volatility at 0h and 16h, and less noticeable spikes at 8h. These are observed across all exchanges and for both BTC and ETH. These coincide with funding times in future markets, as we discuss further below.
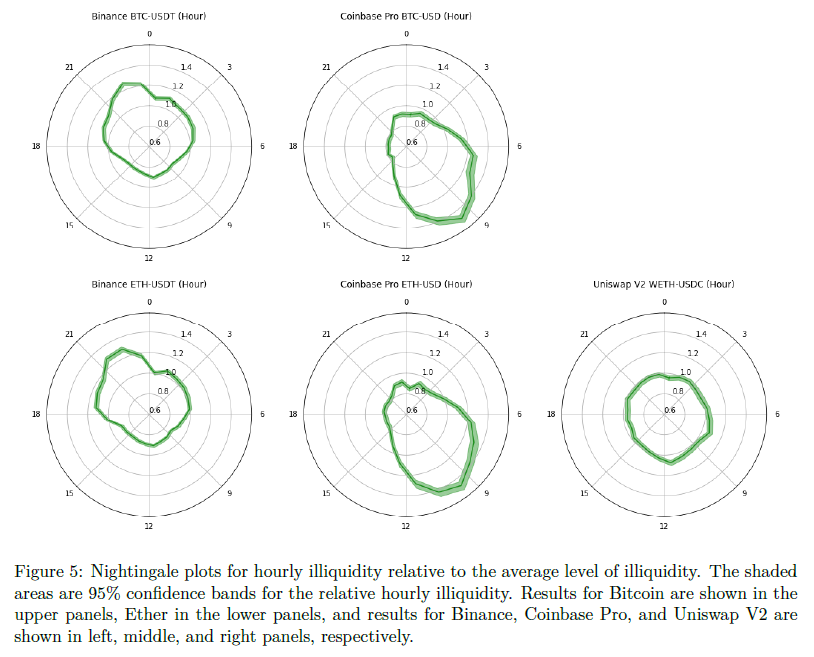
We can combine our measurements of volatility and volume into a relative measure of illiquidity based on Amihud (2002). The distribution of illiquidity over the hours of the day is show in Figure 5. For Binance, the relative illiquidity is largest during night time in East-Asia where it is about 30% larger for both Bitcoin and Ether. For Coinbase Pro, we see the opposite distribution with illiquidity peaking at 10:00 UTC, which is early in the morning in the US. The variation in the liquidity measure is a bit larger for Coinbase, ranging from about 80% to nearly 150%. We also observe that the illiquidity patterns for a given exchange, Binance and Coinbase Pro, are nearly identical for the two cryptocurrencies. For Uniswap V2, the liquidity is quite evenly distribution over the 24 hours of the day and never deviates more than 5 percent from the average. This is largely a feature of the design of the decentralized exchanges where changes in prices are directly linked to trading.
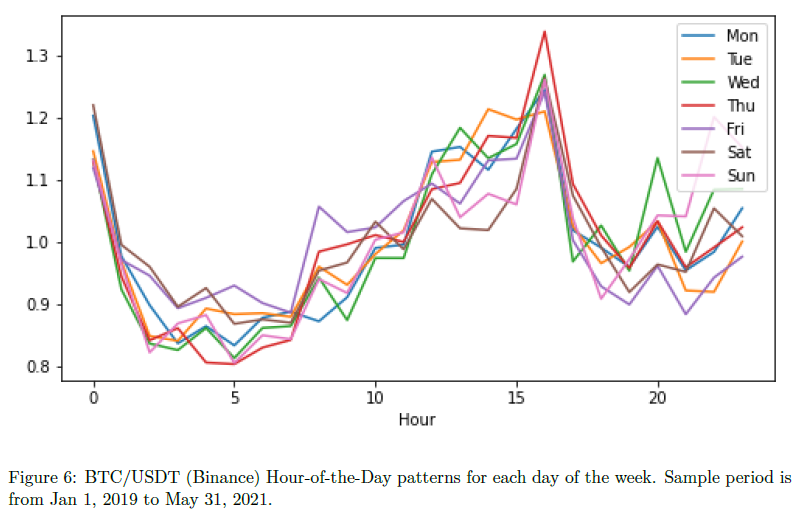
We have seen evidence of strong patterns in volatility and volume across weekdays and hours of the day. Some of these patterns could, in principle, be driven by particular weekdays or hours of the day. For this reason we proceed to investigate if the hour-of-the-day effect varies by weekday. Figure 6 shows that the distribution of volatility over the hours of the day are fairly similar across weekdays. The 1st hour and the hour after 16:00 UTC tend to have the highest level of volatility. The ratio of volatility during the first hour of the day is particularly large on Mondays, while the 13th and 15th hours tend to be relatively calmer on Fridays, Saturdays, and Sundays than on other weekdays.
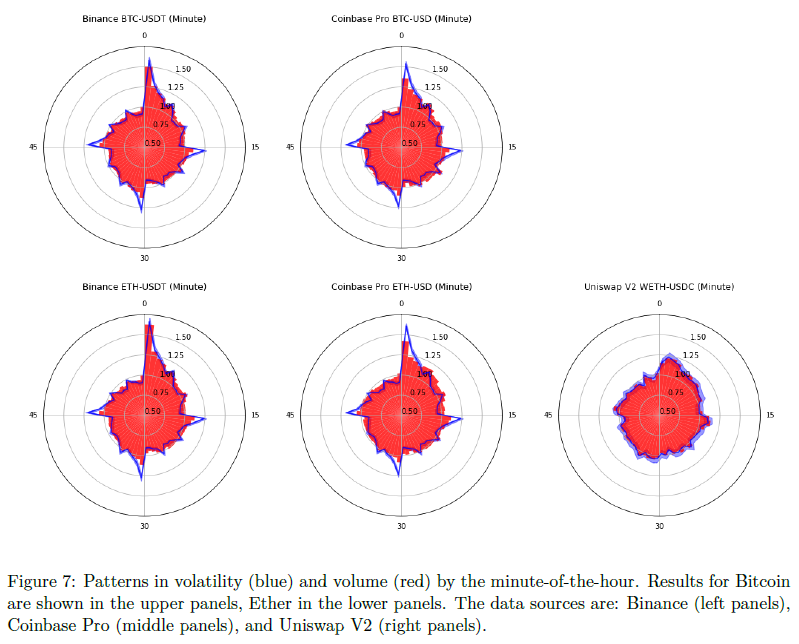
Next we turn to the minute-of-the-hour analysis. The Nightingale plots are shown in Figure 7. These plots show very strong minute-of-the-hour patterns on the centralized exchanges. These patterns are most pronounced in volatility. There is a large burst in volatility during the first minute of the hour and medium bursts immediately after minutes 15, 30, and 45, and smaller bursts every five minutes. The most likely explanation for these patterns is algorithmic trading, possibly magnified by individual traders who rely on chart signals.
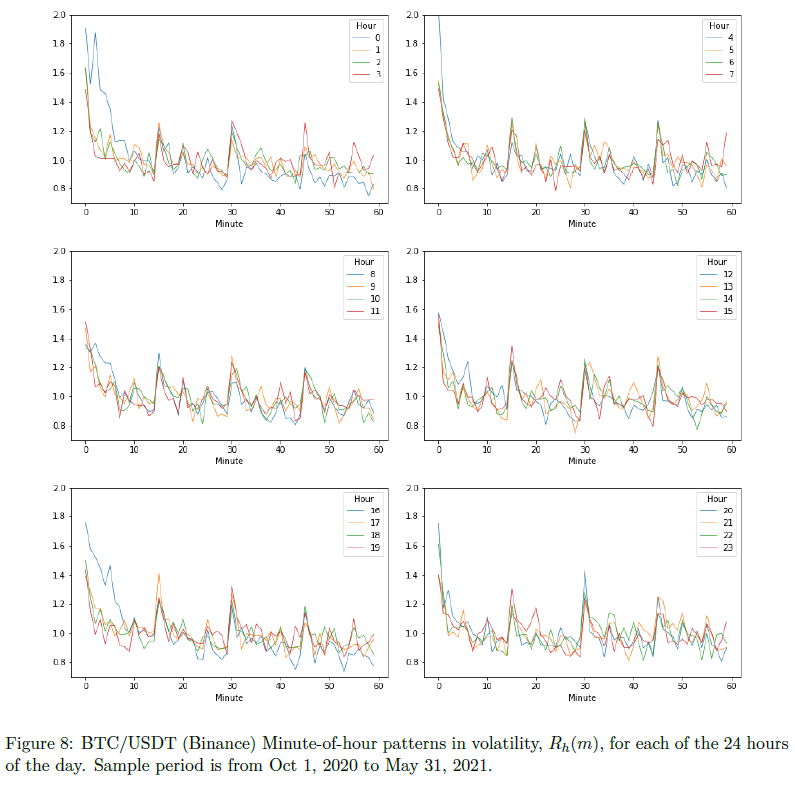
We proceed to see if the minute-of-the-hour volatility is similar across hours of the day or more pronounced on certain hours of the day. Figure 8 presents the distribution of volatility over the minutes of the hour, for each of the 24 hours of the day. The patterns we observe in Figure 7 are also observed for each of the 24 hours. The first minute of the hour tends to have the most volatility with peaks every 15 minutes, and smaller peaks every 5 minutes across most hours. The minute-of-the-hour effect tends to be most pronounced every fourth hour, 00h,. . .,20h, with the exception of 08h. We conjecture that these patterns are related to the funding of perpetual futures. On Binance, the funding takes occur at 00h, 08h, and 16h, on FTX at every hour, and on Bitmex at 04h, 12h, 20h in UTC.
Periodicity is important for the interpretation of changes in real-time measures of volatility and volume. For instance, an observed change in volatility may signal an unanticipated change in the level of volatility, and this may be important new information. However, if the change is fully anticipated because it follows the pattern of volatility that is typically seen at this time, then the change in volatility does not reflect new information. Therefore, the usefulness of information contained in a measurement is not the measurement itself, but is the difference between the actual measurement and the expected measurement, and periodicity is an important component of the latter.”
Are you looking for more strategies to read about? Sign up for our newsletter or visit our Blog or Screener.
Do you want to learn more about Quantpedia Premium service? Check how Quantpedia works, our mission and Premium pricing offer.
Do you want to learn more about Quantpedia Pro service? Check its description, watch videos, review reporting capabilities and visit our pricing offer.
Do you want algorithmic access to the full Quantpedia database via the API? Subscribe to Quantpedia Pro, ask for an API key, and explore the in/out-of-sample statistics, source academic papers, and code snippets — ideal for quantitative research, systematic trading workflows, and AI model training.
Are you looking for historical data or backtesting platforms? Check our list of Algo Trading Discounts.
Or follow us on:
Facebook Group, Facebook Page, Telegram, Twitter, Linkedin, Medium or Youtube
Share onLinkedInTwitterFacebookRefer to a friend


