Returns to Investors in Initial Coin Offerings
A very interesting research paper we recommend to read to all cryptocurrency traders and investors:
Authors: Benedetti, Kostovetsky
Title: Digital Tulips? Returns to Investors in Initial Coin Offerings
Link: https://papers.ssrn.com/sol3/papers.cfm?abstract_id=3182169
Abstract:
Initial coin offerings (ICOs), sales of cryptocurrency tokens to the general public, have recently been used as a source of crowdfunding for startups in the technology and blockchain industries. We create a dataset on 4,003 executed and planned ICOs, which raised a total of $12 billion in capital, nearly all since January 2017. We find evidence of significant ICO underpricing, with average returns of 179% from the ICO price to the first day’s opening market price, over a holding period that averages just 16 days. Even after imputing returns of -100% to ICOs that don’t list their tokens within 60 days and adjusting for the returns of the asset class, the representative ICO investor earns 82%. After trading begins, tokens continue to appreciate in price, generating average buy-and-hold abnormal returns of 48% in the first 30 trading days. We also study the determinants of ICO underpricing and relate cryptocurrency prices to Twitter followers and activity. While our results could be an indication of bubbles, they are also consistent with high compensation for risk for investing in unproven pre-revenue platforms through unregulated offerings.
Notable quotations from the academic research paper:
"The traditional sources for seed and early-stage funding have recently been supplemented with crowdfunding: raising money from many small investors, in small amounts, over the Internet. Early on, crowdfunding was provided in exchange for future rewards or deals on products (e.g., Indiegogo, Kickstarter), and more recently for securities (equity crowdfunding). Advances in the blockchain technology have also led to a new hybrid form of crowdfunding: token offerings, also known as initial coin offerings (ICOs), which are the subject of this paper.
Tokens are cryptocurrencies, digital currencies for which all records and transaction data are protected by cryptographic methods. Entrepreneurs issue branded tokens to raise capital to create an online platform or ecosystem, in which all transactions require the use of that native token. In the 16 months since January 2017, over 1,000 startups successfully raised a total of about $12 billion using ICOs.
The closest analogue to the ICO is the Initial Public Offering (IPO) of equity. In addition to selling a different asset, two key differences between ICOs and IPOs are: (1) ICO firms are much younger and smaller, typically in the earliest stage of a firm’s life cycle, and (2) ICO firms do not use an underwriter to help determine value and attract buyers. As a result, it is not clear how two well-known characteristics of the IPO market, underpricing and post-IPO underperformance translate to ICOs and listed tokens.
In this paper, we study the market for crypto-tokens, focusing on how entrepreneurs determine the price for tokens, the returns to investors from buying tokens during an ICO and selling them once they are listed on an exchange, and the returns to investors from investing in tokens on the listing date and holding them for various fixed time horizons. We also use data from Twitter accounts of cryptocurrency firms to investigate the relationship between Twitter followers and activity, and market prices, and to measure the attrition rate of crypto-companies after completion of the ICO. Our paper aims to provide a comprehensive analysis of how startups in this industry transition and perform from birth, through the offering, to the listing, and beyond.
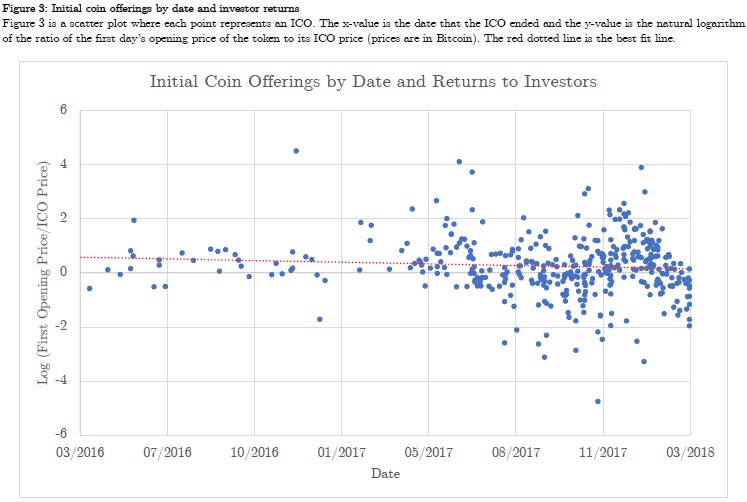
Figure 3 illustrates that most tokens were sold below their market price, but also, that many tokens were overpriced, and declined in value. The red-dashed line, which is the best fit line, is above the x-axis for the entire sample period, indicating that the average (log) return is positive, but it has a negative slope, suggesting that underpricing of tokens has declined over time (i.e., returns to ICO investors have been declining).

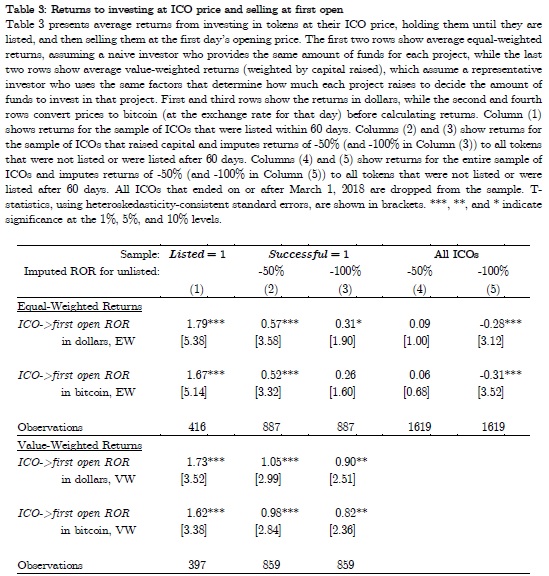
Table 3 shows the average returns to investing in an ICO. We start by calculating returns to investors in 416 ICOs that went on to list, in less than 60 days, and report the results in Column (1) of Table 3. The average of equal weighted returns to investing in listed ICOs is a statistically significant 179% and 167% (in Bitcoin), with a very similar 173% and 162% (in Bitcoin) value-weighted average. From the sellers’ point of view, crypto-companies are, on average, issuing tokens for less than half of their true market value, leaving significant money on the table.
For Columns (2) and (3), we also include (in addition to the 416 listed ICOs) another 471 ICOs that reported raising capital but did not list within 60 days. Since there are no available market values for these tokens in the aftermath of the ICO, we impute returns under two different scenarios. In Column (2), the average imputed return to unlisted tokens is -50%. Unlisted tokens investments are not a total loss if the raised capital is refunded due to inadequate funds, if there is an over-the-counter market for them, or if the tokens are listed on an exchange which is not included in CMC. With imputed returns of -50% to unlisted ICOs, average ICO returns are unsurprisingly lower than in Column (1), 57% and 52% (in Bitcoin) for equal-weighted averages and 105% and 98% (in Bitcoin) for value-weighted averages, but still positive and statistically significant. In Column (3), we look at worst-case scenario, imputing -100% to all ICOs that raised capital but did not list within 60 days. Under this scenario, the equal-weighted average returns are 31% and 26% (in Bitcoin) and are no longer significant at the 5% level, but the value-weighted returns remain larger in magnitude and significant at 90% and 82% (in Bitcoin).
For Columns (4) and (5), we include an additional 732 ICOs that neither reported raising capital nor were listed within 60 days. Again, we calculate and report average equal-weighted investor returns after imputing -50% (in Column (4)) and -100% (in Column (5)) returns to unlisted ICOs. Since these ICOs raised little or no capital, they do not change the value-weighted returns we calculated and displayed in the last two rows of Columns (2) and (3). When including these ICOs, equal-weighted returns are reduced to 9% (6% in Bitcoin) with a -50% imputed return, and -28% (-31% in Bitcoin) with an imputed return of -100%. These are the returns to a naïve investor who invests across all ICOs, even those that didn’t report raising capital, and they provide a lower bound to naïve investor returns. However, they are not at all a realistic estimate of returns, even for naïve investors, because many of the ICOs that don’t report raising capital (and many of those that report raising capital but do not list) either refunded the capital they raised because of inadequate funds or they planned an ICO but never actually began collecting funds.

"
Are you looking for more strategies to read about? Sign up for our newsletter or visit our Blog or Screener.
Do you want to learn more about Quantpedia Premium service? Check how Quantpedia works, our mission and Premium pricing offer.
Do you want to learn more about Quantpedia Pro service? Check its description, watch videos, review reporting capabilities and visit our pricing offer.
Are you looking for historical data or backtesting platforms? Check our list of Algo Trading Discounts.
Would you like free access to our services? Then, open an account with Lightspeed and enjoy one year of Quantpedia Premium at no cost.
Or follow us on:
Facebook Group, Facebook Page, Twitter, Linkedin, Medium or Youtube
Share onLinkedInTwitterFacebookRefer to a friend


