Sell in May and Go Away in the Equity Index Futures Markets
A new related paper has been added to:
#31 – Market Seasonality Effect in World Equity Indexes
Authors: Dzahabarov, Ziemba
Title: Sell in May and Go Away in the Equity Index Futures Markets
Link: http://papers.ssrn.com/sol3/papers.cfm?abstract_id=2721068
Abstract:
The period May 1 to the turn of the month of November (last five trading days October) has historically produced negligible returns. The rest of the year (late October to the end of April) has essentially all the year's gains. In this paper we show that there is a statistically significant difference and conclude that the strategy go to cash in the weak period and go long in the strong period has about double the returns of buy and hold for large cap S&P500 index and triple for the small cap Russell2000 index during the period 1993-2015 in the index futures markets.
Notable quotations from the academic research paper:
"September and October have historically had low stock market returns with many serious declines or crashes occurring in October. Also the months of November to February have historically had higher than average returns. This suggests the strategy to avoid the bad months and be in cash then and only be long the stock market in the good months. Sell-in-May-and-go-away, which is sometimes called the Halloween E ffect, is one such strategy that is often discussed in the financial press.
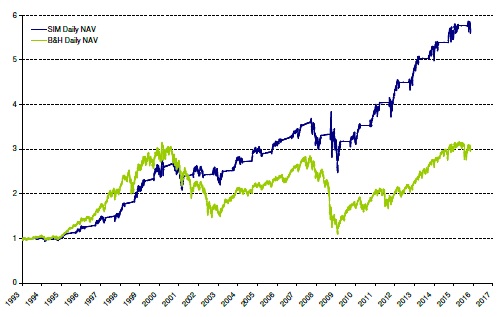
Figure 1: S&P500 Futures Sell in May (SIM) and B&H Cumulative Returns Comparison. 1993-2015. (Entry at Close on 6th Day before End of October. Exit 1st Day of May.)
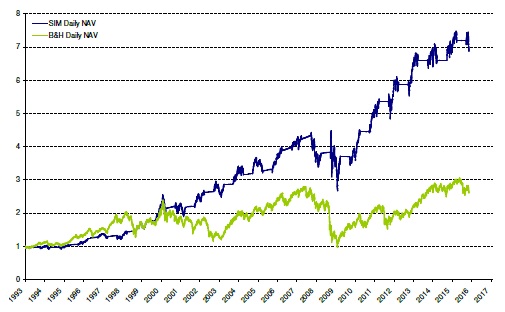
Figure 2: Russell2000 Futures Sell in May (SIM) and B&H Cumulative Returns Comparison. 1993-2015. (Entry at Close on 6th Day before End of October. Exit 1st Day of May.)
For the S&P500 a buy and hold strategy turns $1 on February 4, 1993 into $3.05 on December 16, 2015; whereas, sell in May and move into cash, counting interest (Fed funds e ffective monthly rate for sell in May) and dividends for the buy and hold, had a final wealth of $5.77, some 89.2% higher. For the Russell2000, the final wealths were $2.70 and $7.11, respectively, some 163.3% higher. Figures 1 and 2 show this strategy using the rule sell on the fi rst trading day in May and buy on the 6th trading day before the end of October, for the S&P500 and Russell2000 index futures for the years 1993-2015, respectively. This rule did indeed beat a buy and hold strategy by two and three times in nal wealth with lower standard deviation risk. The strategy works in most but not all years and in strategy design can be combined with other e ffects depending upon market conditions."
Are you looking for more strategies to read about? Sign up for our newsletter or visit our Blog or Screener.
Do you want to learn more about Quantpedia Premium service? Check how Quantpedia works, our mission and Premium pricing offer.
Do you want to learn more about Quantpedia Pro service? Check its description, watch videos, review reporting capabilities and visit our pricing offer.
Do you want algorithmic access to the full Quantpedia database via the API? Subscribe to Quantpedia Pro, ask for an API key, and explore the in/out-of-sample statistics, source academic papers, and code snippets — ideal for quantitative research, systematic trading workflows, and AI model training.
Are you looking for historical data or backtesting platforms? Check our list of Algo Trading Discounts.
Or follow us on:
Facebook Group, Facebook Page, Telegram, Twitter, Linkedin, Medium or Youtube
Share onLinkedInTwitterFacebookRefer to a friend


