The Seasonality of Bitcoin
Seasonality effects, one of the most fascinating phenomena in the world of finance, have captured the attention of investors and researchers worldwide. Since these anomalies are often driven by factors other than general market trends, they usually don’t correlate strongly with market movements, which can help reduce the portfolio’s overall risk. Following the theme of our previous article Are There Seasonal Intraday or Overnight Anomalies in Bitcoin?, we decided to extend the data and conduct a more in-depth analysis of our earlier findings. This article explores potential seasonal patterns related to Bitcoin, focusing on whether these patterns are influenced by factors such as current market trends or the level of volatility in the market.
If you are interested in more cryptocurrency research articles, then you are invited to visit our related page, or you can subscribe to Quantpedia Premium or Pro service, which also covers this asset class.
Recapitulation of Previous Findings
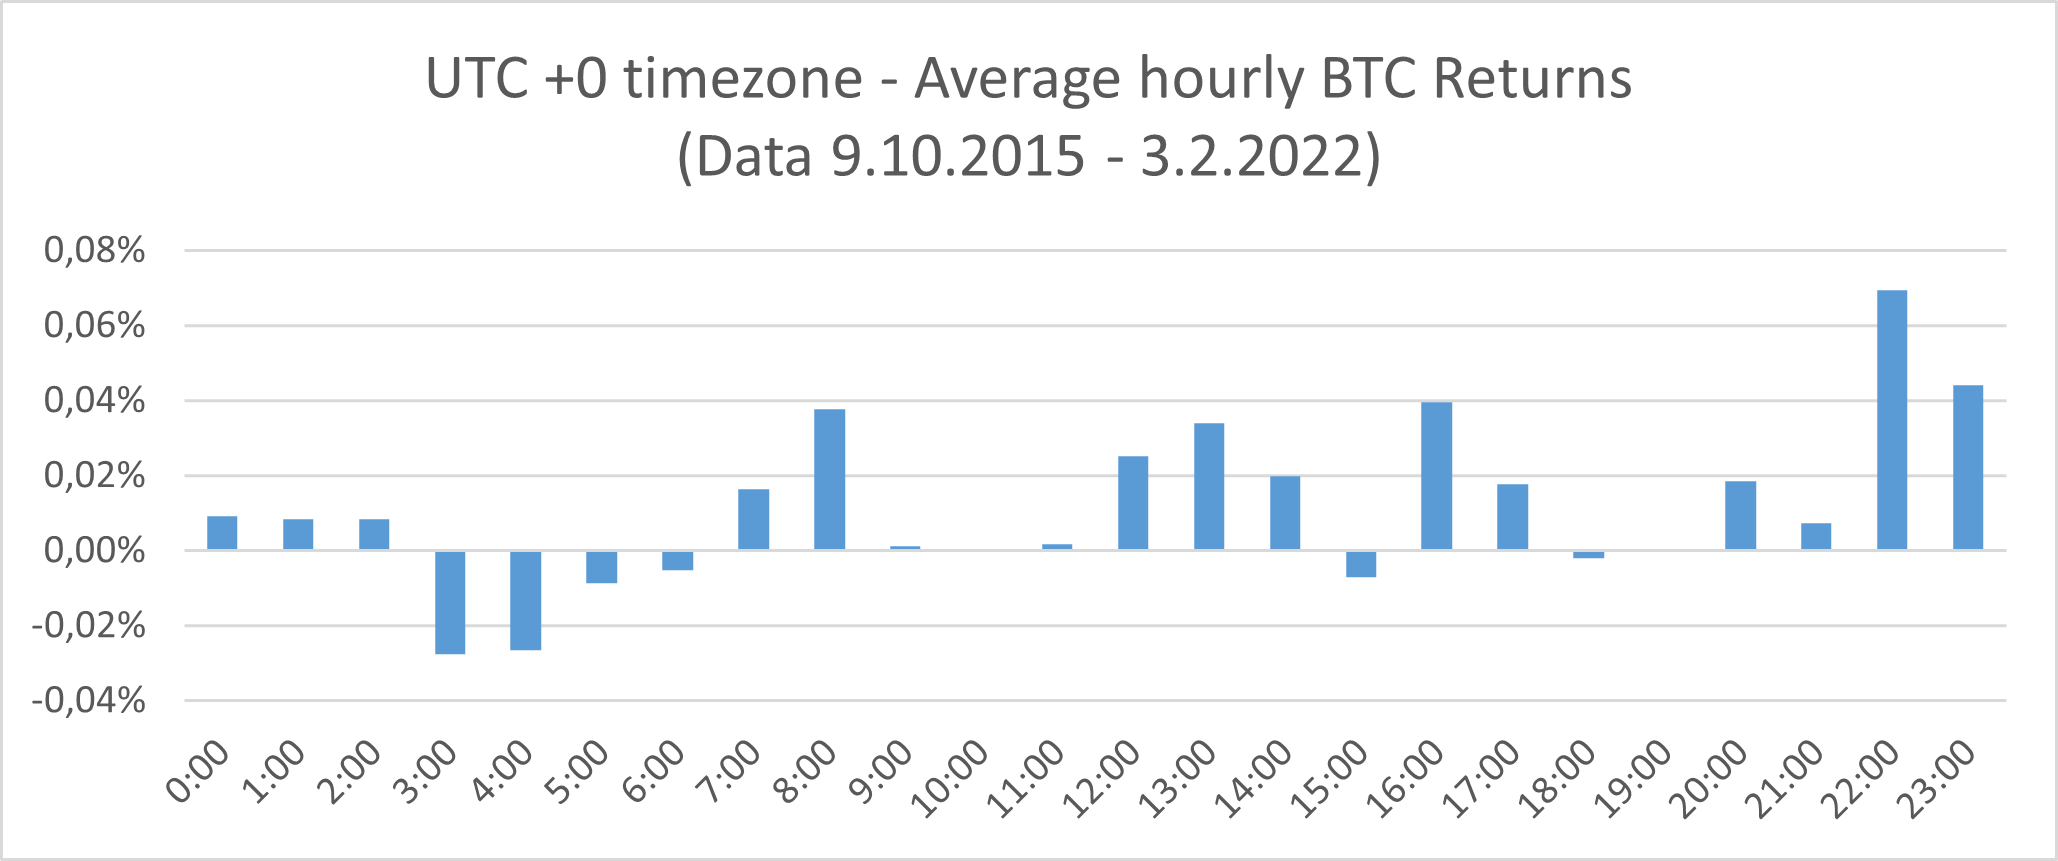
Our previous research Are There Seasonal Intraday or Overnight Anomalies in Bitcoin? examined possible seasonality effects in BTC using the hourly data from the Gemini exchange during 9.10.2015 – 3.2.2022. All of our calculations were for UTC +0 timezone. To calculate the performance between 21:00 and 22:00 (return at 22:00), we applied the basic formula:

finding, that the hourly distribution of the daily returns is not uniform. Furthermore, there are several hours when the BTC returns are above the average. Specifically, the returns for 22:00 and 23:00 seem to be the most economically significant. On the other hand, the sample’s returns for 3:00 and 4:00 seem to be the worst.
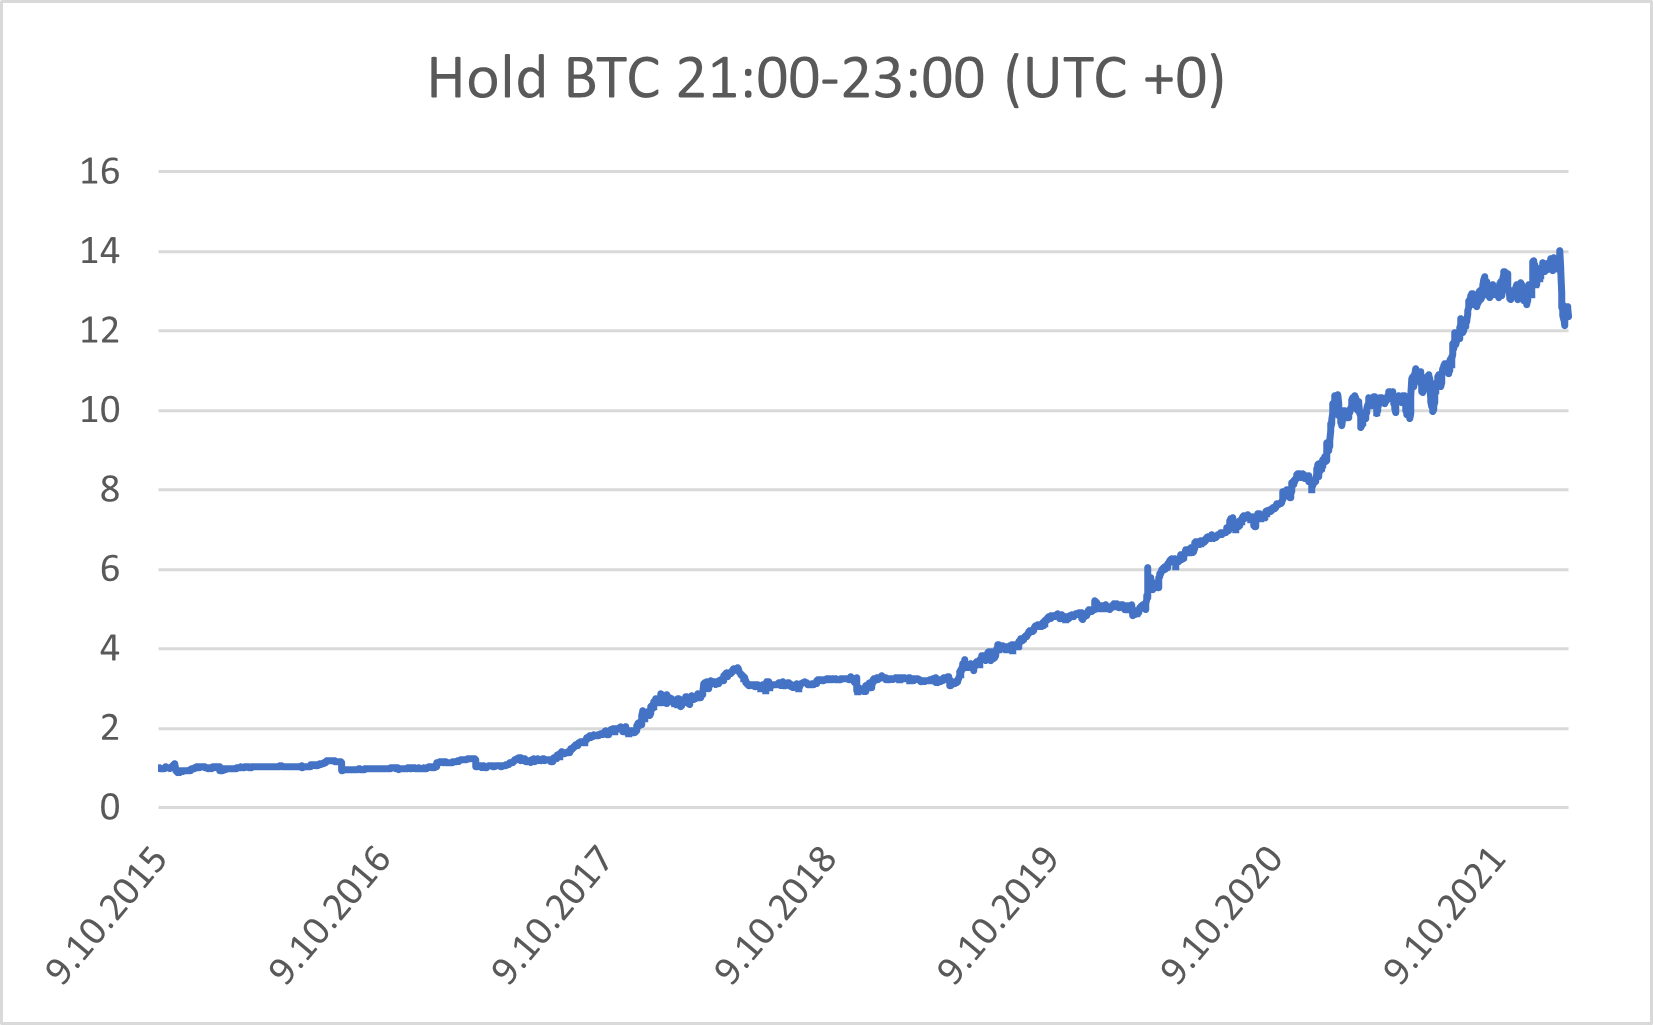
Based on the previous results, we proposed a simple seasonality strategy with a simple rule: buy Bitcoin at 21:00 (UTC +0) and sell it at 23:00 (UTC +0).
The following article is divided into three distinct sections, each examining the influence of different aspects on seasonal patterns in the cryptocurrency market:
- Seasonal Patterns and Weekdays: In the first section, we will explore the relationship between Bitcoin’s seasonal patterns and specific weekdays, uncovering whether particular days of the week exhibit distinct returns.
- Market Trends – Uptrend vs. Downtrend: The second section will focus on how market trends influence Bitcoin’s seasonal patterns. We will explore whether these patterns align differently during periods of upward momentum (Uptrends) than downward movements (Downtrends).
- Historical Volatility – Low Volatility vs. High Volatility: The third and final section of the article will investigate the relationship between seasonal patterns and historical volatility in the cryptocurrency market.
Main Analysis
In the first part, applying the same methodology mentioned above, we replicated our findings using the Gemini exchange data for an extended period of 9.10.2015-30.6.2023. The first article was published in February 2022, so we have more data to work with and we can check, how the basic strategy works during the extended sample. Again, with all of our calculations for UTC +0 timezone.
The data with an additional year’s worth of information confirmed our previous assumptions. There are two hours when the BTC returns are significantly higher – at 22:00 and at 23:00.
Interestingly, all major markets are closed during this period of the day. For UTC +0, the NYSE is open between 14:30 and 21:00, Tokyo Stock Exchange is open from 00:00 to 06:00, Hong Kong from 01:30 to 08:00, same as India, which is open between 2:30 and 10:00, and Australia, which is open from 23:00 to 05:00. Both London and continental Europe are closed during these hours since it is night there. Therefore, the best time to trade (and hold) BTC is when every other major exchange is closed.

Our new findings confirmed the abovementioned strategy with a simple rule: buy Bitcoin at 21:00 (UTC +0) and sell it at 23:00 (UTC +0).
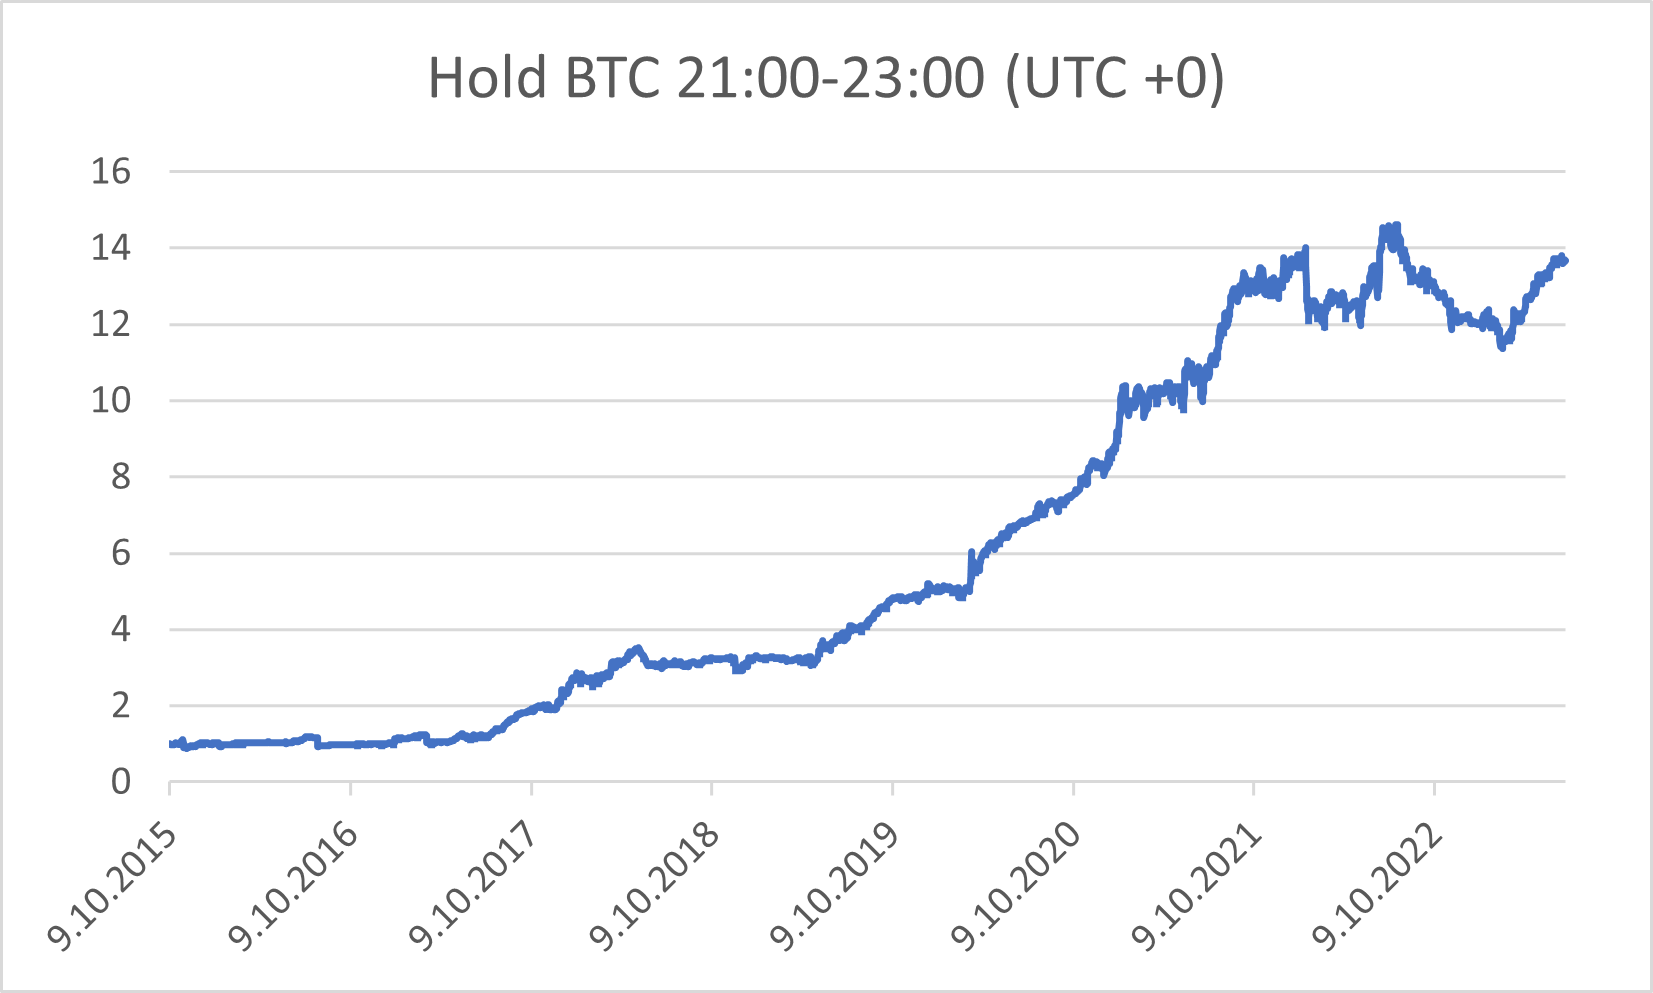
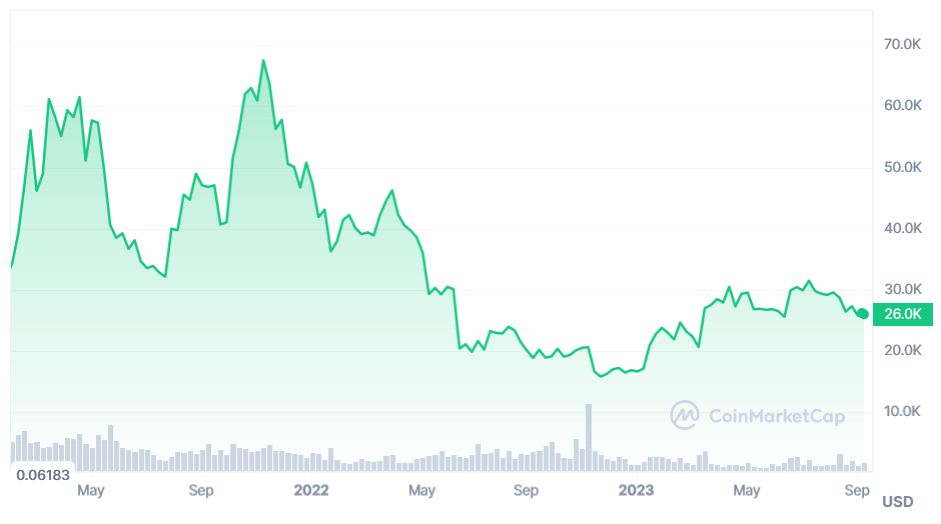
The strategy had a rough period in 2022 and 2023 and experienced a drawdown. But the strategy’s maximal drawdown over the last period (-22,7%) is quite an improvement if we compare it with the maximal drawdown of the underlying Bitcoin market (over -70%).
The seasonality strategy is close to the all-time high and has an annualized rate return of 40.64%., which results in a Calmar ratio of 1.79, highlighting its risk-adjusted performance.
Seasonal Patterns and Weekdays
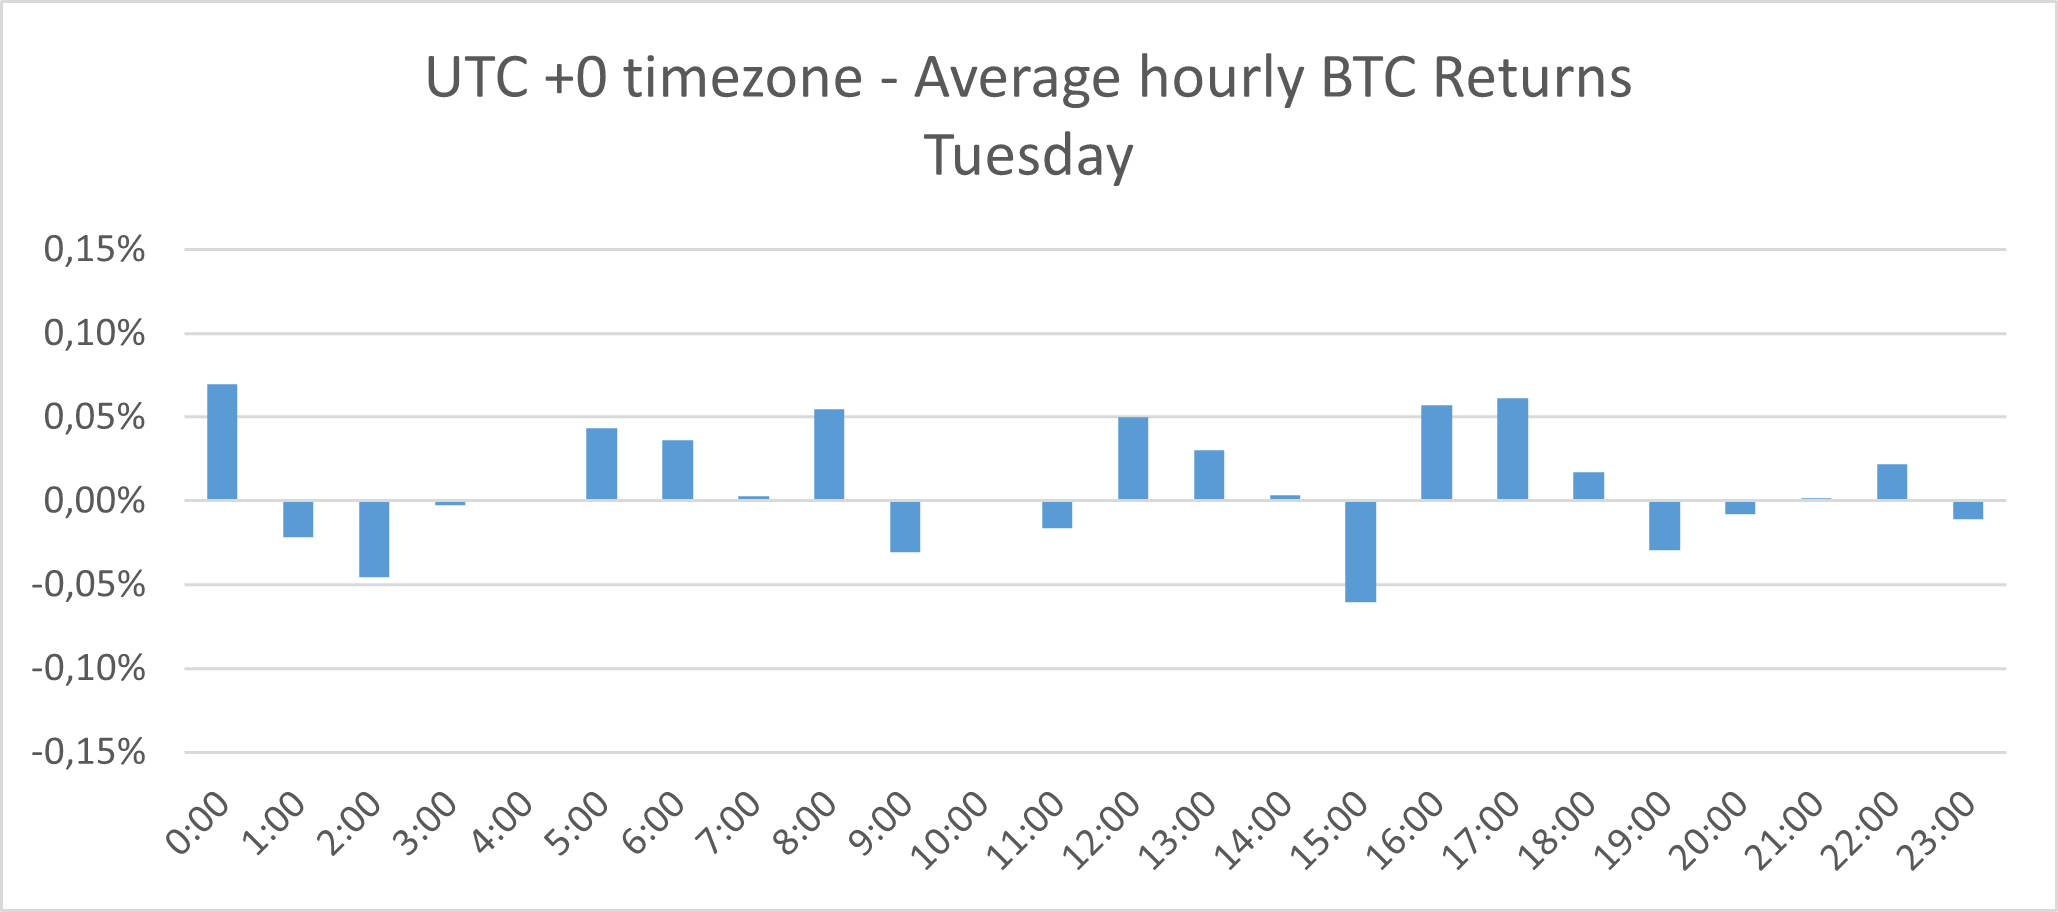
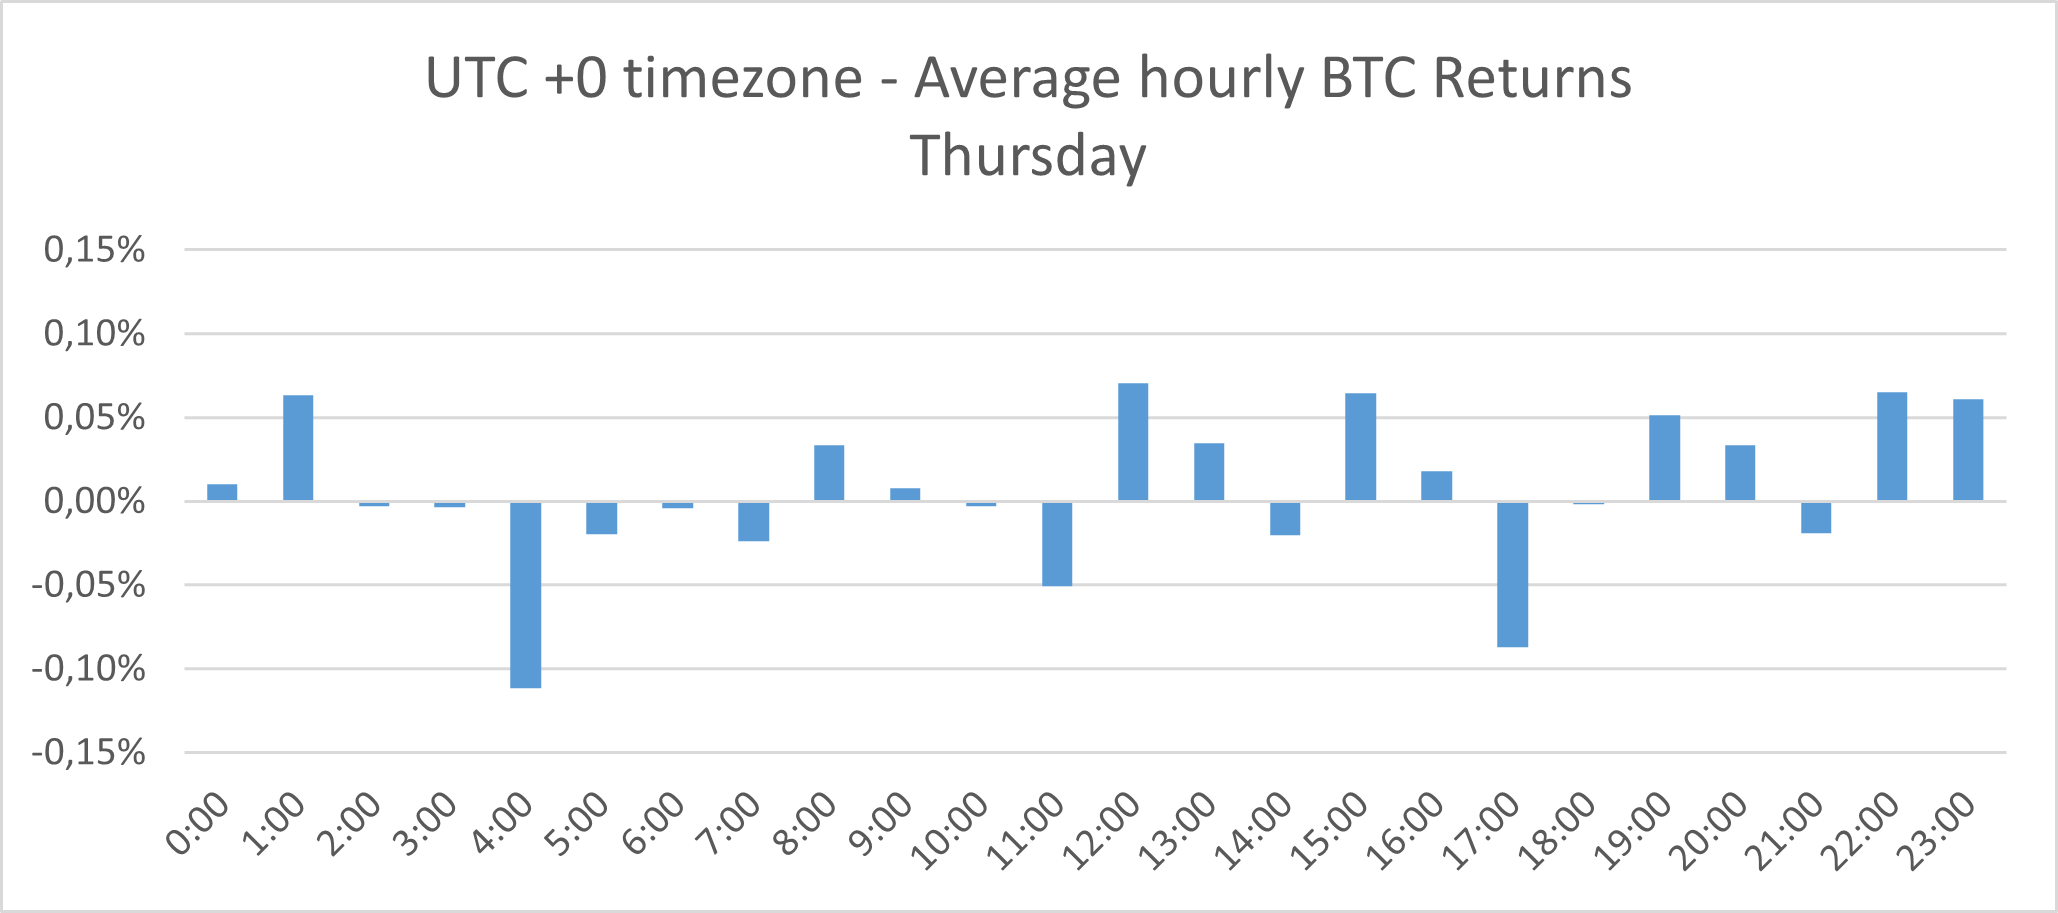
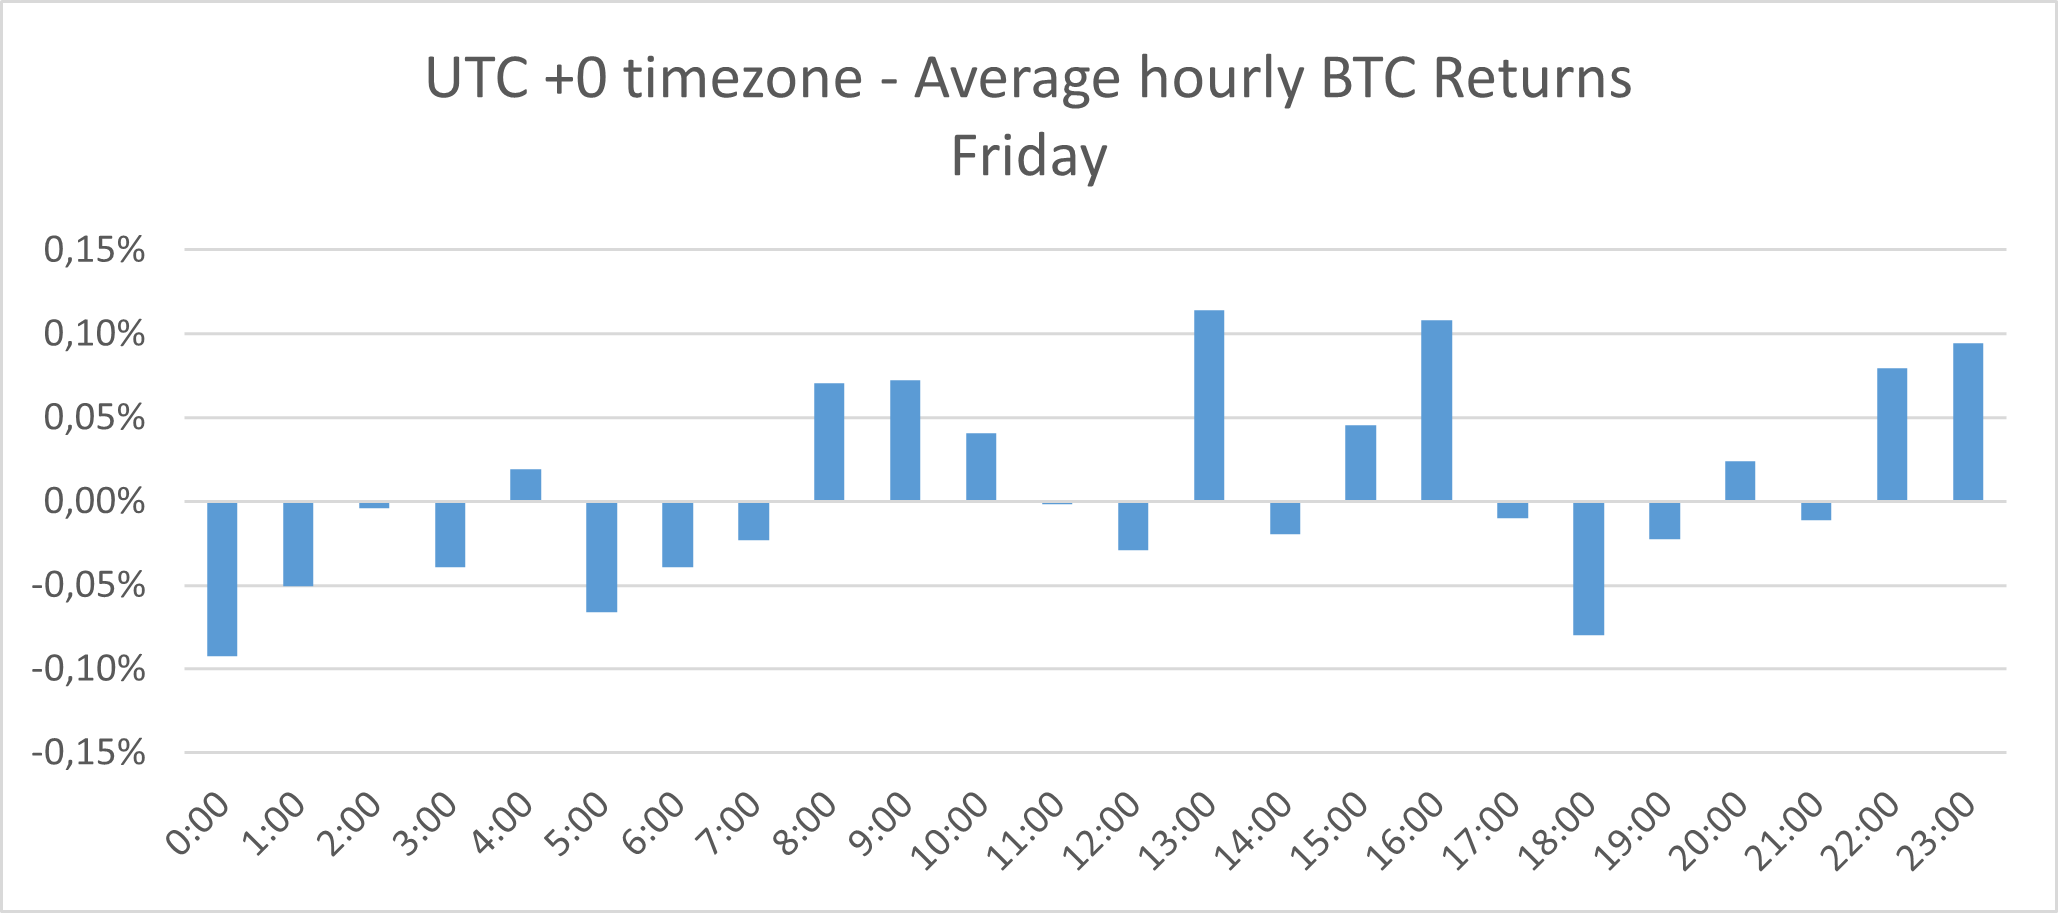
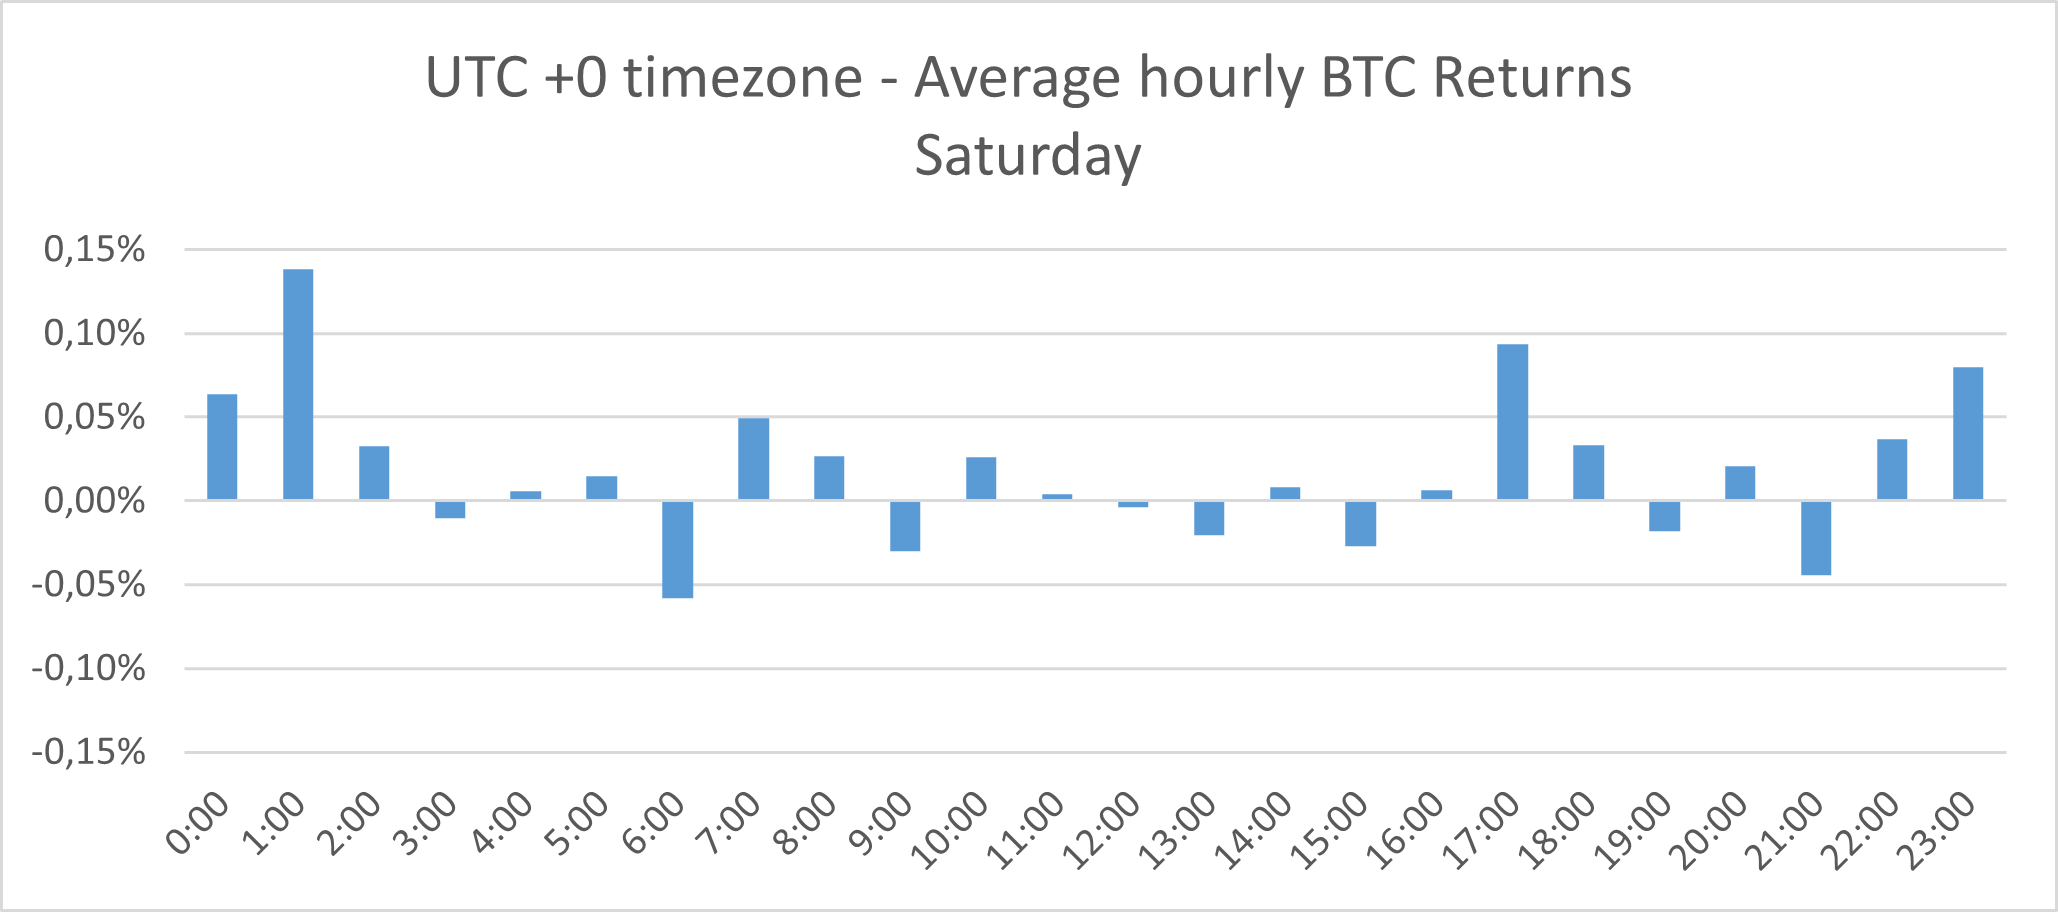
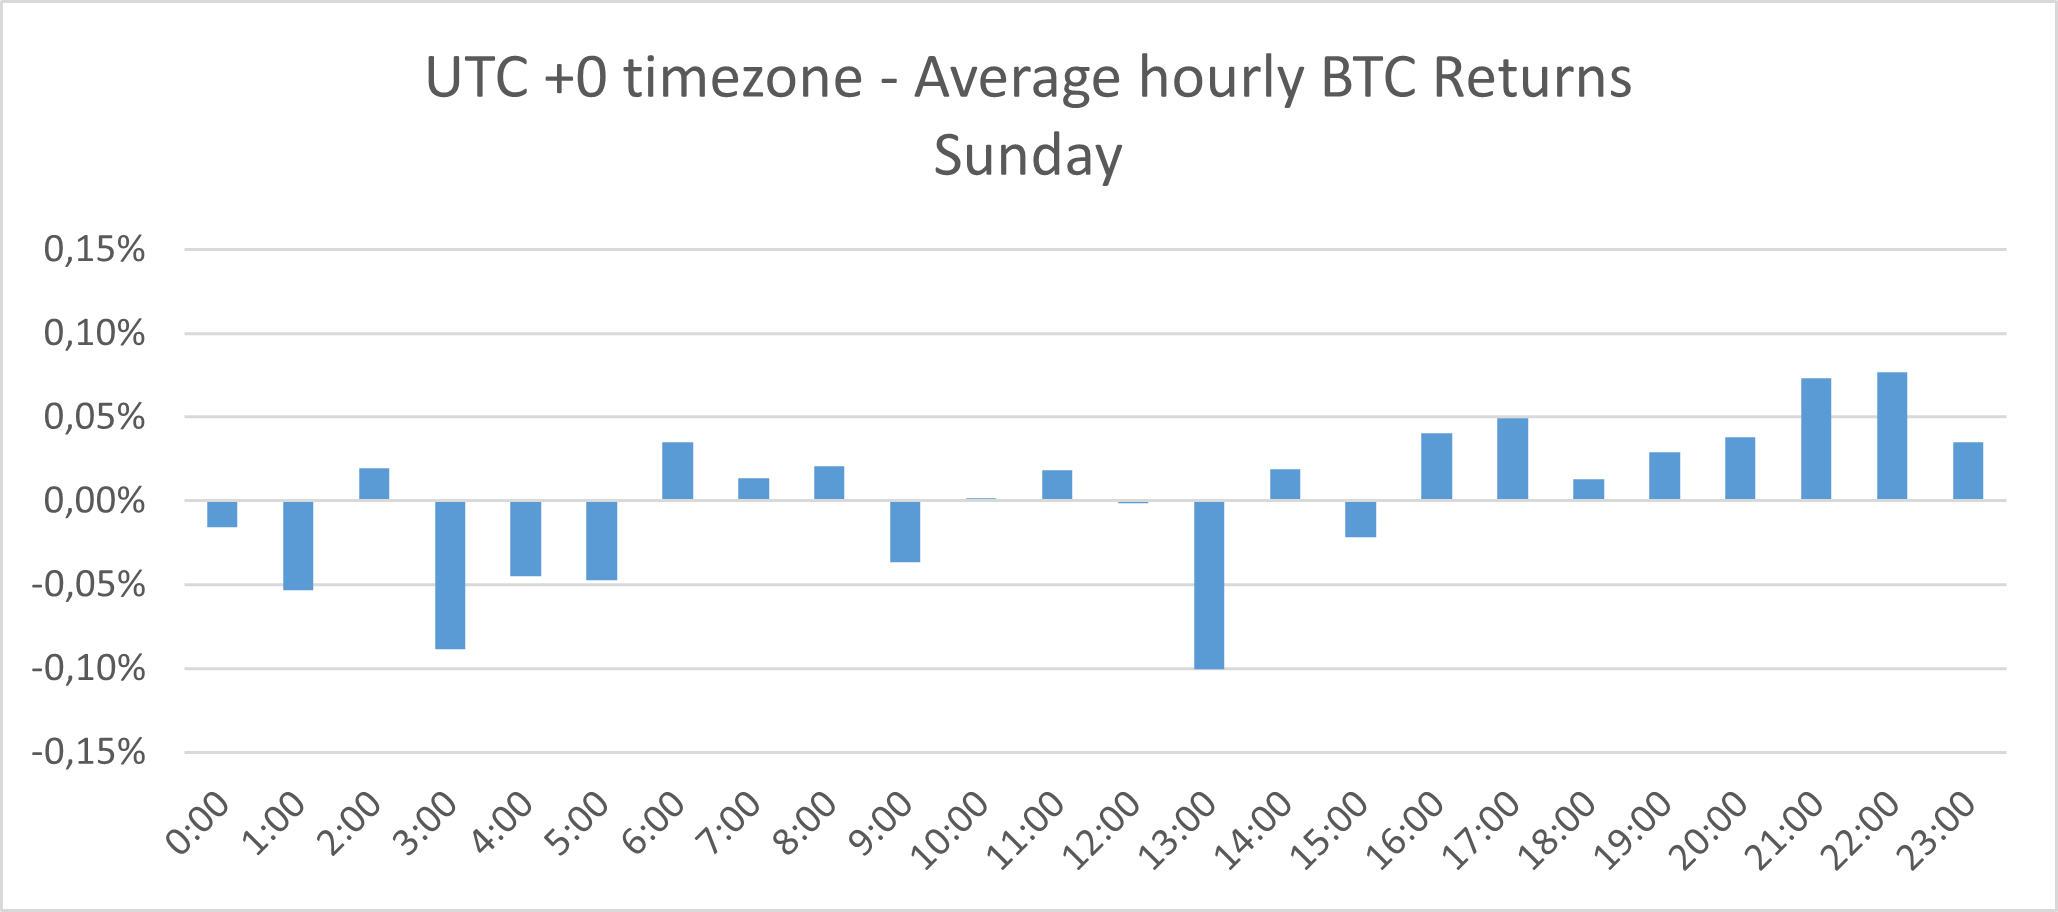
In the second part of our research, we explored the existence of significant hours across various weekdays. We divided the returns into seven days of the week, seeking out intriguing patterns and insights.
The analysis of the following seven images indicates that Friday is the top day for utilizing our simple strategy – with the greatest returns at 22:00 and 23:00. Thursday is the second-best day for trading during these hours, followed by Saturday and Sunday.


Market Trends – Uptrend vs. Downtrend
In the third phase of our analysis, we explore how specific hours’ significance relates to the current market trend, whether it’s an uptrend or a downtrend. First, we computed the 10, 20, 50, and 200-day moving averages from the daily bars (centered on the 0.00 UTC time). The uptrend market is if the Bitcoin price is higher than its moving average. The downtrend market is if the price of the Bitcoin is lower than its moving average.
Following this calculation, we defined Downtrend/Uptrend days as the next 24-hour periods following the 0.00 UTC check of the Bitcoin trend. So if the check of the trend at 0.00 UTC time shows that we are in an uptrend, then the subsequent 24-hour period is an Uptrend day; otherwise, it is a Downtrend day.
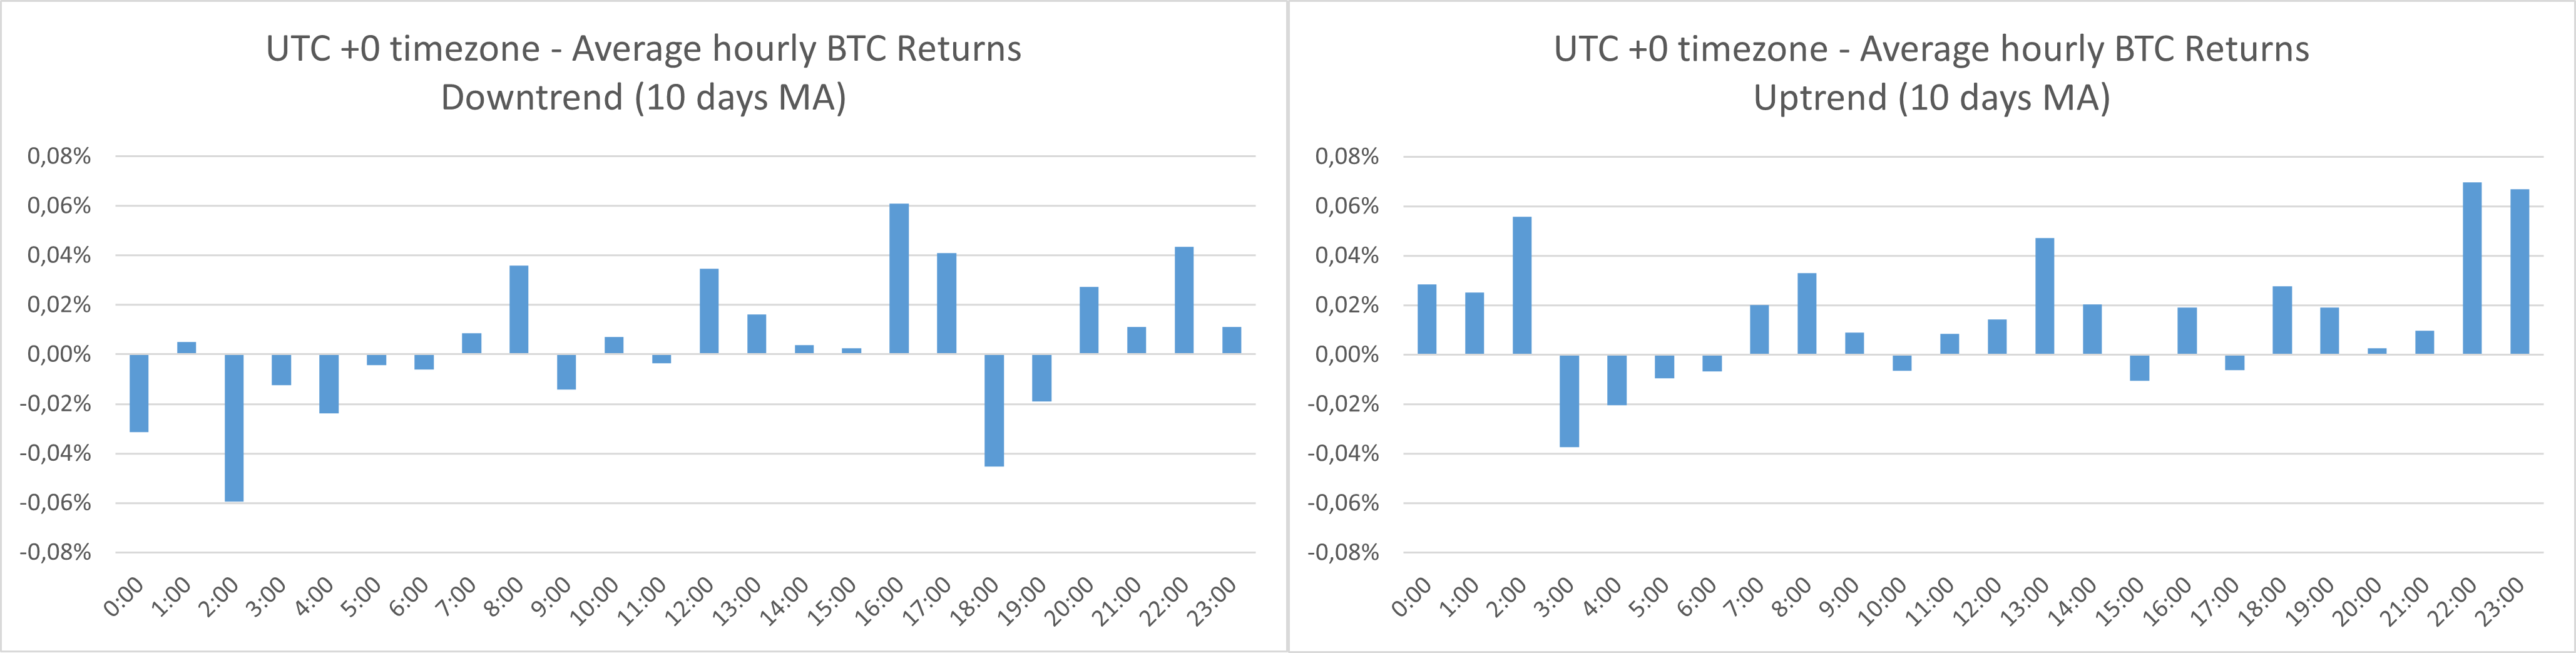
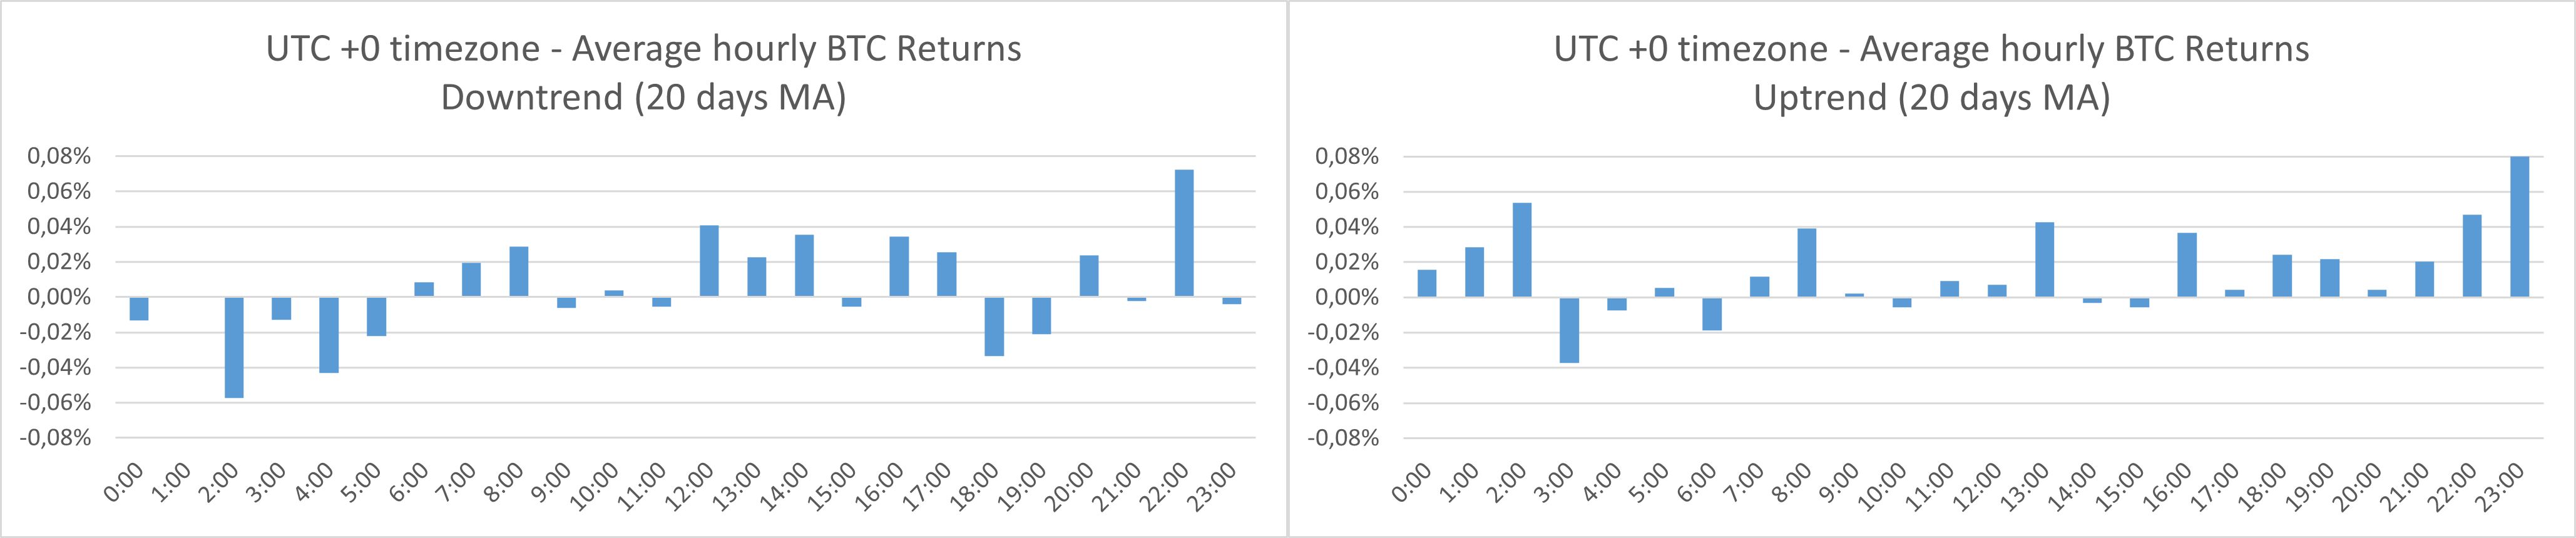
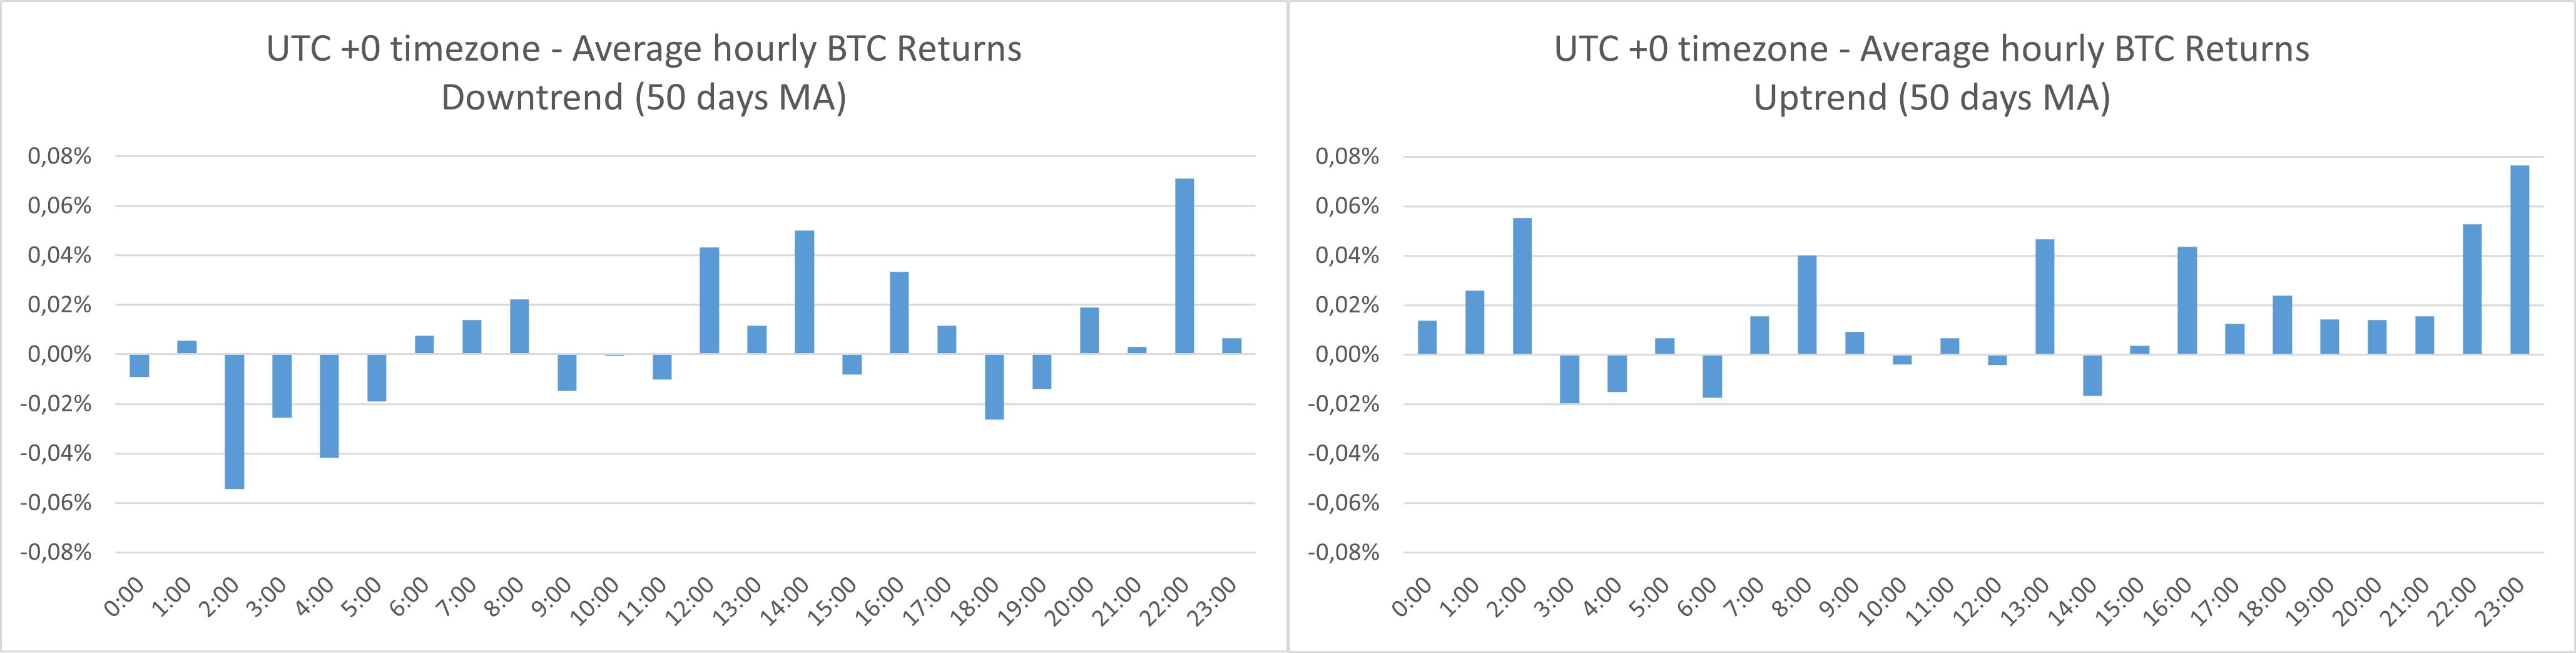
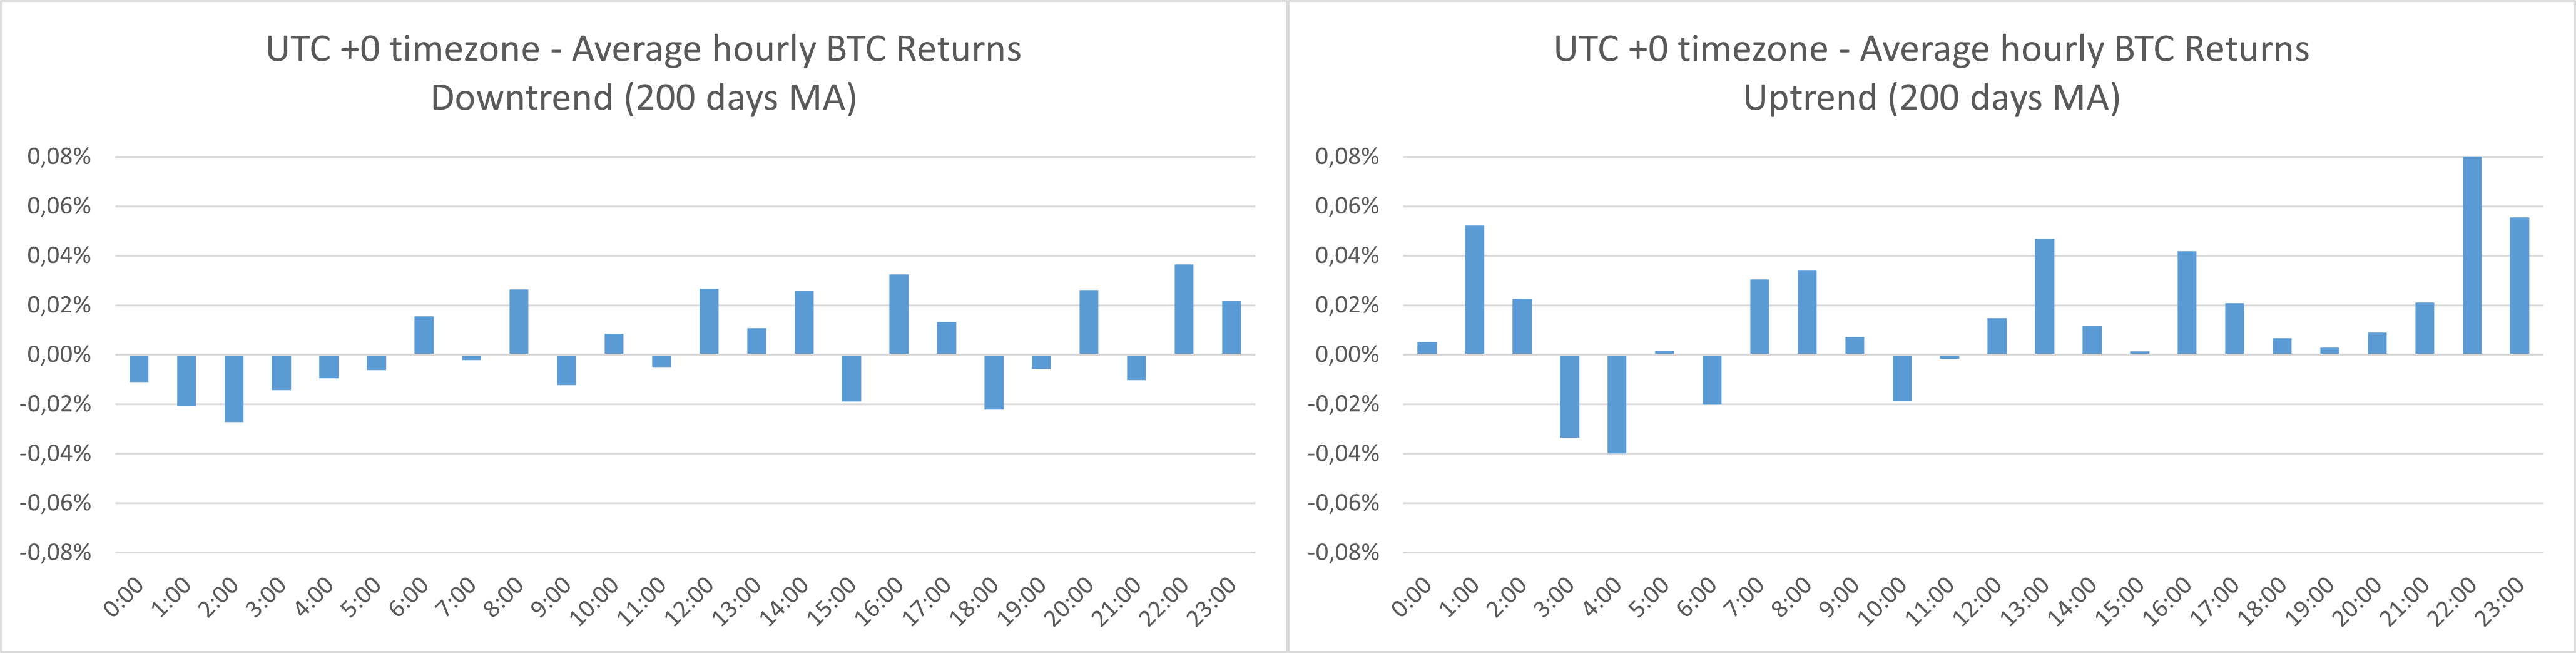
Based on the abovementioned graphs, the Uptrend days seem more prone to seasonal patterns in the researched time period (21.00 UTC – 23.00 UTC). We reexamined our basic trading strategy, this time focusing only on days characterized by an Uptrend.

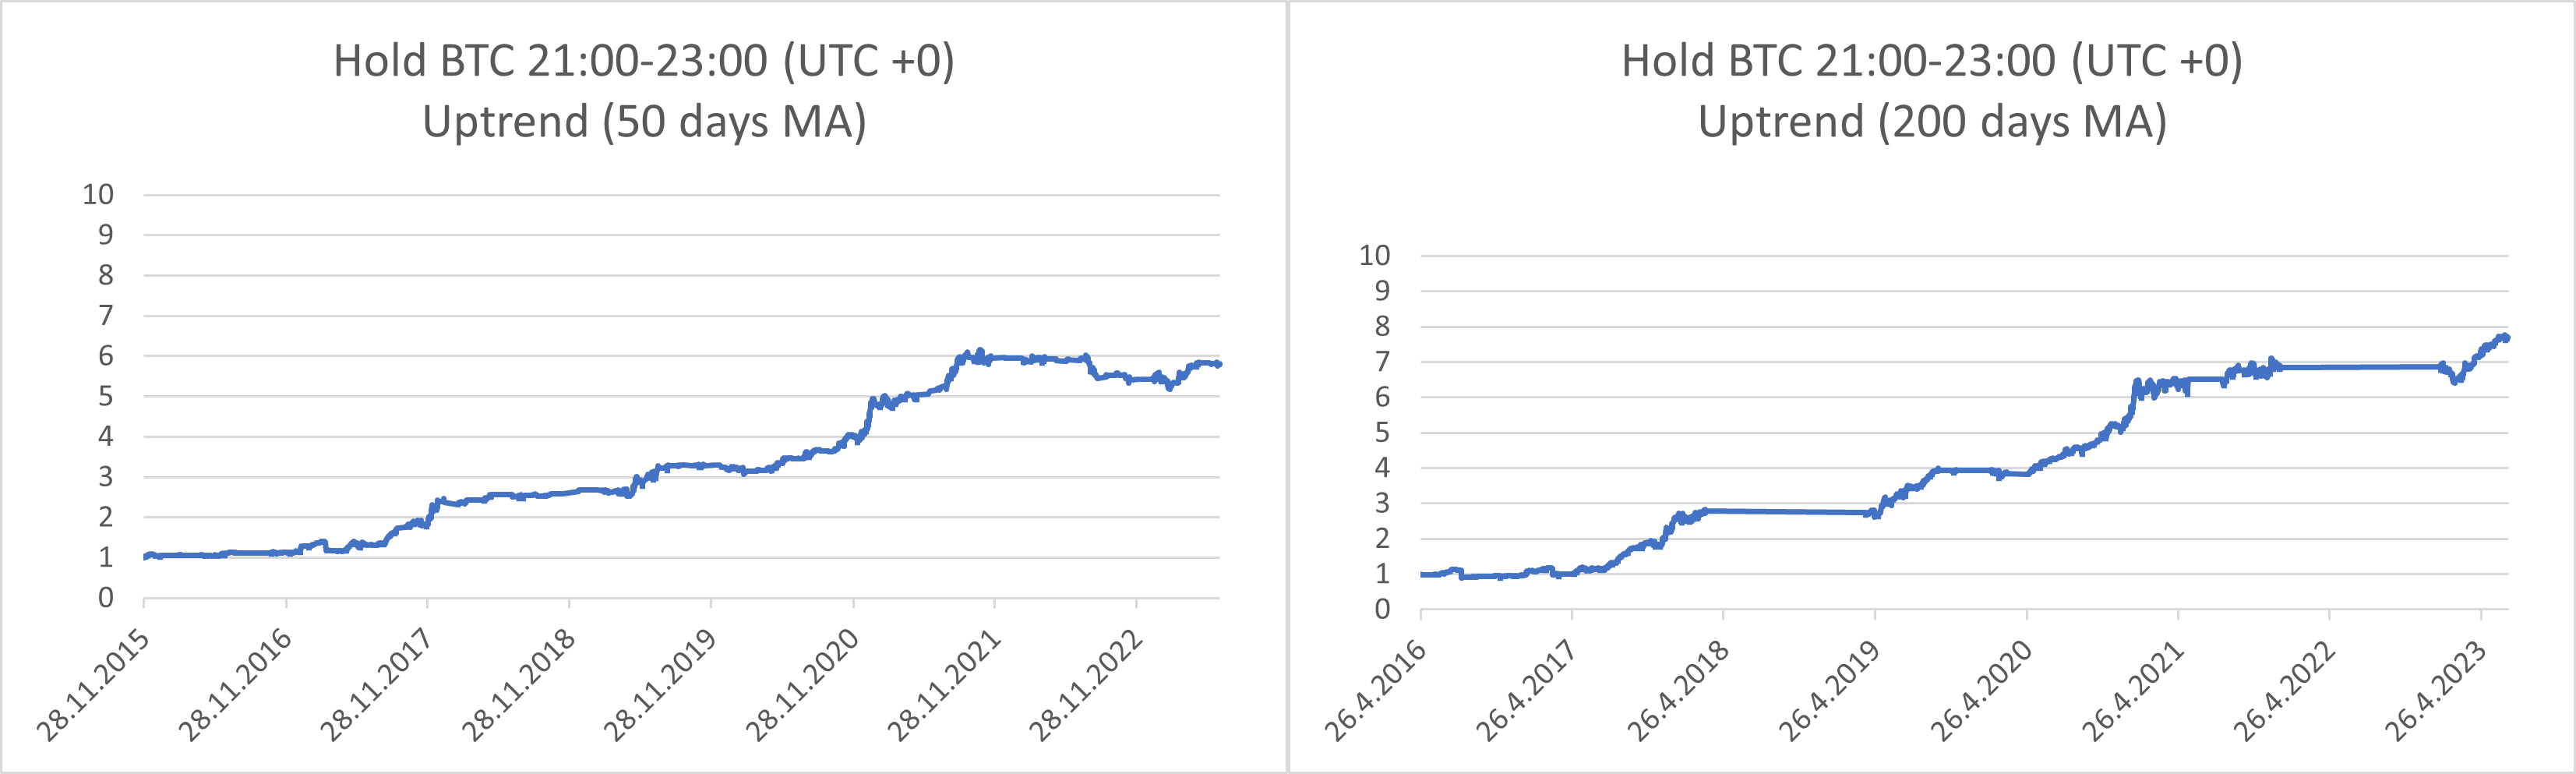
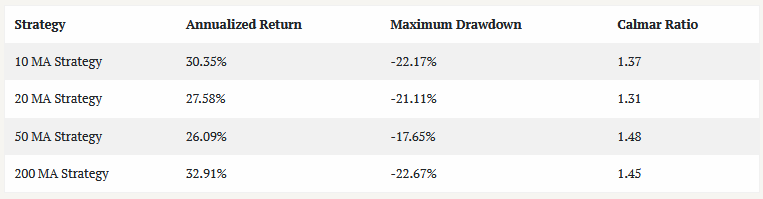
Here’s a summary of the characteristics observed in the strategies with different moving averages:
Historical Volatility – Low Volatility vs. High Volatility
The final phase of our research examined the relationship between significant trading hours and historical volatility levels, whether high or low. Firstly, we calculated the 30-day historical volatility (using hourly performance bars). Subsequently, we determined the median historical volatility over one year (365 days). This moving median value served as the benchmark for categorizing periods as ‘High Volatility’ or ‘Low Volatility’. The procedure for dividing periods into the high/low volatile is the same as in the case of uptrend/downtrend – we perform the calculation at 0.00 UTC time, and the subsequent 24-hour period is defined as a high or low volatility period, based on whether the 30-day volatility is lower or higher than the median.
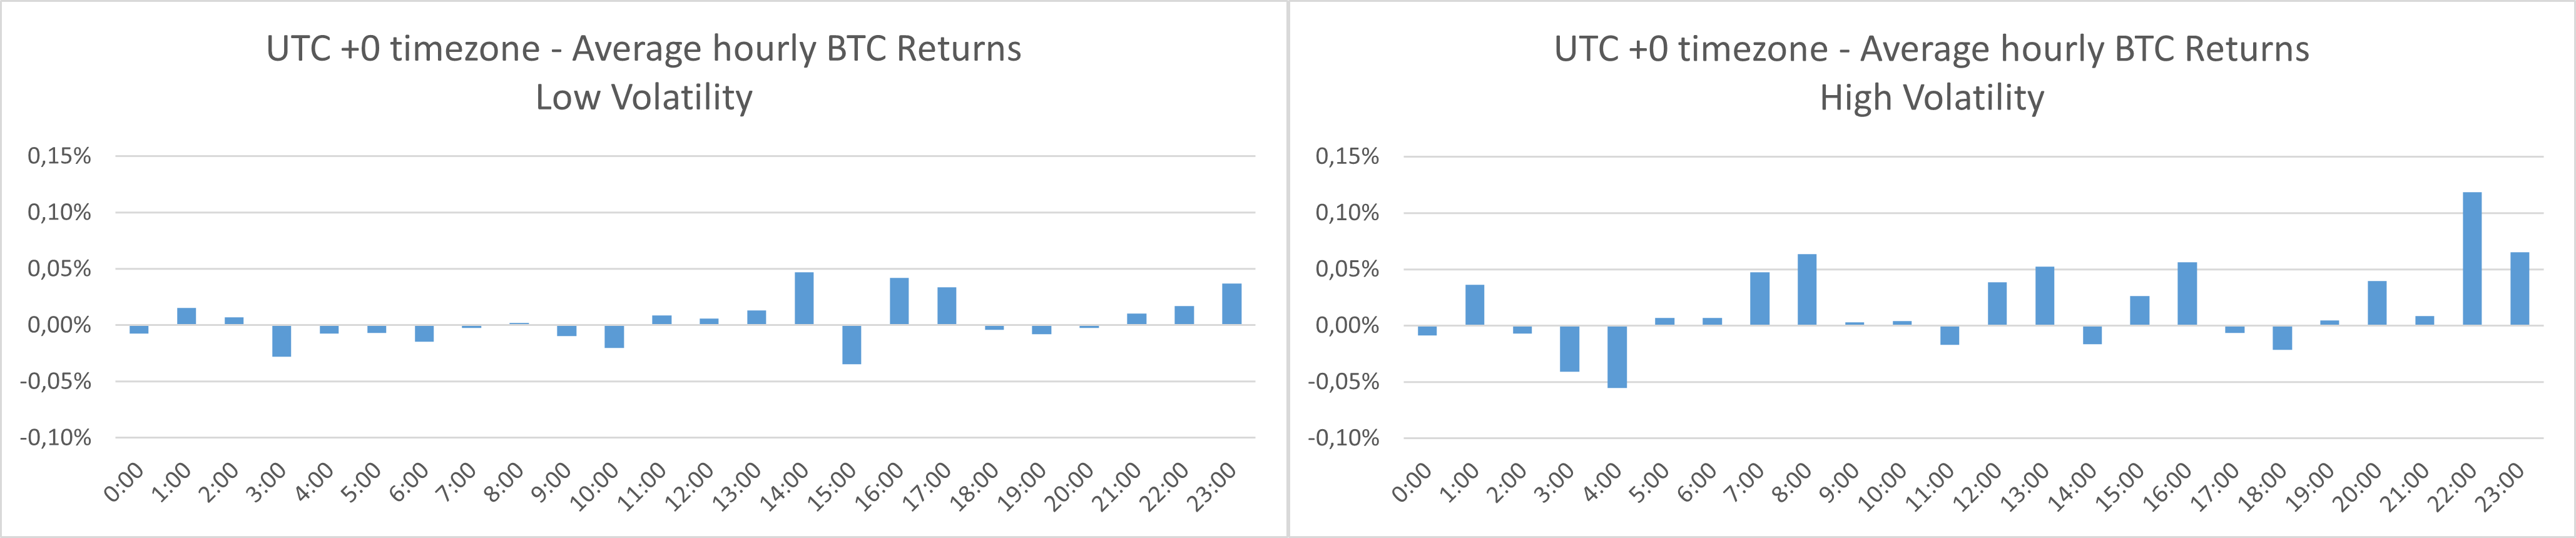
As we see on the graph above, it becomes clear that days characterized by higher volatility levels correspond to notably higher returns at 22:00 and 23:00. This time, we have examined the simple trading strategy only during High Volatility days.
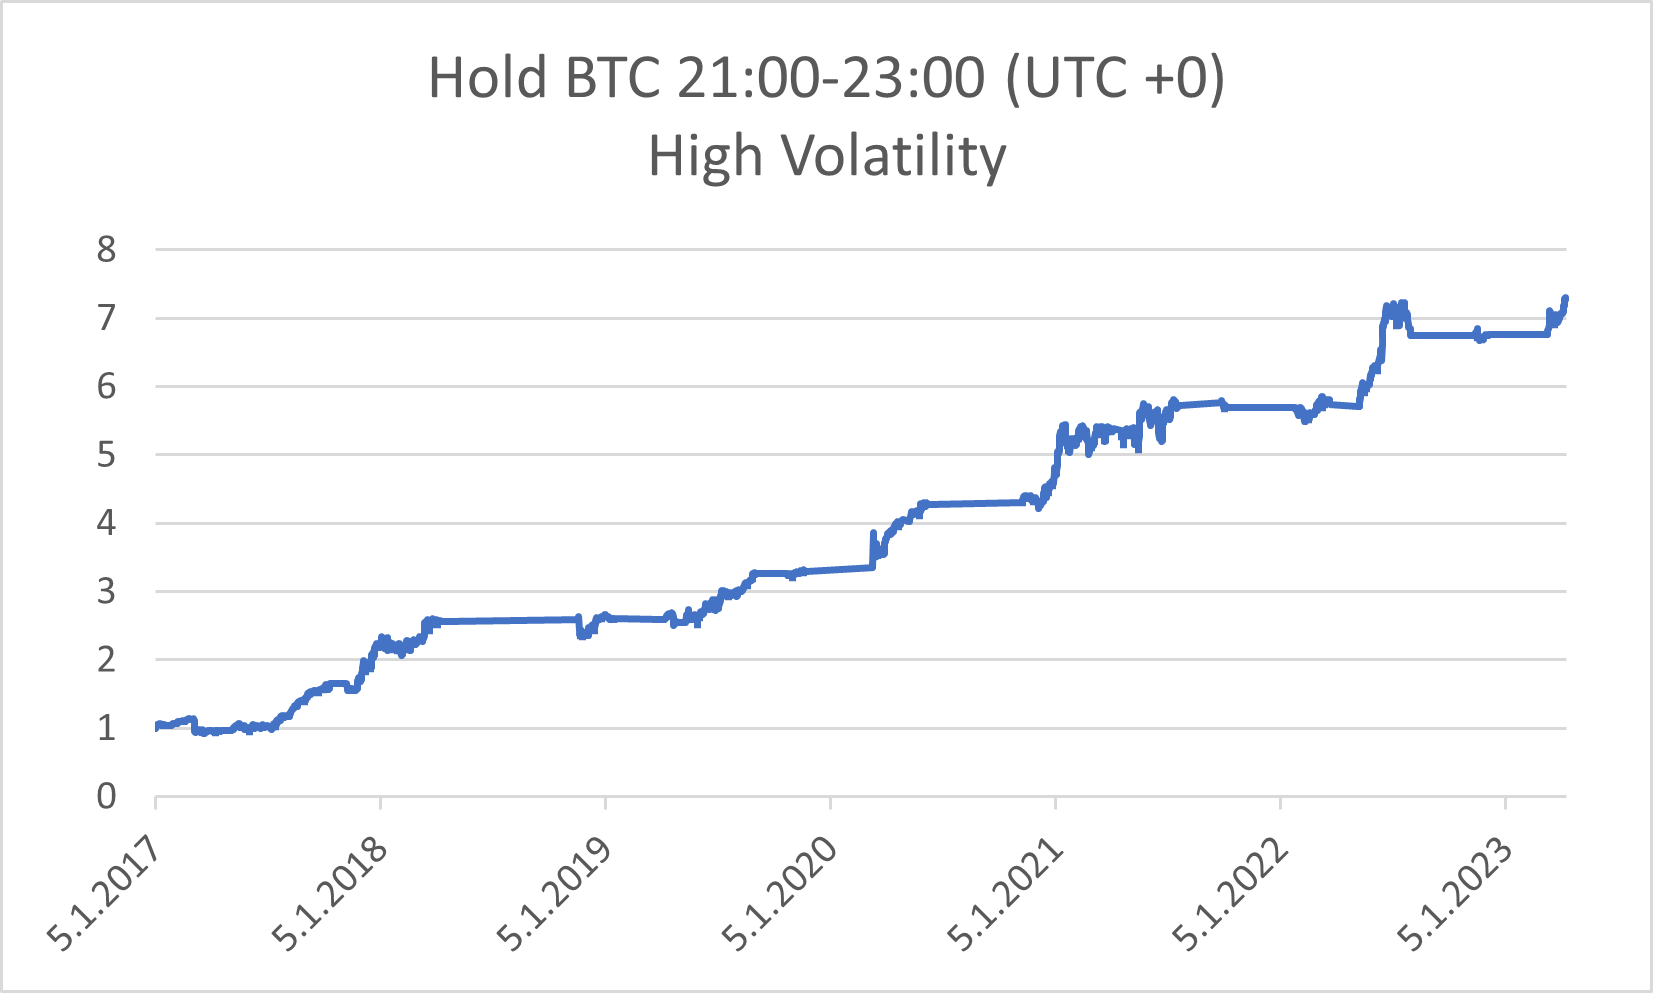
This strategy achieved an annualized return of 37.26%. The maximum drawdown is -18.87%. The Calmar ratio, a measure of its risk-adjusted performance, is 1.97 – the highest of all the strategies presented in this article.
Short Conclusion
Firstly, we have replicated our previous findings from the article Are There Seasonal Intraday or Overnight Anomalies in Bitcoin?, using data for an extended period of time. We have examined the hourly patterns in Bitcoin’s return, finding that the most sizeable and significant returns relate to the time between 21:00 and 23:00. We also show that based on this finding, it is possible to construct a simple seasonality-based strategy that can deliver annualized return of 40,64% and Calmar Ratio of 1.79.
Secondly, we have analyzed the existence of significant hours across individual weekdays, finding that Friday is the best day to use our simple strategy between 21:00 and 23:00. Thursday comes next, followed by Saturday and Sunday.
In our analysis’s third part, we calculated the 10, 20, 50, and 200-day moving averages. Following this calculation, we identified Uptrend and Downtrend days, observing that returns at 22:00 and 23:00 tend to be higher during periods of uptrends.
Finally, we have examined the relationship between significant trading hours and historical volatility levels, categorizing periods as ‘High Volatility’ or ‘Low Volatility’. According to our findings, the simple seasonality-based strategy (telling us to hold Bitcoin only two hours a day during High Volatility periods) can deliver annualized return of 37.26%, while the Calmar ratio is 1.96.
Are you looking for more strategies to read about? Sign up for our newsletter or visit our Blog or Screener.
Do you want to learn more about Quantpedia Premium service? Check how Quantpedia works, our mission and Premium pricing offer.
Do you want to learn more about Quantpedia Pro service? Check its description, watch videos, review reporting capabilities and visit our pricing offer.
Do you want algorithmic access to the full Quantpedia database via the API? Subscribe to Quantpedia Pro, ask for an API key, and explore the in/out-of-sample statistics, source academic papers, and code snippets — ideal for quantitative research, systematic trading workflows, and AI model training.
Are you looking for historical data or backtesting platforms? Check our list of Algo Trading Discounts.
Or follow us on:
Facebook Group, Facebook Page, Twitter, Linkedin, Medium or Youtube
Share onLinkedInTwitterFacebookRefer to a friend


