Three Simple Tactical FX Hedging Strategies
Introduction
There are many ways one can lose money when investing, and exchange rates are one of the potential risk factors. Luckily, there are several ways to minimize this type of loss in your portfolio. Systematic tactical FX hedging that uses currency factor strategies (for example currency carry, currency momentum and currency value) is a way of protecting an existing or anticipated position from an unwanted move in an exchange rate. It does not eliminate the risk of loss completely but helps to manage currency exposure better.
To Hedge or Not to Hedge FX?
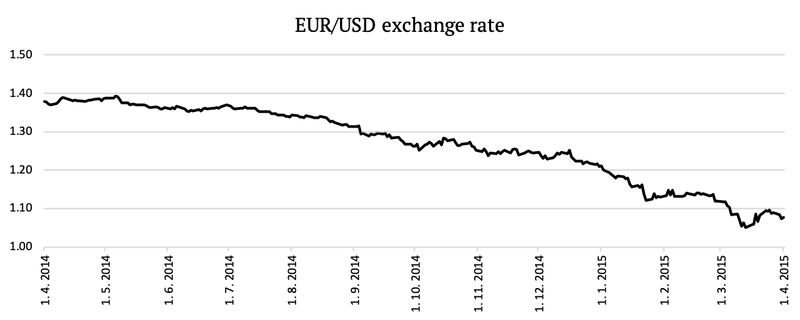
You may ask whether hedging is worth it. Unfortunately, there is no correct answer to this question. In the long run, the exchange rates oscillate. However, historically we know of several time periods when hedging would have been very useful. For example, from April 2014 till April 2015 EUR/USD exchange rate dropped from almost 1.40 to not even 1.10. This means that it would be hugely advantageous for US investors to hedge their EUR currency exposures at that time. The figure below shows the change of the EUR/USD exchange rate during the abovementioned period.
| Algo Trading Promo Codes are available exclusively for Quantpedia’s readers. |
Overall, everyone has to answer the question for themselves. Someone might prefer to hedge because of their risk aversion. Another person might not mind the currency risk. It all depends on a variety of factors, including the costs, investment needs, risk aversion, and so on. Looking only at return, in the long run, it is not clear whether hedging pays off or not.
How much does the FX hedging cost?
When investors make the decision whether to hedge or not, they should take into consideration several factors. The main factors are:
- The cost of currency hedging.
- Expectations for foreign exchange (FX) movements.
- The underlying portfolio’s characteristics.
Additionally, the cost of currency hedging changes dynamically. The main factors driving these changes are short-term rate differentials and cross-currency basis (two main ones), and additionally also transaction costs, and the shape of the yield curve.
The short-term rate differential or the interest-rate differential between two currencies directly influences the cost of hedging currency exposure. As the spread between two currencies (foreign currency minus local currency) widens, the hedging costs increase. On the other hand, as the spread shrinks, the hedging costs decrease. Costs can even turn into positive carry, i.e. you may effectively “get paid” for hedging. For example, as of August 2021, a US-based investor incurs positive carry for hedging their EUR exposure, due to lower short-term rates in the Eurozone.
A cross-currency basis swap is an agreement where two parties borrow from (/lend to) each other the same amount of money in two different currencies for a predefined time. The basis refers to a premium or discount added to the swap, which will fluctuate with the supply/ demand of the various currency. For example, as of August 2021, a EUR/USD basis is negative, which means there’s a higher demand for dollars than euros. This provides another tailwind in form of a positive carry for a US-based investor hedging their EUR exposure.
The transaction costs vary widely based on the type of hedge and frequency of its implementation. For example, rolling over or rebalancing one’s hedging contracts frequently provides a better hedge, but this approach also acquires higher trading costs. Lastly, the shape of the yield curve determines whether an investor is more or less prone to take advantage of the rate differential. A flatter curve means almost no difference between the short-term yield differential and the long-term one.
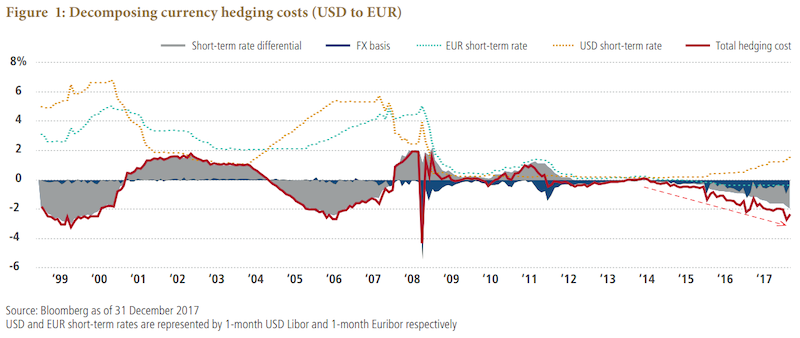
The following chart shows the 2 main hedging costs drivers: the short-term rate differential and FX basis. It also depicts EUR and USD short-term rate and the total hedging costs.
How to hedge FX?
There are several instruments one can use to hedge the currency exposure of their portfolio. The two most commonly used ways to hedge currencies, however, are forwards and/or futures. Historically, forwards have been the most widely used. However, in terms of their popularity, they are slowly being replaced by the futures in recent years. Contrary to forwards, futures are traded on the stock exchange, which makes them more accessible and transparent. Both forwards and futures have two types of costs: implicit and explicit. The explicit costs of both are equal to the broker costs.
When it comes to forwards, the implicit costs include:
- Interest rate differential
- Cross-currency basis
- Forward rate spreads (may or may not be separated from broker costs)
The implicit costs of futures include:
- Roll yield (which is equal to the interest rate differential + basis + market mispricing)
- Bid-ask spreads and slippage (since we trade on the exchange)
Passive FX Hedging Analysis
We decided to analyze both passive and tactical hedging from the position of a US investor buying a Eurozone ETF (iShares MSCI Eurozone ETF – EZU US). By passive hedging, we mean minimizing the currency risk for the whole time. By tactical hedging, we mean we hedge only opportunistically, in specific periods based on various conditions, which we explain in the later section.
Firstly, we compare the performance of EZU US (Eurozone ETF with EUR/USD risk), HEZU US (hedged EZU US ETF) and EZU US in € (“perfectly” hedged EZU US, from the point of view of a European investor who has no currency risk). The following chart shows the cumulative returns of all three portfolios since the launch of HEZU ETF.
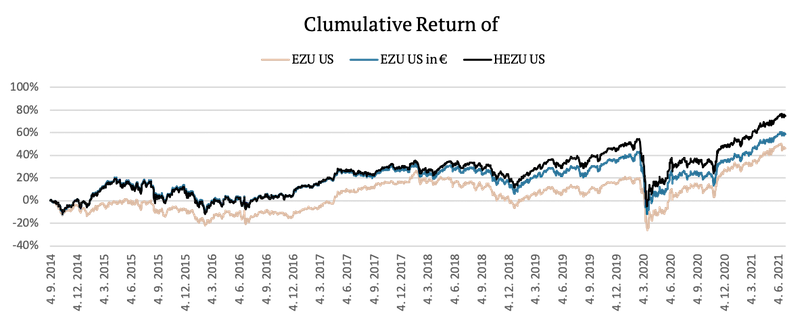
We may observe, that an unhedged version has earned the lowest returns, indicating a euro has weakened over the observation period. Secondly, we observe, that a US investor who hedged their euro currency risk earned bigger returns than local EU based investor, due to positive hedging costs’ carry. Additionally, in the table below, we can see the risk and return characteristics of the abovementioned ETFs.
|
|
6Y CAR |
6Y |
Sharpe |
Max DD |
95% DD |
CAR/ |
CAR/ |
|
EZU US |
5.72% |
20.37% |
0.28 |
-41.36% |
-21.15% |
0.14 |
0.27 |
|
EZU US in € |
7.00% |
20.55% |
0.34 |
-38.44% |
-20.00% |
0.18 |
0.35 |
|
HEZU US |
8.51% |
20.11% |
0.42 |
-38.80% |
-19.80% |
0.22 |
0.43 |
A deeper look into theoretical and practical FX hedging costs
In this section, we compare three proxies for costs of passive hedging to HEZU US – the hedged ETF and observe their differences. Proxies are the following:
- The first proxy uses EUR/USD futures, which equals the real-life implementation. We combine EZU US and a short position in EUR/USD futures.
- The second proxy is calculated by using EZU US in € + only the interest rate differential (i.e. theoretical costs just due to the differential)
- The third proxy is calculated by using EZU US in € + interest rate differential + cross-currency basis (FX basis).
The following figure shows the cumulative returns of these three portfolios compared to the HEZU US ETF.
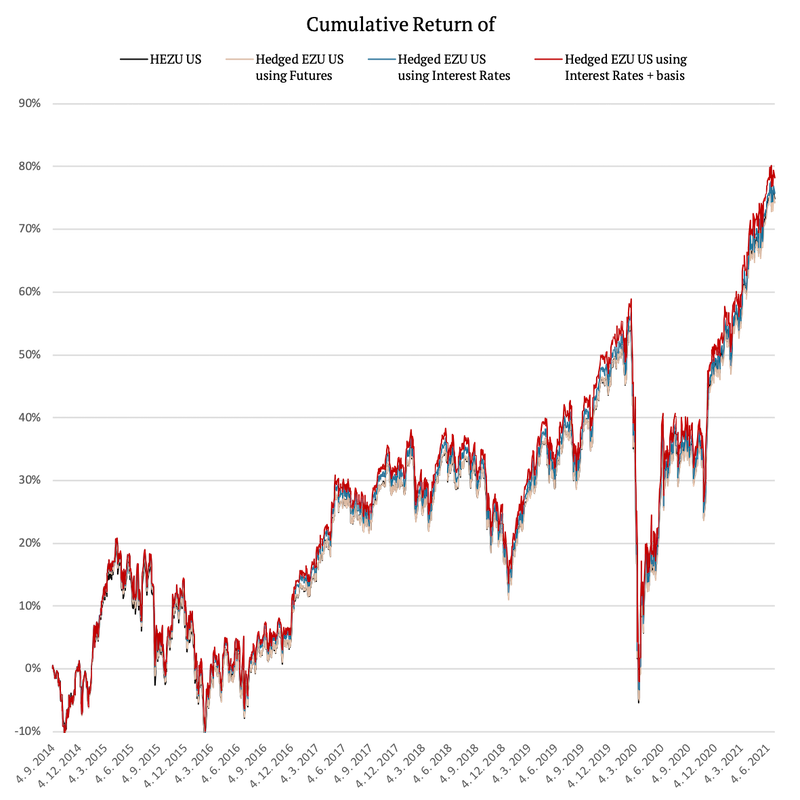
As we can see, the performances are very similar, and it is very hard to distinguish between the curves in the chart. Therefore, we calculated cumulative differences against HEZU US, which are presented in the following figure:

This figure shows whether hedged ETF (HEZU), after costs, outperformed or underperformed the theoretically hedged EZU US. Hedging costs are represented by the three above mentioned proxies: 1) futures, 2) IR differential only, 3) IR differential + FX basis.
The first interesting observation is that EZU US hedged 100% by EUR/USD futures slightly underperformed the hedged ETF HEZU, even after transaction costs. TER of HEZU US is 0.54% p.a. (as of August 2021), which is not that small and still the ETF outperformed. It seems that the forward hedging strategy of the ETF payed off more.
The second observation is more obvious – EUR/USD basis was negative most of the time, earning a US based investor extra hedging return (red curve vs. blue curve).
The third observation is that hedging by futures incurred more implicit costs (negative ones) than just the conventional interest rate differential and currency basis (light brown curve vs blue and red curves.
Finally, we present a table with the risk and return characteristics of all the above-mentioned portfolios.
|
|
CAR |
6Y |
Sharpe |
Max DD |
95% DD |
CAR/ |
CAR/ |
|
EZU US |
5.72% |
20.37% |
0.28 |
-41.36% |
-21.15% |
0.14 |
0.27 |
|
EZU US in € |
7.00% |
20.55% |
0.34 |
-38.44% |
-20.00% |
0.18 |
0.35 |
|
HEZU US |
8.51% |
20.11% |
0.42 |
-38.80% |
-19.80% |
0.22 |
0.43 |
|
Hedged EZU US |
8.47% |
20.28% |
0.42 |
-38.71% |
-20.09% |
0.22 |
0.42 |
|
“Hedged” EZU US |
8.59% |
20.55% |
0.42 |
-38.35% |
-19.59% |
0.22 |
0.44 |
|
“Hedged” EZU US |
8.81% |
20.55% |
0.43 |
-38.34% |
-19.40% |
0.23 |
0.45 |
Tactical FX Hedging Strategies
We know from previous sections that passive hedging may or may not be beneficial and that the final answer to the question whether to hedge is not clear. So, what if we hedged only if it was favorable? We now implement a few “favorable” rules, based on which we decide whether to hedge or not.
To hedge our portfolio, we use EUR/USD futures in all three of these strategies. Additionally, all strategies have a 2-day implementation lag and are rebalanced on a weekly basis. We compare the Tactically hedged EZU US portfolio to the unhedged EZU US portfolio.
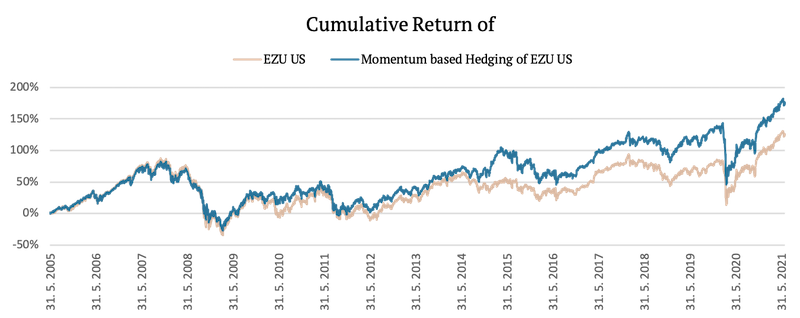
FX Momentum hedging
Our first tactical hedging strategy is based on Momentum. We calculate the 3-,6-, 9- and 12-month momentum of EUR/USD rate. If the 3-moth momentum is negative (indicating possible further euro depreciation), we short ¼ of the future. We do the same for 6-, 9- and 12-month momentum. In other words, we hedge only when the euro weakens. So, we are 100% hedged if all four signals say that euro is weakening. The following figure shows the cumulative return of this strategy compared to the unhedged EZU US.
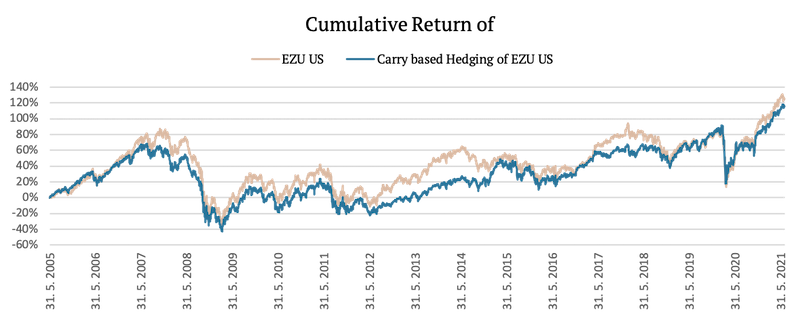
FX Carry hedging
The second, Carry based hedging strategy, is based on the interest rate differential. We compare 3Month USD Libor and 3Month EUR Libor. We hedge our portfolio only if the 3Month EUR Libor is lower than the 3Month USD Libor. In other words, we hedge the euro only if the interest rate differential is favorable for the US based investor. The following figure shows the cumulative return of this strategy compared to the unhedged EZU US.
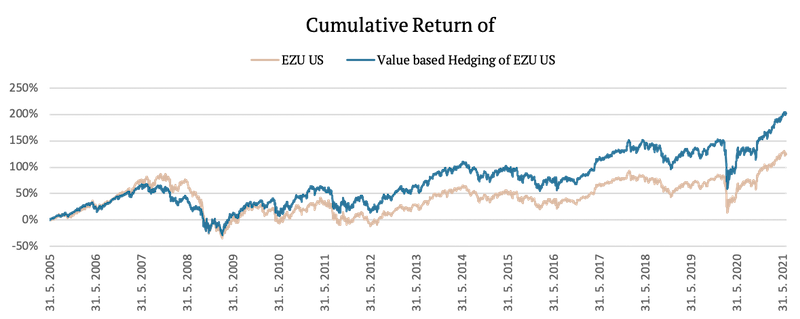
FX Value hedging
We now present a very simple Value strategy, or, in other words, a long-term Reversal strategy. There are many different proxies for a currency Value. We opted for the simple technical one. Our Value based hedging strategy looks at a 5-year history of the EUR/USD rate. We hedge the euro in the portfolio only if the most recent rate is larger than the past 5-year average (indicating possible Reversal). The following figure shows the cumulative return of this strategy compared to the unhedged EZU US.
Finally, let’s examine the risk and returns characteristics of all the tactical hedging strategies compared to the EZU US ETF and passively hedged EZU US using futures.
|
|
CAR |
6Y |
Sharpe |
Max DD |
95% DD |
CAR/ |
CAR/ |
|
Momentum based |
6.47% |
24.02% |
0.27 |
-59.96% |
-42.66% |
0.11 |
0.15 |
|
Carry based |
4.89% |
25.35% |
0.19 |
-66.33% |
-50.39% |
0.07 |
0.10 |
|
Value based |
7.09% |
24.58% |
0.29 |
-57.48% |
-33.97% |
0.12 |
0.21 |
|
EZU US |
5.15% |
25.70% |
0.20 |
-65.34% |
-48.92% |
0.08 |
0.11 |
|
Hedged EZU US |
6.52% |
23.18% |
0.28 |
-61.09% |
-44.63% |
0.11 |
0.15 |
Each of the three tactical FX hedging strategies performs differently in various market conditions. Two out of three strategies outperformed the unhedged ETF, while one of them outperformed even the hedged ETF. Tactical FX hedging strategies may serve as a good starting point for investors who need to decide when to hedge and when not to hedge their FX risk.
Author:
Daniela Hanicova, Quant Analyst, Quantpedia
Are you looking for more strategies to read about? Sign up for our newsletter or visit our Blog or Screener.
Do you want to learn more about Quantpedia Premium service? Check how Quantpedia works, our mission and Premium pricing offer.
Do you want to learn more about Quantpedia Pro service? Check its description, watch videos, review reporting capabilities and visit our pricing offer.
Do you want algorithmic access to the full Quantpedia database via the API? Subscribe to Quantpedia Pro, ask for an API key, and explore the in/out-of-sample statistics, source academic papers, and code snippets — ideal for quantitative research, systematic trading workflows, and AI model training.
Are you looking for historical data or backtesting platforms? Check our list of Algo Trading Discounts.
Or follow us on:
Facebook Group, Facebook Page, Telegram, Twitter, Linkedin, Medium or Youtube
Share onLinkedInTwitterFacebookRefer to a friend


