Convolutional neural networks (CNNs), inspired by the human brain’s ability to recognize visual patterns, excel in tasks like object detection, facial recognition, and image classification, making them powerful tools for extracting insights from visual data. However, we are traders, so a natural question arises: Can we use that in trading? A recent paper shows that we can actually do it. Utilizing CNNs, Niklas Paluszkiewicz introduces a novel approach to pairs trading by visually analyzing historical price movements while converting traditional time series data into image representations.
Pair trading strategies profit from price differences between similar securities by taking opposite positions and waiting for the prices to converge. The author creates signals for trading by using CNNs to analyze images of cumulative residuals, which are returns not related to systematic risk factors. The CNN estimates the probability of upward movements across various hedge portfolios. Based on these probabilities, portfolios are constructed by taking long positions in high predicted probabilities and short positions in those with low predicted probabilities. According to the analysis, the highest risk-adjusted returns are achieved based on three months’ images. Overall, this paper contributes to the growing use of alternative data representations in financial forecasting, demonstrating the effectiveness of image-based analysis for creating profitable trading strategies.
Authors: Niklas Paluszkiewicz
Title: From Pixels to Profits: Trading Arbitrage Portfolios based on Image Representations
Link: https://papers.ssrn.com/sol3/papers.cfm?abstract_id=4612557
Abstract:
This paper explores a novel approach to statistical arbitrage by utilizing Convolutional Neural Networks (CNNs) to predict directional shifts in excess returns of arbitrage portfolios, which are constructed based on multifactor models. Using image representations of historical return co-movements to identify nonlinear predictive relationships, the study applies CNNs to extract relevant geometrical return patterns from the data. The empirical results illustrate that the proposed image-based arbitrage strategies yield significant excess returns, which are not explained by common risk factors. Further investigations into the sources of these excess returns – namely omitted factor momentum, leverage and margin constraints, and lottery demand – do not conclusively account for the observed profits.
As always we present several interesting figures:

Notable quotations from the academic research paper:
„Following the financial literature on risk-based asset pricing models, the return of a security can be decomposed into systematic and idiosyncratic components. The systematic portion can be estimated by linear regression, where the return series of the security is regressed against the returns of the risk factors in the model. The idiosyncratic part is given by the residuals of this regression, which are orthogonal to the risk factors and, if the factor model is properly specified, they should carry no risk premium, i.e., the unconditional mean of these residuals is zero. Due to the inherent idiosyncratic risk, the cumulative residuals over a period may fluctuate around this value, but should eventually converge to their mean. In what follows, I construct tradable arbitrage portfolios based on residuals that are ex ante unrelated to systematic risk. The goal of this approach is to identify signals in the time series of cumulative residuals to predict the change in the next period.
Predicting the change in the residuals is the same as predicting the movement of the underlying arbitrage portfolio, which is captured by the spread between the return on the security and the hedge portfolio, i.e. the systematic return component. The convolutional neural network is therefore used to provide a probability estimate of upward movements in the space of all possible hedge portfolios. From these probability estimates, portfolios are created by going long in such portfolios with high estimated probabilities and short in those with low estimated probabilities.
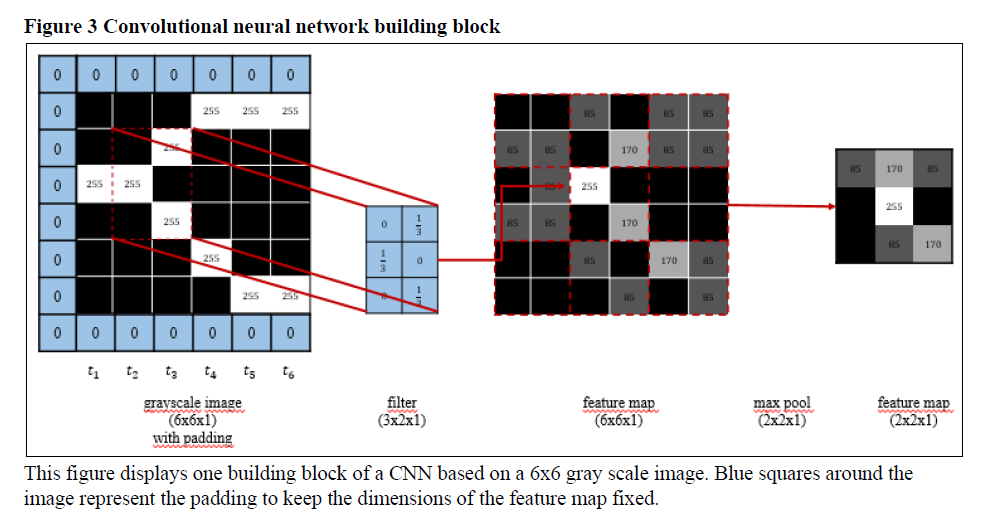
The motivation behind transforming time series data to images is threefold: First, Convolutional Neural Networks (CNNs) have shown great success in the computer vision literature in the recent past for which their performance is described as “superhuman” (He et al. (2015)…. Second, neural networks are inspired by the human brain, which is adept at quickly identifying geometrical patterns…. Third, transforming data into images standardizes the data in a gridlike structure. The process of scaling and normalizing time series data can potentially decrease noise and enhance comparability of the data across multiple instances, thereby facilitating pattern recognition.
The spread between the stock and the hedge portfolio is predicted by using a CNN. The input to the CNN consists of images composed of daily time series data of the stock, the hedge portfolio, and the spread. Each image is generated by stacking individual time series data on top of each other, creating a three-channel image. The CNN is trained to identify patterns and correlations within the input time series that are relevant to predict the probability of the spread to be higher than the cross-sectional median across stocks in the next period. Using a CNN has the advantage that it can automatically learn features from the prediction task without requiring explicit feature engineering. By maintaining the structure of the input images, a CNN can exploit spatial information such as the orientation and relational positioning of objects within the image.
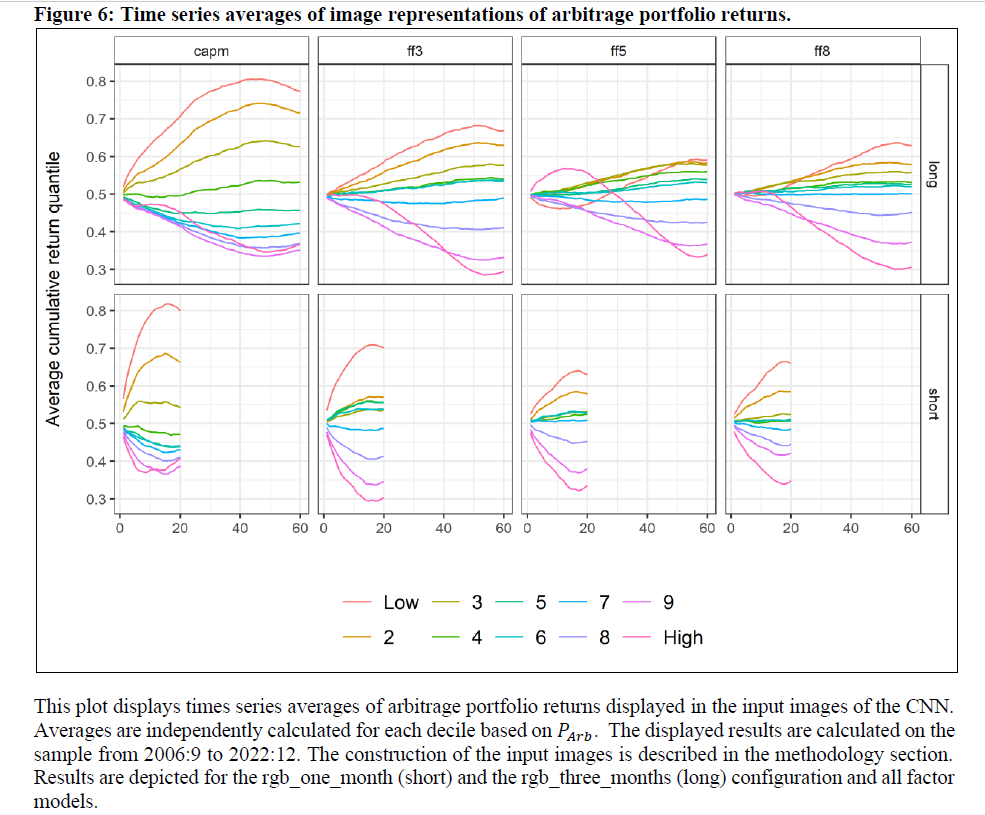
In particular, the analysis shows that the highest risk-adjusted returns are achieved on the basis of three months’ images, suggesting that these configurations better capture complex return dynamics.
In summary, the study provides convincing evidence of the potential of CNN in predicting the performance of arbitrage portfolios based on stock residuals. It also highlights the limited role of factor momentum, margin and leverage constraints and lottery demand in driving these portfolios.“
Are you looking for more strategies to read about? Sign up for our newsletter or visit our Blog or Screener.
Do you want to learn more about Quantpedia Premium service? Check how Quantpedia works, our mission and Premium pricing offer.
Do you want to learn more about Quantpedia Pro service? Check its description, watch videos, review reporting capabilities and visit our pricing offer.
Are you looking for historical data or backtesting platforms? Check our list of Algo Trading Discounts.
Or follow us on:
Facebook Group, Facebook Page, Twitter, Linkedin, Medium or Youtube
Share onLinkedInTwitterFacebookRefer to a friend


