As the world’s attention shifts from the US-centric equity markets to international equity markets (which strongly outperform on the YTD basis), we could review some interesting anomalies and patterns that exist outside of the United States. In the world of monetary policy, traders have long observed a notable positive drift in U.S. equities on days surrounding Federal Reserve (FOMC) meetings. Interestingly, a similar—but slightly shifted—pattern emerges in European markets around European Central Bank (ECB) press conferences. Our quantitative analysis reveals that European equity markets tend to exhibit a strong and consistent upward drift on the day before the ECB’s scheduled press conference. The reason for this timing difference lies in logistics: since the ECB typically speaks at 14:15 CET (8:15 a.m. EST), well before the major U.S. markets open, investors often front-run the potential market-friendly signals from the central bank. Rather than risk holding positions into the uncertainty of the announcement itself, market participants gradually build up exposure the day before, pricing in expectations of dovish or supportive policy moves.
Introduction
In central banking, the European Central Bank (ECB) and the Federal Reserve (FED) play pivotal roles in shaping financial markets through their monetary policies. The Federal Open Market Committee (FOMC) meeting effect, as documented by Quantpedia, highlights significant stock price movements around FOMC announcements, underscoring the impact of central bank decisions on financial markets. This article explores how markets respond to the European FED counterpart, the ECB, and its policies, focusing on
- the concept of drift—the tendency of asset prices to move in a particular direction over time—and
- the skewness of returns, which reflects the asymmetry in market reactions around the time of central bank announcements.
Background
Central banks like the ECB and the FED influence financial markets through various mechanisms, including interest rate adjustments and forward guidance. The FOMC, in particular, has been studied extensively for its influence on stock prices.
Research suggests that institutional investors exploit Fed leaks to trade ahead of FOMC meetings, leading to informed trading that can significantly impact market outcomes. Additionally, our in-house research found that calendar and seasonal anomalies, such as the FOMC meeting effect, can be combined with other strategies to enhance profitability.
Methodology
We employ a quantitative approach to assess market price action and return distributions prior, and following central bank policy announcements. The analysis includes only immediate reactions and short-term implications based on market volatility caused by anticipated ECB decisions.
Data
Our study analyzes the impact of ECB announcements on
- European indices such as the DAX and STOXX 50, alongside
- the effects of ECB decisions on U.S. ETFs like FEZ (SPDR Euro Stoxx 50 ETF), VGK (Vanguard European Stock Index Fund ETF), EWG (iShares MSCI Germany ETF), and HEDJ (WisdomTree Europe Hedged Equity Fund) ETFs.
For all of the ETF historical data, we used data from EODHD.com – the sponsor of our blog. EODHD offers seamless access to +30 years of historical prices and fundamental data for stocks, ETFs, forex, and cryptocurrencies across 60+ exchanges, available via API or no-code add-ons for Excel and Google Sheets. As a special offer, our blog readers can enjoy an exclusive 30% discount on premium EODHD plans.
Monetary policy statements data are sourced from the official ECB website.
- The first one is from September 1998, coinciding with our DAX and EWG sample start.
- The STOXX sample starts in 2007,
- VGK in 2005,
- FEZ in 2002, and
- HEDJ in 2010.
Results
Market Reactions to ECB Announcements
Preliminary findings indicate that markets exhibit significant drift and volatility adjustments preceding ECB policy decisions, which differ slightly from the price-action around FED announcements.
The magnitude of these effects varies depending on the policy announcement and the prevailing market conditions. For instance, easing monetary policy shocks tends to elicit positive market reactions, particularly among active traders and hedge funds close to regional reserve banks. However, we observe a notable phenomenon where the drift is most pronounced not on the day of the ECB conference but on the day preceding it. This can be attributed to the “buy the rumor, sell the news” adage, where market participants adjust their positions in anticipation of the announcement rather than responding to it.
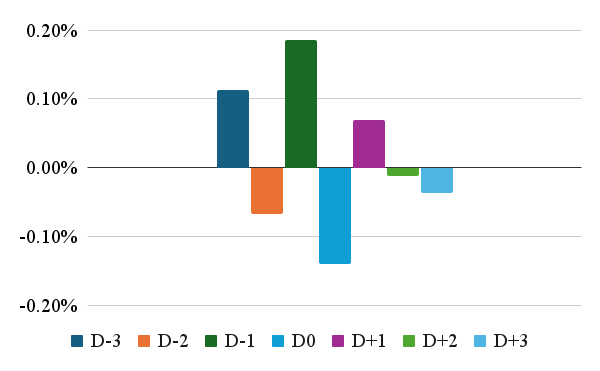
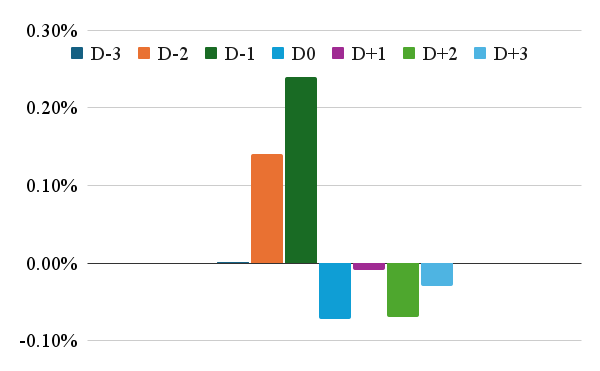
Visualizing Stock Index Market Reactions
To illustrate these dynamics, we first present histogram charts for the DAX and STOXX 50 indices and equity curves for D-1 positions (performance of the hypothetical trading strategy that buys DAX or STOXX 50 index on D-2 close and sells index on the close of D-1 day).
Distributions of Returns per Day of Preceding and After ECB Meetings


We can see that returns on the day preceding the conference are significantly positive; can we make something out of it? Let’s continue and and study the performance of D-1 equity curves, highlighting the effectiveness of holding European stock indices D-1 days before ECB meetings.

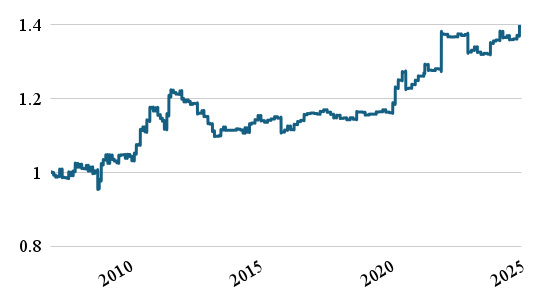
These simple strategies leverage the pre-announcement drift to generate positive returns.
Sessions Returns
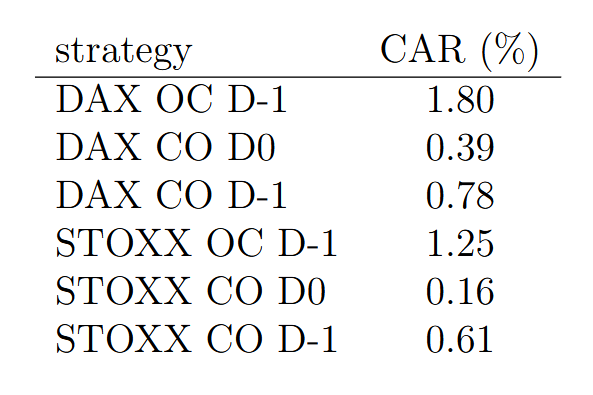
Our further analysis involves dissecting these indices into Open-to-Close (OC) and Close-to-Open (CO) sessions. To save the space, we ppresent just the DAX Index results, as it seems the most sensitive to ECB decisions. However, the STOXX 50 Index movement patterns are very similar. Our goal was to better identify when the price action occurs—in the intraday (open-to-close) or overnight (close-to-open) sessions.


What is the main takeaway from our analysis? We can observe that the pre-ECB drift occurs during 3 different sessions – Close-to-Open session during the night (from D-2 to D-1), then during the Open-to-Close session in the D-1, and indexes have a still positive performance during the Close-to-Open session from D-1 to D0 day (so during the night preceding ECB press-conference). The price action is the same for the DAX and the STOXX 50 Index, too.
The equity curves for D0 Open-to-Close sessions in both indices reveal an adverse market reaction to ECB announcements, indicating that markets tend to react negatively to ECB policy revelations.


We can summarise the overall annualised (yearly) return for all abovementioned simple strategy variations in the following table:
Why do the markets react differently to ECB announcements (pre-ECB drift) than to FED announcements (FOMC meeting drift)? We have our own hypothesis, and it is connected to the role of international investors in the European markets. We will get to it, but first, let’s analyze how the US-listed European equities perform during the pre-ECB drift.
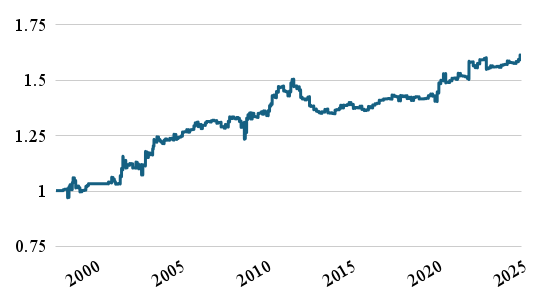
U.S. ETFs Analysis of European Indices
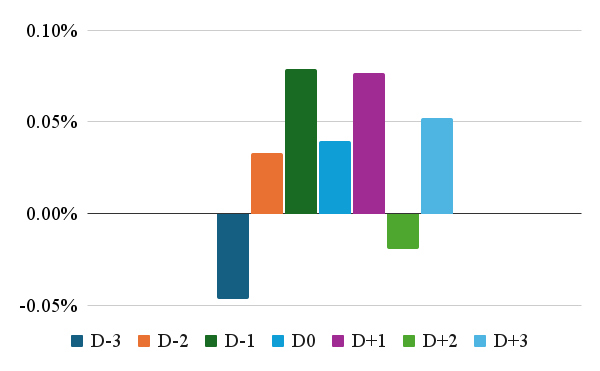
In the following charts, we present histogram of average daily performance over the D-3 to D+3 days and a equity curves for the U.S. ETFs – FEZ, VGK, EWG, and HEDJ, which invest in European stock indices.

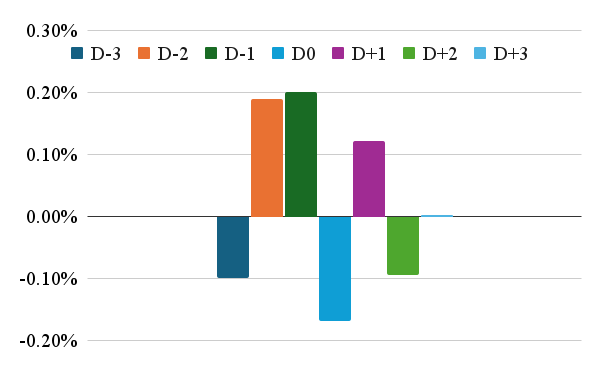

As can be seen, these distributions pretty much mirror our analysis about European stock indices and follow the same performance distribution patterns.
However, it’s important to take into consideration that the US ETFs close trading at 4pm New York time, which is 10pm Paris/Berlin time. So D-1 performance bar for the US investor starts at 4pm NY (10pm Berlin) on D-2 and ends at 4pm NY (10pm Berlin) time. Why it’s important? If you are a US-based investor, you trade in the US hours and want to avoid the ECB rate decision; you can’t hold the ETFs overnight. You must sell them on D-1 close as the ECB rate decision is announced on D0 day in the morning when the US market is still closed.
How would the cumulative performance of such a simple strategy look like?

As US investors, we do not need to hold the ETF just for one day; we can even have the position for 2 days preceding the announcements; this is how the performance and return-to-risk characteristics would look like:
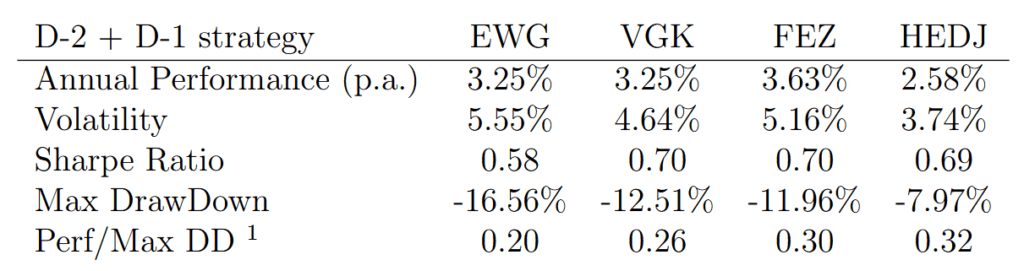
1 Calmar Ratio
However, why do we have the “pre-ECB drift” and not the “ECB drift” on day D0 itself? We will leave the exact economic forces in play for other analysts however our theory is that there are behavioral biases in play. The most probable explanation is that US institutional investors front-run the announcement and unwind their longs the day before the meeting at the close of the US session since the ECB announcement release is scheduled in pre-market hours, outside of the regular trading session in America. Active traders and investors may be willing to risk holding positions a few hours or even minutes before the FED announcement but are not so willing to do it for the ECB. The European Central Bank doesn’t have the same position as the global liquidity supplier as the FED. So, from the perspective of the US trader or investor, it makes sense to speculate a little (the day before). However, it doesn’t make sense to hold the risky position overnight and rebalance portfolio (or cut risk) during morning hours when the US markets are still not open.
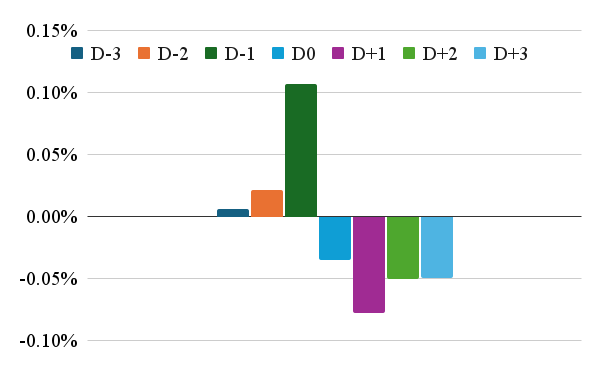
Can we confirm our hypothesis? Not directly (we did not ask US traders about their feelings about the ECB), but we can calculate the spread between EWG and SPY ETFs and look at it. The distribution of the performance for days D-3 to D+3 for the spread itself should give us some understanding of whether the pre-ECB drift is caused by the performance of the global stock markets or just by the European price action itself. In the following chart, we can clearly see the build-up in the performance of the spread in D-2 and D-1 days and the negative performance from days D0. This suggests that the pre-ECB drift is really just a European-only phenomenon. However, it also suggests, that external (non-European) investors may really drive the drift itself.
Conclusions
In conclusion, our short study contributes to understanding how central bank actions, particularly those of the ECB, influence financial markets. Investors can develop more informed strategies to capitalize on market movements around ECB policy announcements by identifying and quantifying the pre-ECB effect. Furthermore, policymakers can use these insights to refine communication strategies and better manage market expectations. The findings also highlight the importance of considering behavioral biases and institutional investor actions in understanding market dynamics.
Our suggested strategy variants, which involves holding positions D-2 and D-1 days before ECB meetings, demonstrates potential for generating positive returns. However, it is crucial to continuously monitor and adapt this strategy as market conditions evolve, ensuring it remains effective in capturing the pre-ECB drift. Moreover, incorporating behavioral finance insights and understanding institutional investors’ role in shaping market reactions can further refine this approach, leading to more sophisticated investment decisions.
Future research could explore how these effects vary across economic conditions and policy environments, providing a more nuanced view of central bank influence on financial markets. Additionally, integrating advanced econometric models and machine learning techniques could enhance the predictive power of such analyses, offering more robust investment strategies and policy recommendations.
Are you looking for more strategies to read about? Sign up for our newsletter or visit our Blog or Screener.
Do you want to learn more about Quantpedia Premium service? Check how Quantpedia works, our mission and Premium pricing offer.
Do you want to learn more about Quantpedia Pro service? Check its description, watch videos, review reporting capabilities and visit our pricing offer.
Are you looking for historical data or backtesting platforms? Check our list of Algo Trading Discounts.
Or follow us on:
Facebook Group, Facebook Page, Twitter, Linkedin, Medium or Youtube
Share onLinkedInTwitterFacebookRefer to a friend


