Introduction
Inflation significantly impacts the prices of gold and treasury bonds through various mechanisms. Gold is often viewed as a hedge against inflation, while treasury bonds exhibit a more complex relationship influenced by interest rates and investor behavior. This relationship between inflation, gold, and treasuries is well understood, but the real question is whether we can systematically capitalize on it. In this article, we explore how inflation data can be used to build fixed income market timing trading strategies—and as our findings suggest, the answer is a definite yes.
Description of Research Problems/Questions
Inflation and asset performance have long been focal points in financial economics. Historically, inflation has been shown to influence both Treasury bond and gold prices significantly. For instance, Barsky et al. (2021) highlight that gold often serves as a hedge against inflation, with rising inflation expectations driving up gold prices. Similarly, Rose (2014) underscores the inverse relationship between inflation and bond yields, where higher inflation typically leads to lower bond prices. This body of research collectively emphasizes the critical role of inflation in shaping the performance of key economic assets.
In light of these insights, this article aims to delve deeper into the mechanisms through which inflation impacts US treasury and gold prices, providing a comprehensive analysis and suggesting a few simple systematic market timing strategies that exploit this complex relationship.
Hypothesis Formation
Central banks’ monetary policies, particularly interest rates and quantitative easing (QE), significantly influence inflation, gold, and treasury prices. The interplay of these factors can be understood through various mechanisms that affect asset pricing and market behavior. While central banks aim to stabilize the economy through these policies, the resulting inflationary pressures and asset price volatility can lead to unintended consequences, such as market distortions and increased economic uncertainty.
One observation that market practitioners make about central banks’ policies is that the absolute level of inflation does not significantly impact the economy (and central banks’ decisions); rather, the change in inflation (rate of change – increase or decrease) does.
For example, the Federal Reserve targets a 2% annual monthly inflation rate, approximately 0.2%. If this inflation rate remains positive each month but does not accelerate, the situation remains stable, and the Fed has no reason to intervene.
However, consider the following scenario: the month-over-month (MoM) inflation rate for May is 0.2%, June 0.4%, July 0.8%, and August 1.6%. This scenario indicates an acceleration of inflation, which is problematic. In such cases, the Fed is compelled to respond, typically through raising interest rates. This period is unfavorable for bonds but could benefit gold as an inflation hedge. And this observation is the basis for our investment strategy.
Research Design Overview
Data Sources, Collection & Analysis
The data set comprises Exchange-Traded Funds (ETFs); equivalent indices are utilized before ETFs exist.
The data sample commences in 1981, which was chosen deliberately due to the commencement of a robust bond bull market. Should our model successfully outperform the benchmark (buy-and-hold bond index), it would be a significant achievement, given the challenge posed by bond indices during this period, which exhibited exceptionally high Sharpe and Calmar ratios. This was primarily due to interest rates declining from approximately 10% to near-zero levels.
Our considered data sample ends in November 2024 and our investment universe consists of the following ETFs (and their index proxies before the ETFs’ inceptions):
- SPDR Gold Shares (GLD)
- iShares 7-10 Year Treasury Bond ETF (IEF)
- iShares 20+ Year Treasury Bond ETF (TLT)
- iShares 1-3 Year Treasury Bond ETF (SHY)
- Invesco DB US Dollar Index Bullish Fund (UUP)
The process of obtaining the correct inflation data is tricky. Of course, we have the Consumer Price Index for All Urban Consumers: All Items in U.S. City Average (CPIAUCSL) from FRED (Federal Reserve Bank of St. Louis). However, this dataset is often recalculated, and it’s not a point in time. Therefore, we decided to go to the source, the U.S. Bureau of Labor Statistics, download all files with the actual/reported inflation announcements and extract inflation data as they had been reported in the past since 1994. This way, we had the accurate point-in-time data (as reported) from 1994, and we used the FRED data from 1981 to 1994.
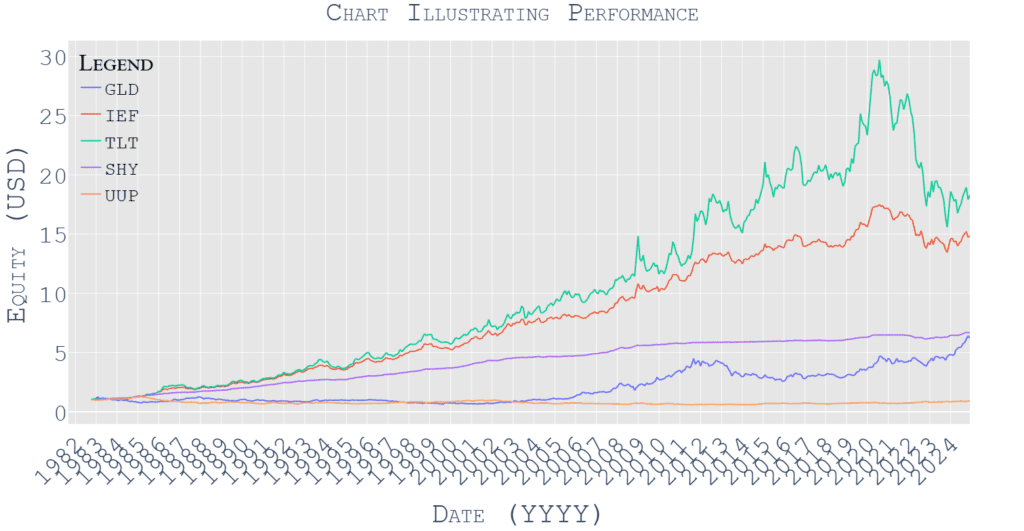
The following chart illustrates the vanilla performance of considered assets during the abovementioned period:
And, the risk & return table accompanying the abovementioned figure is below.


A data sample covering more than 40 years shows that treasury bonds have been in a secular bull market while gold has relatively struggled to keep up against fixed-income. The US Dollar (against a basket of other currencies) did not move much and finished 40 years at approximately the same level as it started.
Impact of Inflation
Now, let’s review the performance of assets in various economic regimes based on our inflation measure. The decision rule is straightforward – when the monthly change in MoM inflation report is positive for 2 months in a row, then we switch into the market regime in which we consider that inflation goes UP. When the monthly change in MoM inflation report is negative for 2 months in a row, then we switch into the market regime in which we consider that inflation goes DOWN. In all other circumstances, we retain the regime from the previous month.
Let’s have an example:
The reported inflation for January is +0.3%, February +0.3%, March +0.4%, April +0.5%, May +0.5%. The change between February and January is 0%, between February and March is +0.1%, between March and April is 0.1%, and lastly, between April and May is 0%. In our theory, while the high monthly inflation is a little troubling for the FED (or any central bank), what is significantly more dangerous is when the rate of change of the inflation is positive. The high January and February inflation (0.3% MoM, 3.6% annualized) is unpleasant but doesn’t require FED’s attention. What’s risky is if inflation accelerates -> March is +0.4%, April is +0.5%. This acceleration in inflation will probably cause the FED to jump into action, which is why we use 2 successive monthly accelerations as a trigger for regime change in our model. Of course, the inflation data are delayed, so we know April’s inflation in May, so the change is actually recorded in the data at the end of May. A similar logic is used for the signal change to the Inflation DOWN regime (with the opposite sign in the calculation, of course).
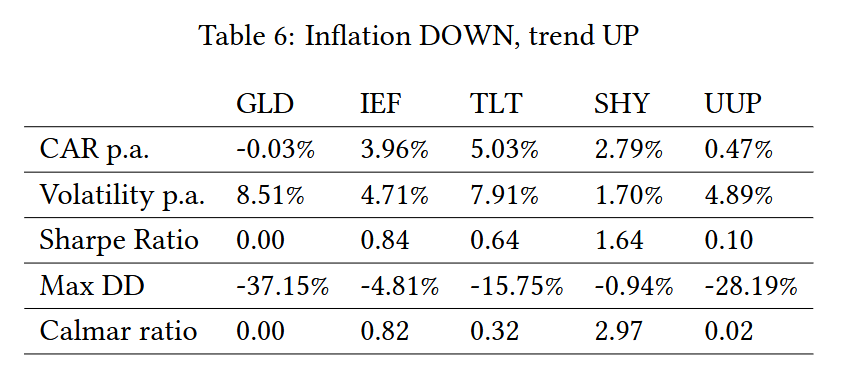
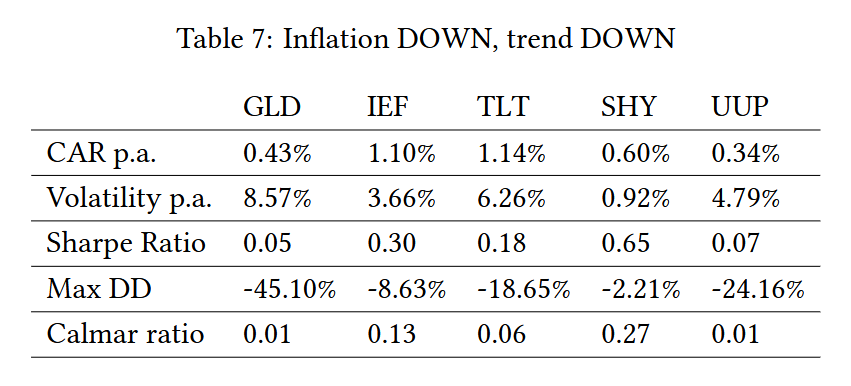
Then we have 2 regimes – Inflation DOWN or Inflation UP and here is what the performance of the selected asset looks like in those regimes:
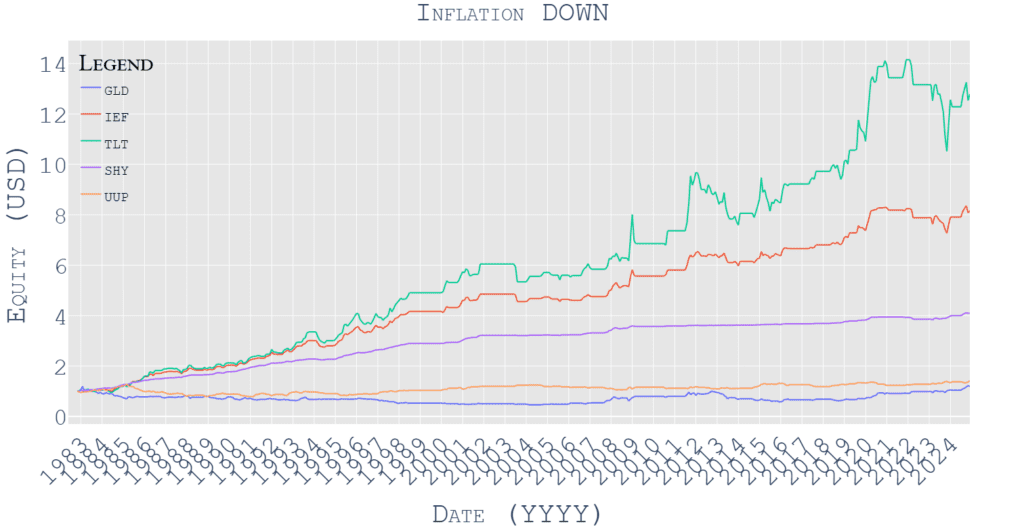
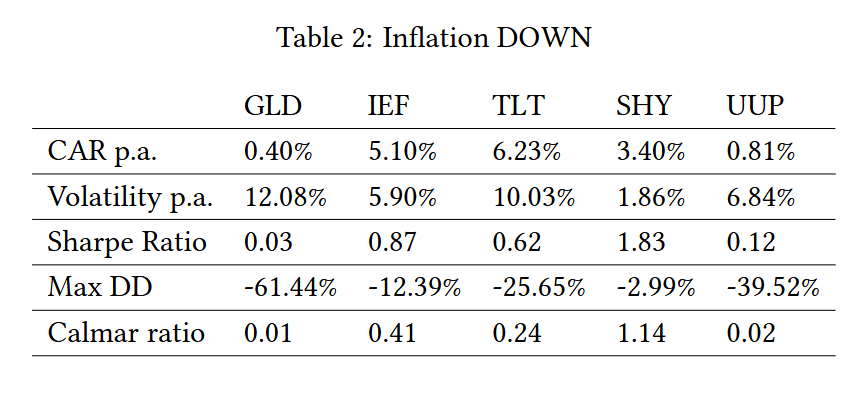
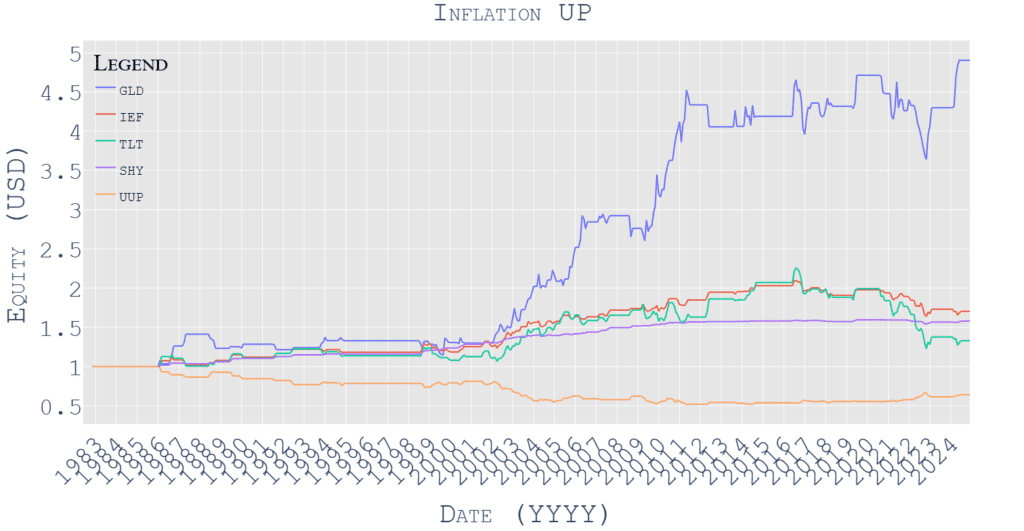

This section highlights that Inflation DOWN regime is highly favorable for bonds, while accelerating inflation benefits gold and short USD positions.
As inflation accelerates, the traditional view posits that gold is a reliable hedge, often appreciating as investors seek to preserve purchasing power. Conversely, the performance of treasury bonds is more complex; higher inflation typically leads to increased interest rates, which inversely affect bond prices. Our simple analysis confirms, that the literature is correct.
However, let’s move on as there are some improvements that can be suggested.
Momentum Inclusion
Continuing our immediate concept, we propose enhancing the model by incorporating a historical trend component (1-month Momentum). The addition of the momentum filter should increase the quality of the signal – if we are in the Inflation DOWN regime and the Momentum signals that treasury bonds already have a positive performance, then the overall return-risk ratio of the asset should be higher. The same should work for the Inflation UP regime and assets that are the most sensitive to it. Altogether, we have possible scenarios and we can explore them.
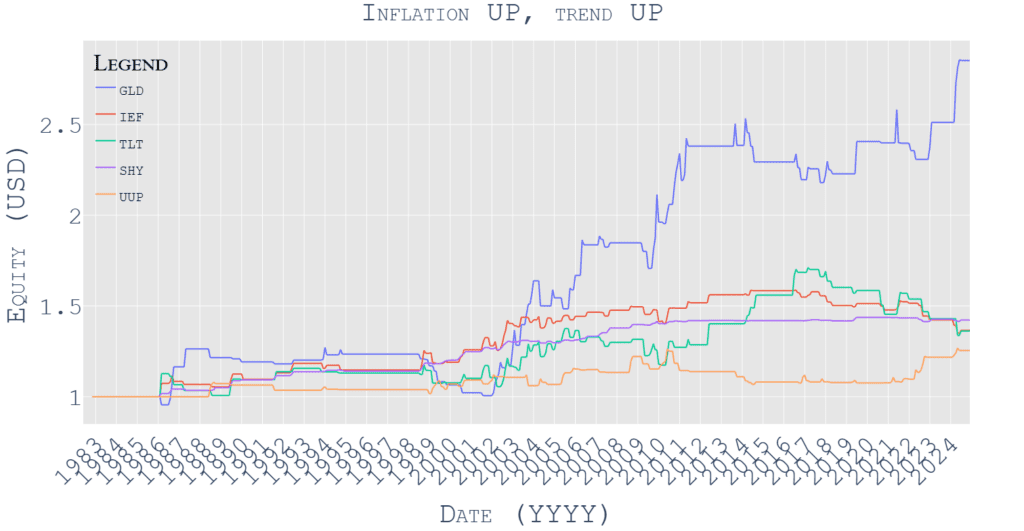
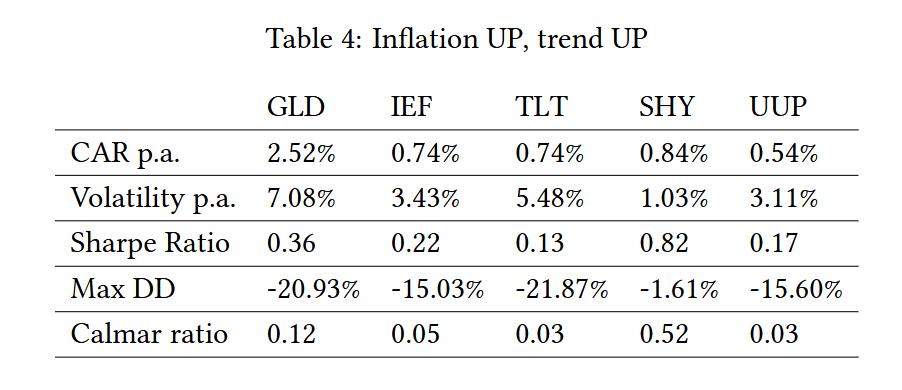
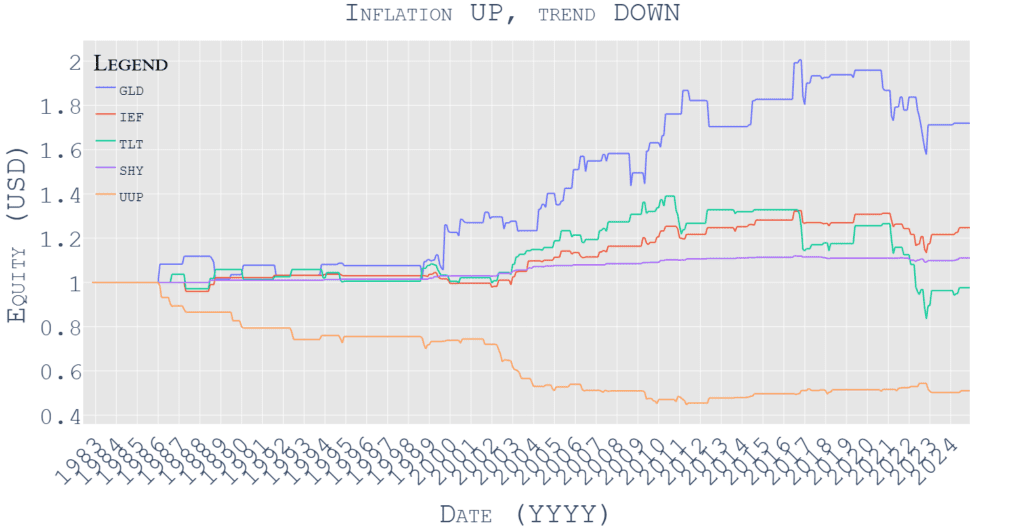
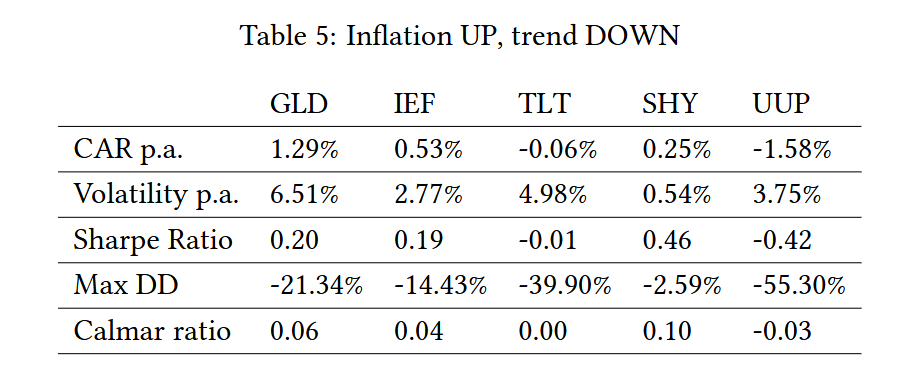


What are the most obvious findings? When the inflation decelerates and treasury ETFs (IEF or TLT) have the positive performance, then that’s the best regime for those funds. On the other hand, when the inflation accelerates, then we can hold GLD in the positive trend (inflation UP trend UP regime) or short USD (short UUP ETF in the inflation UP trend DOWN regime).
Final Model Trading Strategy
The addition of the momentum filter decreases the number of months over which we hold ETFs in the Inflation UP or DOWN regimes, and therefore, we can have a cash position (SHY) to improve the performance if no other ETFs have favorable performance. Our proposed model would, therefore, hold GLD in the Inflation UP Trend UP regime, hold IEF in the Inflation DOWN Trend UP regime, and invest into the cash (SHY) otherwise.
We can compare the performance of the strategy to its natural benchmark -> the equally weighted portfolio of IEF and GLD.
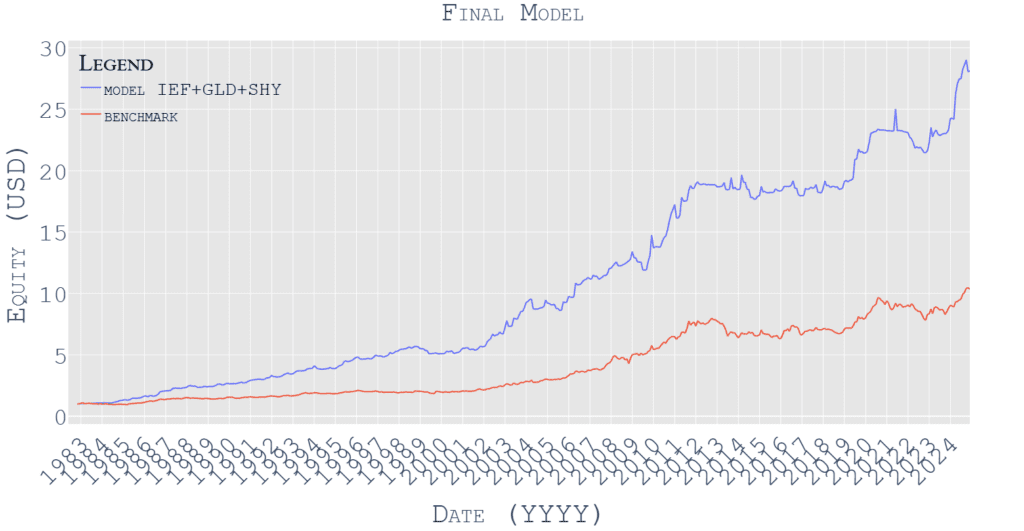
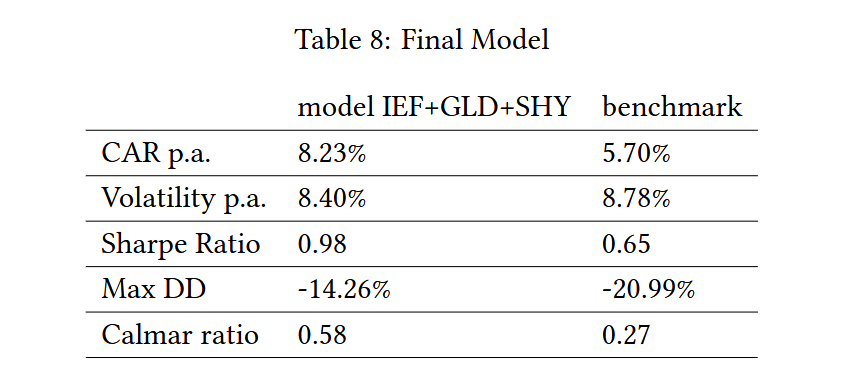
We see that with a simple selection of suitable predictors, we can increase total returns considerably while maintaining satisfying risk parameters. Furthermore, the Sharpe ratio, Calmar ratio, and performance of this strategy are higher than, for example, just holding IEF, TLT, or any other ETF for the whole selected period.
Conclusions
In synthesizing these insights, our research aims to elucidate the mechanisms through which inflation influences asset classes while considering the role of central bank policies. The hypothesis posits that it is not merely the absolute inflation level that matters but its rate of change. This distinction is critical; stable inflation may not provoke significant market reactions, while accelerating inflation compels central banks to adjust monetary policy—typically resulting in higher interest rates that adversely affect treasury prices but may bolster gold as an alternative investment. Our model proposes a trading strategy capitalizing on these dynamics: holding gold during accelerating inflation while favoring treasury bonds in decelerating inflation environments. This approach aims to enhance risk-adjusted returns compared to traditional buy-and-hold strategies.
In conclusion, our findings contribute to the existing literature by offering a comprehensive framework for understanding the interplay between inflation and asset pricing. The proposed model demonstrates that tactical asset allocation based on inflationary signals can yield superior returns while mitigating risks associated with economic volatility. As financial markets evolve amidst changing economic conditions, our research underscores the importance of adaptive investment strategies that respond dynamically to macroeconomic indicators.
Author: Cyril Dujava, Quant Analyst
Are you looking for more strategies to read about? Sign up for our newsletter or visit our Blog or Screener.
Do you want to learn more about Quantpedia Premium service? Check how Quantpedia works, our mission and Premium pricing offer.
Do you want to learn more about Quantpedia Pro service? Check its description, watch videos, review reporting capabilities and visit our pricing offer.
Are you looking for historical data or backtesting platforms? Check our list of Algo Trading Discounts.
Or follow us on:
Facebook Group, Facebook Page, Twitter, Linkedin, Medium or Youtube
Share onLinkedInTwitterFacebookRefer to a friend


