What’s the Best Factor for High Inflation Periods? – Part II
This second article offers a different look at high inflation periods, which we already analyzed in What’s the Best Factor for High Inflation Periods? – Part I. In this second part, we look at factor performance during 10-year periods of high inflation.
High Inflation Periods
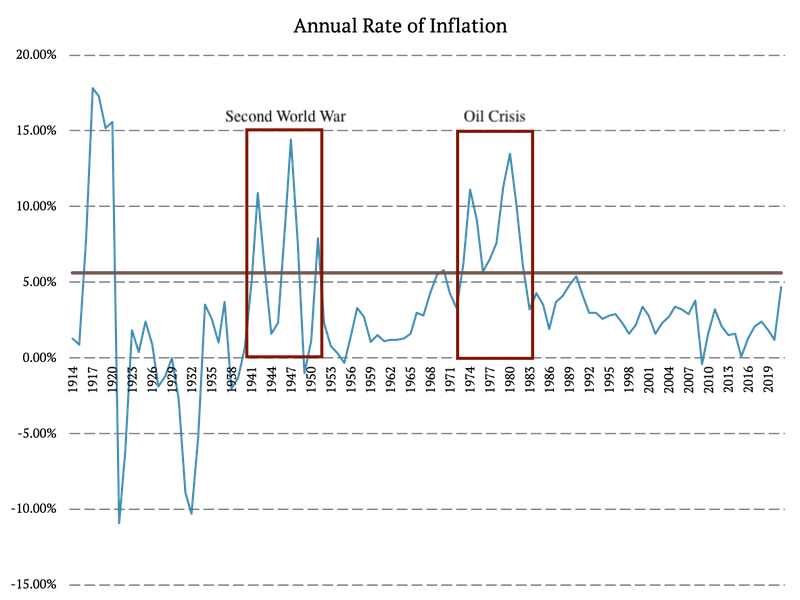
As we already outlined in the first part, inflation measures an increase in prices over time. Most typically, we measure inflation on a yearly basis. We say that inflation is high when the annual increase in prices of goods and services is unexpectedly increased. You might ask what triggers these periods. Most typically, geopolitical conflicts.
The first article looked closely at one-year periods of high inflation. This time we analyze longer periods. Again, we analyzed the Consumer Price Index from the Federal Reserve Bank of Minneapolis, which includes the rate of inflation since 1913. Firstly, we calculated the top quintile and looked at which years inflation was higher. Therefore, we consider years with inflation above 5.62% high-inflation years.
Accordingly, we have selected two 10-year periods with high inflation: 1941 – 1951 (Second World War), 1973 – 1983 (1973 Oil Crisis).
Period 1: 1941 – 1951
The first 10-year period since world war I with abnormal inflation occurred around the second world war. The annual inflation rate started to grow significantly in 1941, and by 1942 it reached 10.9%. After that, the inflation rate oscillated from year to year. However, the average inflation rate during the ten years from 1941 to 1951 was 5.86%, which is higher than the 20th percentile.
Period 2: 1973 – 1983
The second 10-year high inflation period was started by the 1973 oil crisis. The oil crisis was a direct consequence of the Arab-Israeli War. Arab members of OPEC (the Organization of Petroleum Exporting Countries) restricted the U.S. because of their relationship with Israel. The U.S. was re-supplying the Israeli military to gain leverage during the post-war peace negotiations. The inflation rate rose from 3.3% in 1972 to 6.2% in 1973 and 11.1% in 1974. It stayed abnormal until 1983 when it fell to 3.2%.
High Inflation Periods Analysis
The 10-year periods around the second world war and the 1973 oil crisis are the main subjects of this article. We analyze the Fama and French 3 Factors (Mkt, SMB, HML), Momentum, Short-Term Reversal Factor, Long-Term Reversal Factor, and 10 Industry Portfolios during the time of the events.
Market During High Inflation Periods
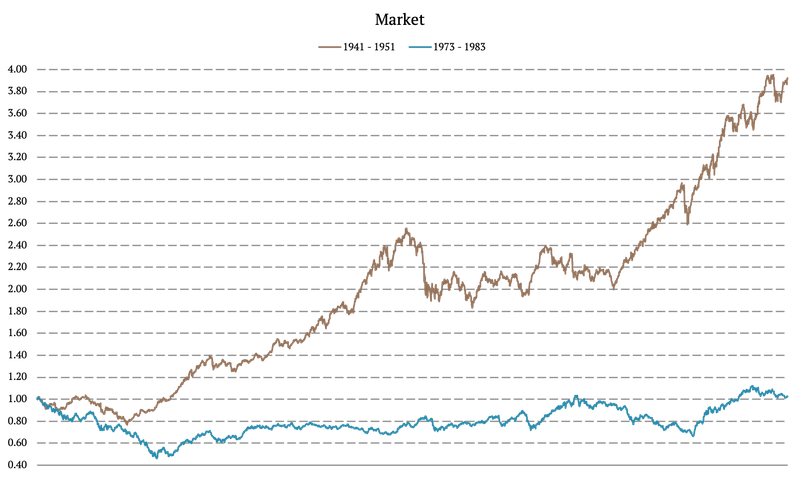
Firstly, we analyze the market’s movement during the abovementioned ten-year periods. The following figure illustrates the equity curves of the market. Market’s performance during the 10-year period around the second world war was 292.38%, and during the 10-year period around the oil crisis was 2.67%.
What’s the takeaway? The first one is that we do not have enough data points in this event-based study. We are missing the WW1 period with high inflation. But what we can say from the two high inflation periods in the 20th century is that market performance can surprise in both directions. It can be abysmal, as in the 70s and 80s. Or it can be roaring as during the 40s. We really do not have enough data points to guess how it will look in the current situation.
Safe-Haven Assets During High Inflation Years
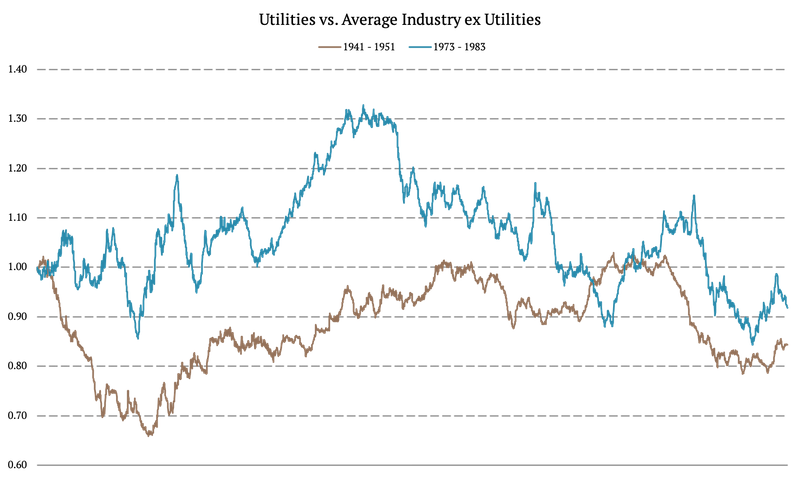
Secondly, we look into how safe-haven assets would behave during the 10-year periods of high inflation. We use the 10 Industry Portfolios to create a bond-like portfolio by going long utilities and shorting the average of the nine industries ex. utilities. The long-short portfolio should have a bond-like payoff. The 10-year performance during 1941 – 1951 is -15.65% and during 1973 – 1983 is -8.06%.
The takeaway – bond-like assets underperform nearly always.
Energy Prices Proxy
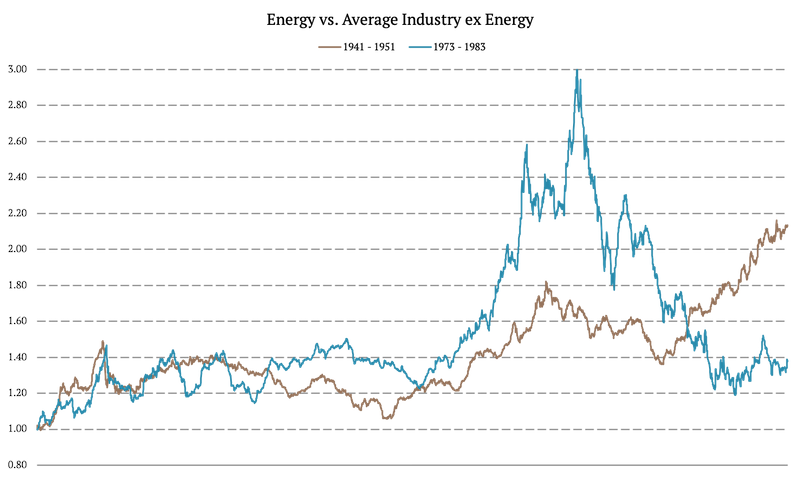
Additionally, we examined the energy prices proxy/ crude oil proxy by calculating another long-short portfolio. Again, we analyze the 10 Industry Portfolios, and we calculate a portfolio that goes long energy and shorts the average of the nine industries ex. energy. Portfolio’s 10-year performance during the period around the second world war was 113.41%, and around the oil crisis was 37.52%.
Those numbers look impressive but notice the path of both equity curves. The energy sector outperforms only during a subset of years, and it’s not such a great hedge. The trend-following filter would probably help, but the outperformance of energy stocks is still far from guaranteed during the whole high inflation period.
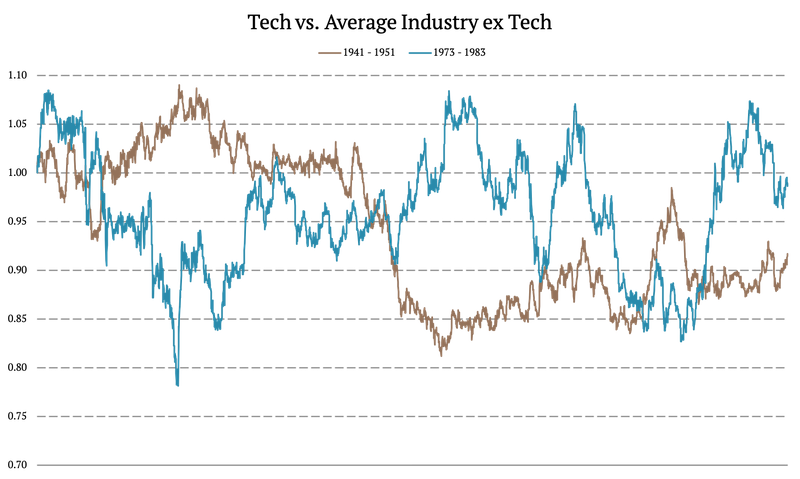
Tech Portfolios During High Inflation Years
Furthermore, we examined the tech prices proxy by calculating another long-short portfolio. Again, we analyze the 10 Industry Portfolios, and we calculate a portfolio that goes long tech and shorts the average of the nine industries ex. tech. Overall, the tech industry portfolio was very volatile during both examined periods. Portfolio’s 10-year performance during the period around the second world war was -8.30%, and around the oil crisis was -1.38%.
We can confidently say that we can’t expect anything stellar from the tech sector’s performance in the high inflation periods. There is no year in which we would prefer to hold or outweigh tech stocks instead of holding just the diversified market index.
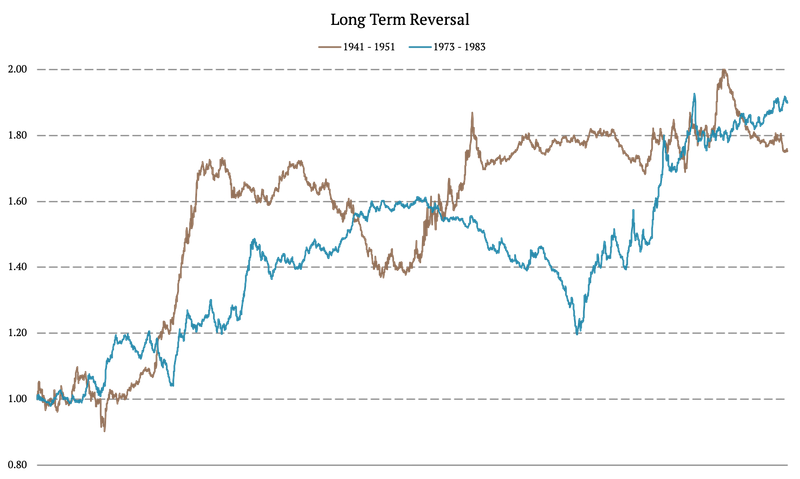
Long Term Reversal Factor
In this section, we explore the long-term reversal factor. The performance of long-term reversal was positive during both examined periods. The 10-year performance of the long-term reversal factor during the period around the second world war was 75.25%, and around the oil crisis was 89.84%.
The long-run reversal factor is a pleasant surprise. The outperformance is not consistent, but equity curves look better than equity curves of displaying alpha of energy stocks portfolio.
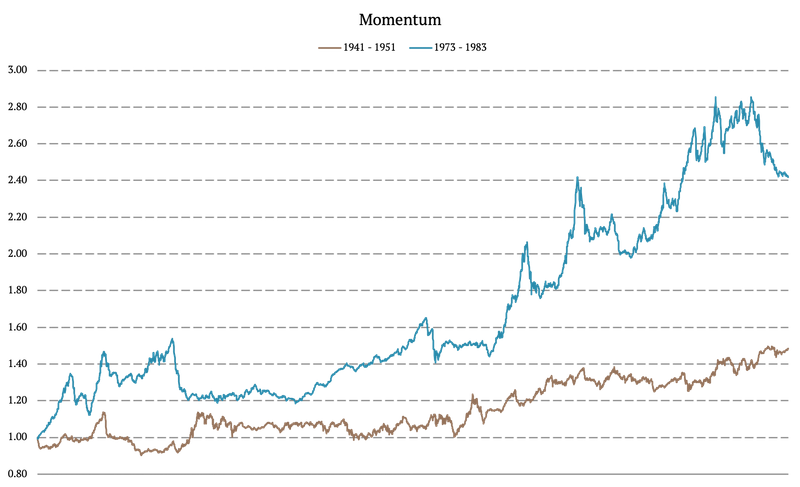
Momentum Effect During High Inflation Periods
The performance of the momentum effect is also positive during both analyzed periods. The 10-year performance during World War II is 48.57%, and 141.77% during the 1973 Oil Crisis.
The momentum factor performance looks promising during high inflation periods.
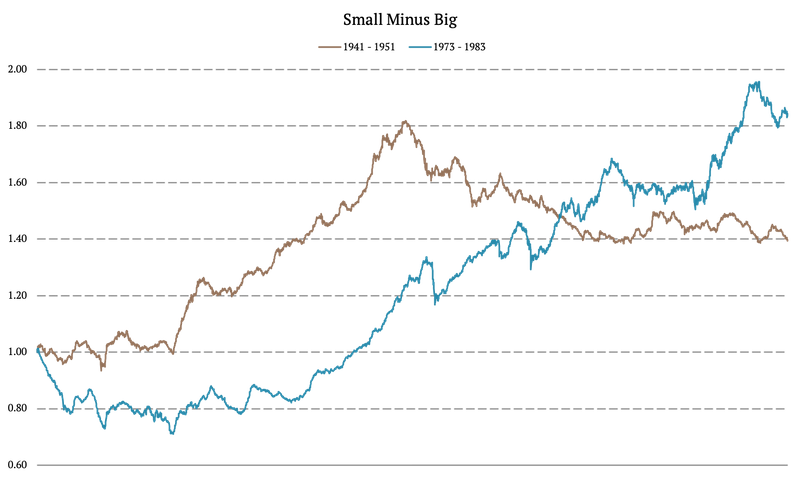
SMB and HML
Small Minus Big (SMB) and High Minus Low (HML) are two of the Fama and French 3 Factors. SMB is defined as the average return on the three small portfolios minus the average return on the three big portfolios. Portfolio’s 10-year performance during the second world war was 39.30%, and during the oil crisis was 84.43%.
The outperformance of small-cap stocks vs. large-cap stocks during high inflation periods looks promising, but it’s not so consistent as the performance of momentum or the last factor in our list – Fama & French HML or value factor.
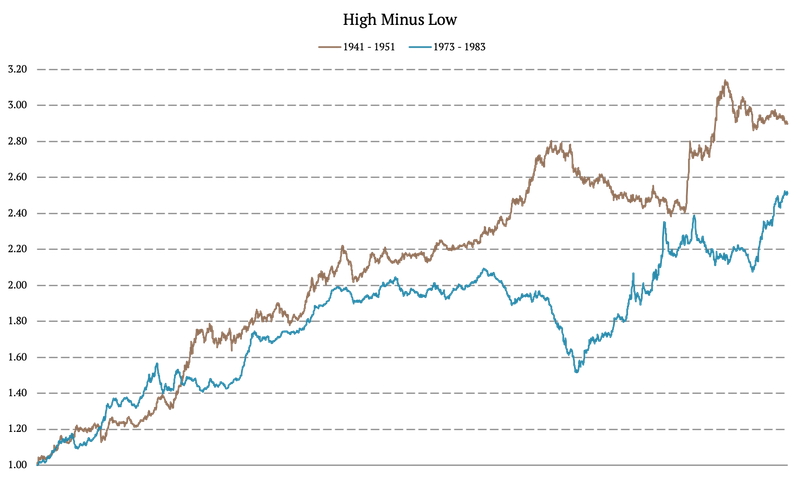
The HML is defined as the average return on the two value portfolios minus the average return on the two growth portfolios. Portfolio’s 10-year performance during the second world war was 189.59%, and during the oil crisis was 150.80%.
And here we have a definitive winner. The HML factor (value stocks) was a true hedge for high inflation periods in the 20th century.
Author:
Daniela Hanicova, Quant Analyst, Quantpedia
Are you looking for more strategies to read about? Sign up for our newsletter or visit our Blog or Screener.
Do you want to learn more about Quantpedia Premium service? Check how Quantpedia works, our mission and Premium pricing offer.
Do you want to learn more about Quantpedia Pro service? Check its description, watch videos, review reporting capabilities and visit our pricing offer.
Do you want algorithmic access to the full Quantpedia database via the API? Subscribe to Quantpedia Pro, ask for an API key, and explore the in/out-of-sample statistics, source academic papers, and code snippets — ideal for quantitative research, systematic trading workflows, and AI model training.
Are you looking for historical data or backtesting platforms? Check our list of Algo Trading Discounts.
Or follow us on:
Facebook Group, Facebook Page, Telegram, Twitter, Linkedin, Medium or Youtube
Share onLinkedInTwitterFacebookRefer to a friend


