100-Years of Multi-Asset Trend-Following
Trend-following strategies have gained extreme popularity in the recent decade. Almost every asset manager utilizes trend following, or momentum, in some form – whether consciously or subconsciously. We at Quantpedia are convinced that each and every strategy has to be scrutinized thoroughly before it’s put into use. This is one of our motivations why we will introduce to you our framework for building a 100-year daily history of a multi-asset trend-following strategy today.
What is Trend-Following?
Trend-following is a market timing strategy that exploits momentum anomaly. The strategy is based on various momentum signals with an aim of gaining an exposure to an asset class at favorable times. In other words, trend-following aims at going long an asset when it is in an uptrend, i.e. rising in price, and going short an asset when it is in a downtrend, i.e. falling in price. Thus, the goal is to outperform the simple buy-and-hold strategies.
How to build a 100-year daily Trend-Following strategy
This article explains how to build a multi-asset trend-following strategy with a 100-year long daily history. To create such a strategy, we had to complete two essential steps. The first, more difficult one, was to obtain the data.
We have already examined how to extend historical daily commodities data to 100 years and how to extend historical daily bond data to 100 years in previous articles. Additionally, Fama & French offer free stock data with a long history. We will use exactly these data series in our following calculations.
The second important step is to create the actual trend following strategy itself and backtest it on these 100 years of data. This article focuses mainly on the calculation of the strategy itself and consequently on an analysis of the results and findings of the backtest.
Methodology
As indicated above, we applied our daily multi-asset trend-following strategy to 3 primary assets popular with CTAs / trend-followers:
- US Equities
- US 10-year bonds (constant maturity)
- Commodities
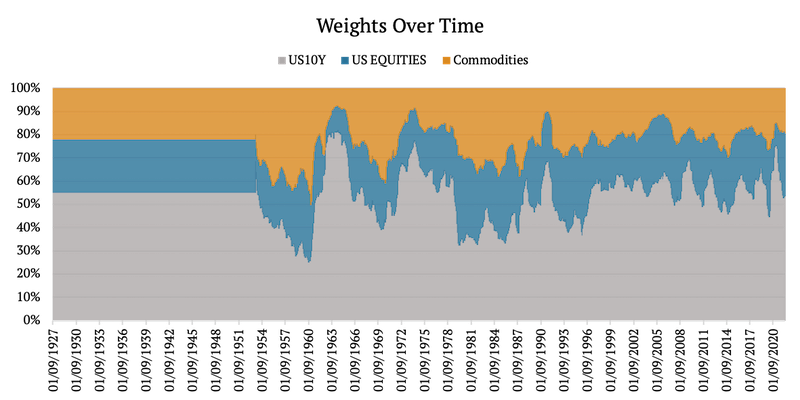
Weighting Scheme
First of all, we calculated the weights for the individual assets. From 1955 to 2022, we calculated inverse volatility weights (naïve risk parity weights). The weights were calculated monthly (on the first trading day of each month) from volatility of daily returns.
However, because the bond data have no intra-month volatility between 1927-1954 (we explain this in detail in our Extending Historical Daily Bond Data to 100 Years article), we could not calculate inverse volatility weights during this period. So, for the sake of simplification, we used fixed weights of 55% / 23% / 22% – bonds/ stocks/ commodities from 1927 to 1954. These weights match the average weights of the respective assets between 1955-2022.
Trend Following Trading Rules
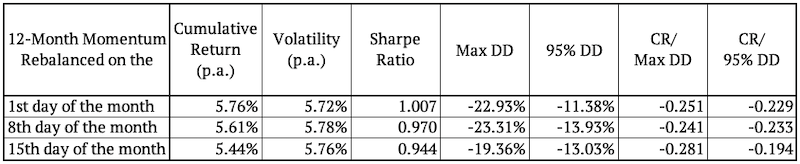
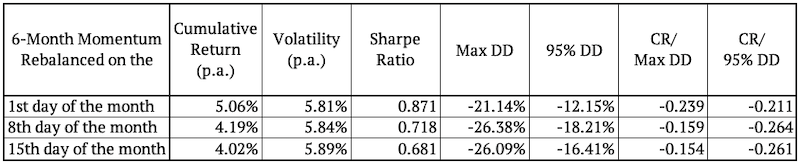
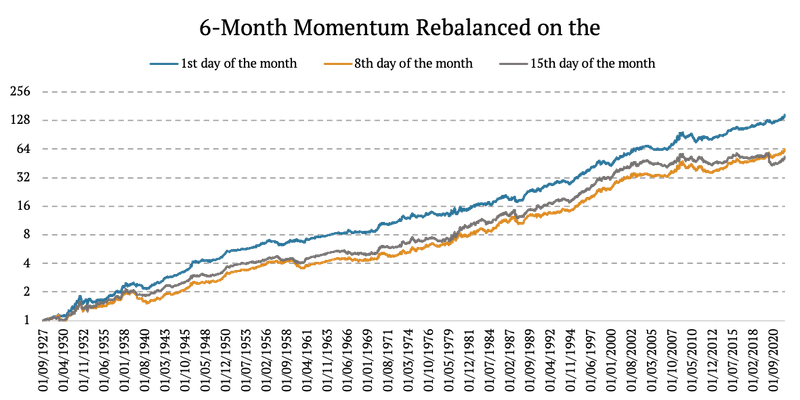
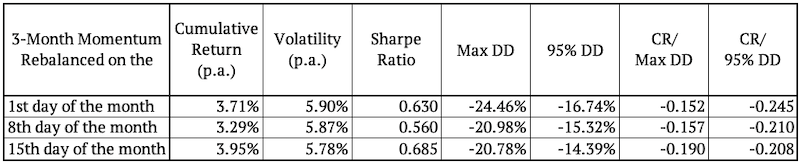
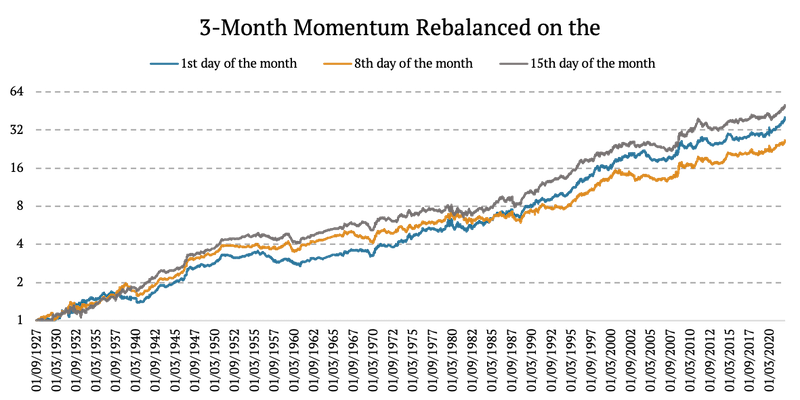
As mentioned above, the trend-following strategy exploits momentum to gain exposure to an asset only at the time when there is a higher probability of its outperformance. We created nine variations of trend-following strategies. Three of them used 12-month momentum, three used 6-month momentum, and three used 3-month momentum.
Each month we looked at the 12- (/6- /3-) month momentum of each asset (bonds, stocks, commodities) and went long if it was positive or short if it was negative. Lastly, we weighed each asset according to the weights we calculated based on the previous section (naïve risk parity).
Rebalancing
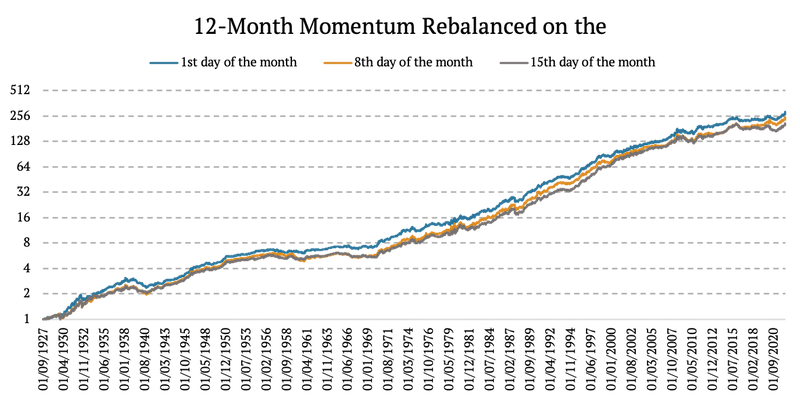
As we already stated, we created nine strategies. All strategies were rebalanced on a monthly basis. However, to avoid the so called “timing luck bias”, each strategy was rebalanced on a different day. We utilized 3-different rebalancing points during the month, thus arriving at 3×3 = 9 different substrategies.
Thus, of the three strategies that used 12-month (/6-month/ 3month) momentum, one was rebalanced on the first trading day of every month, the second on the eighth trading day of every month, and the third was rebalanced on the fifteenth trading day of every month.
Note, that the weights were always calculated on the first trading day of each month.
100-year daily backtest results of Substrategies
Below we present the results for the 3×3 sub-strategies, broken down by momentum horizons and rebalancing points. As expected, strategies are pretty similar to each other, indicating little to no overfitting.
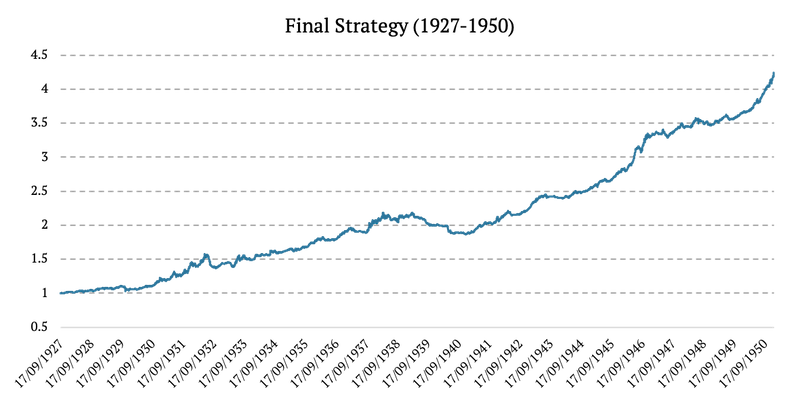
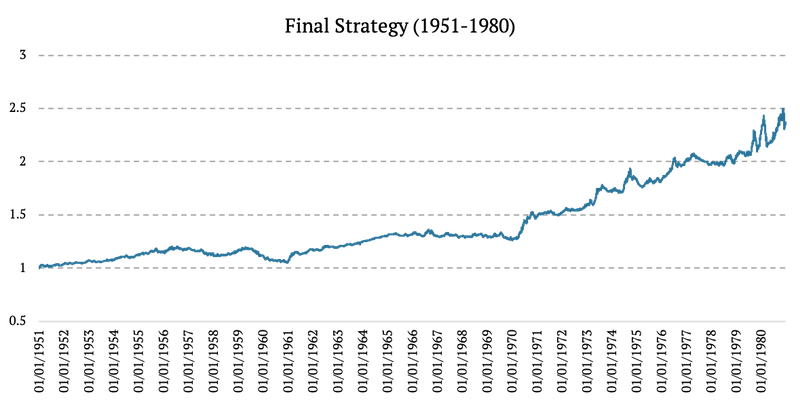
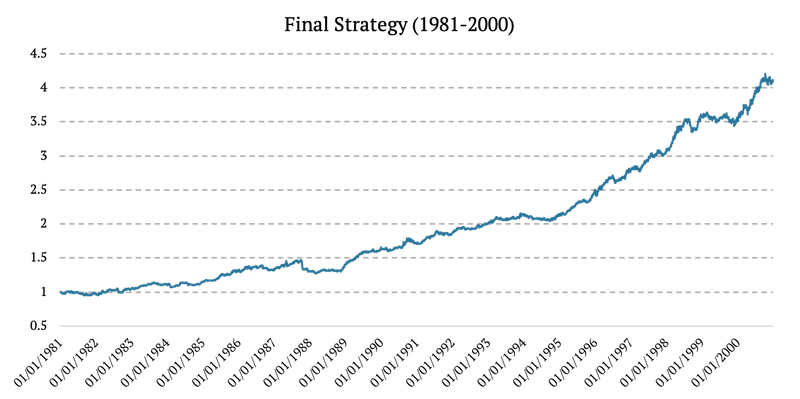
Performance of 100-years of trend following
Finally, we created our final, blended, multi-asset trend-following strategy by equally weighting the nine sub-strategies. We may indeed observe, as they say, that the whole is greater than the sum of its parts. At least when it comes to risk-adjusted performance.
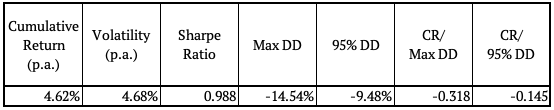
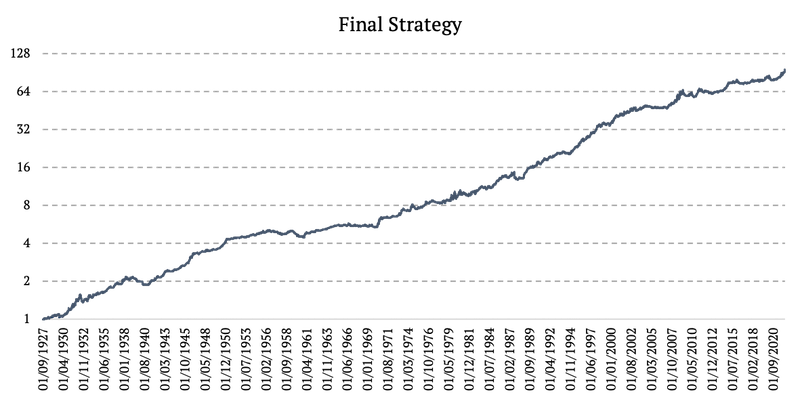
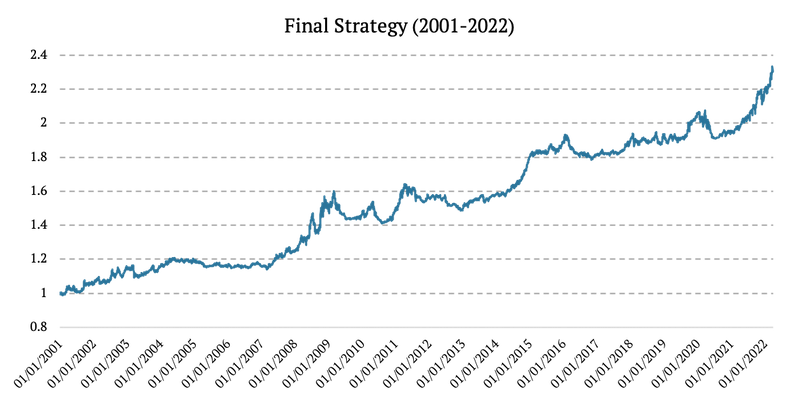
Additionally, we present four figures showing the final strategy in various time frames: 1926-1950, 1951-1980, 1981-2000, and 2001-2022.
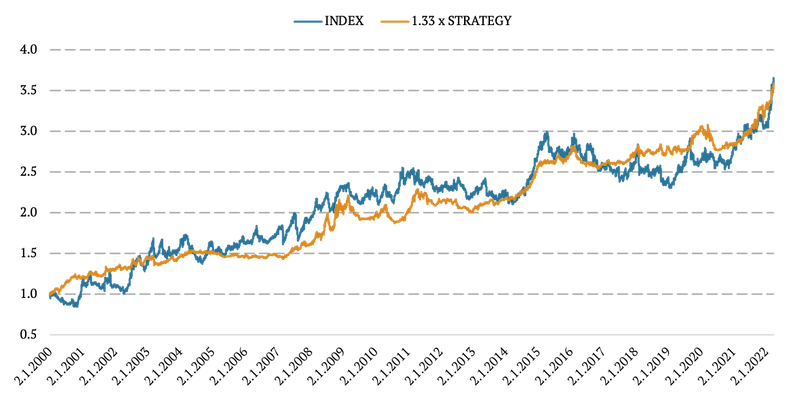
And lastly, we present the comparison of our multi-asset trend-following strategy with the benchmark index for trend-following, chosen as SG Trend Index. Since this index has a much higher volatility compared to our strategy, we adjusted volatility of our trend-following strategy upwards (i.e. levered the strategy) to roughly match the cumulative performance of an index. We can see that our proxy for multi-asset trend-following strategy is a good one:
Conclusion
In today’s article, we successfully backtested a simple trend-following strategy since 1927, 100 years back into history, all with daily data. We used Quantpedia’s framework for extending daily data series and tested the momentum trading signals on our extended 100-year daily history.
All of the data series, frameworks and tools presented today or in our past articles will be made available to Quantpedia Pro subscribers in the next few months in specialized reports. We will also continue to build upon our framework and bring you more useful insights in the near future. So stay tuned.
Author:
Daniela Hanicova, Quant Analyst, Quantpedia
Are you looking for more strategies to read about? Sign up for our newsletter or visit our Blog or Screener.
Do you want to learn more about Quantpedia Premium service? Check how Quantpedia works, our mission and Premium pricing offer.
Do you want to learn more about Quantpedia Pro service? Check its description, watch videos, review reporting capabilities and visit our pricing offer.
Do you want algorithmic access to the full Quantpedia database via the API? Subscribe to Quantpedia Pro, ask for an API key, and explore the in/out-of-sample statistics, source academic papers, and code snippets — ideal for quantitative research, systematic trading workflows, and AI model training.
Are you looking for historical data or backtesting platforms? Check our list of Algo Trading Discounts.
Or follow us on:
Facebook Group, Facebook Page, Telegram, Twitter, Linkedin, Medium or Youtube
Share onLinkedInTwitterFacebookRefer to a friend


