160 Years of Wars and Disasters in Markets
Life is not always rosy; many tragedies and unexpected events hurt individuals and society. While some are hardly avoidable, such as natural disasters, some others as wars, are generally only functions of hate and greed. In the case of predictable events, risk measures can be employed, but unexpected outbreaks of aggression can hardly be hedged across the spectrum of different financial assets. We had previously touched on a similar topic and looked at some historical geopolitical shocks and price reactions around that time.
Now, we would like to do a short review of an interesting 140-page paper by Dat Mai and Kuntara Pukthuanthong (2022), which, while not providing actionable strategy, provides insightful retrospection and takes war topic modeling to the higher level, covering developing narratives and influence factors extensively. The main finding can be summarised simply: War positively predicts market return in- and out-of-sample, while the economic narratives only predict in-sample. Can the old-time Rothschild’s adage, “the time to buy is when there’s blood in the streets,” be quantified?
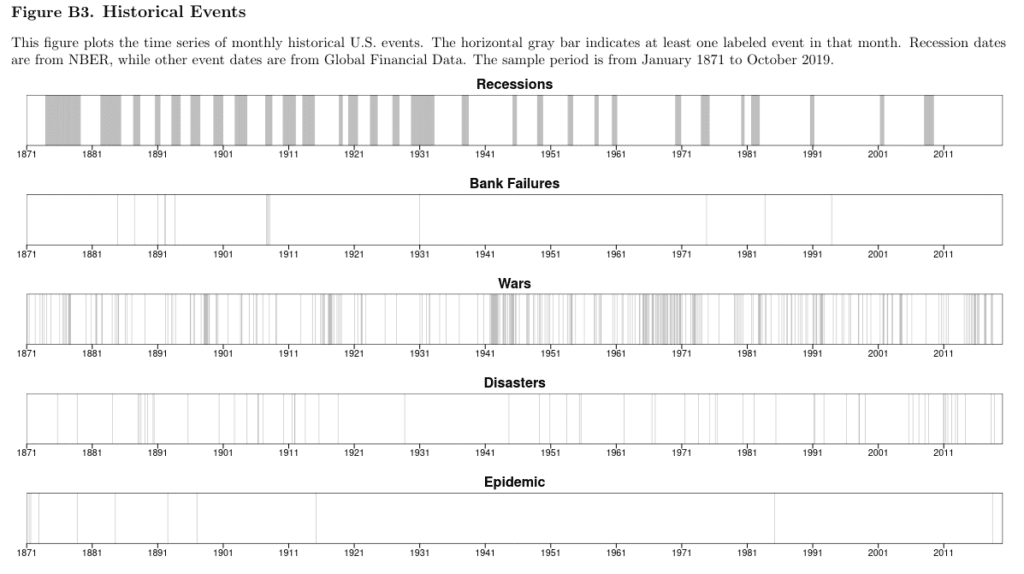
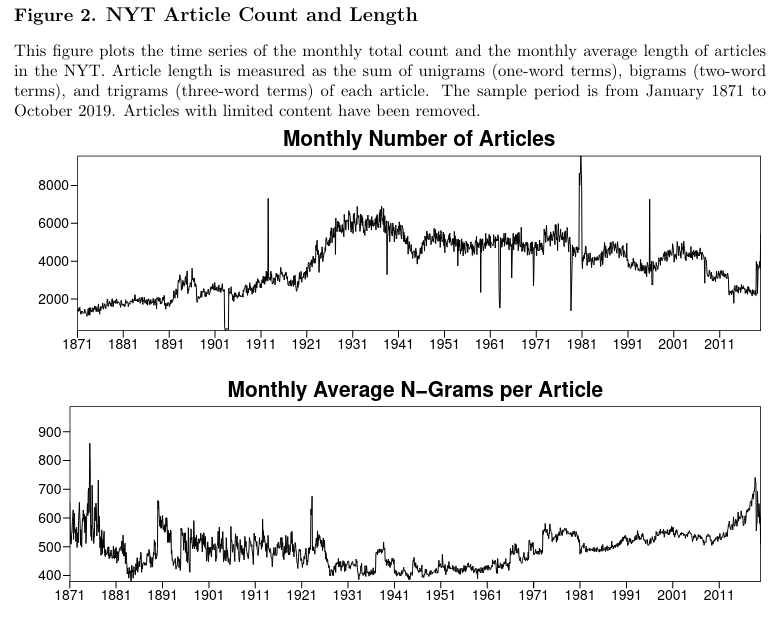
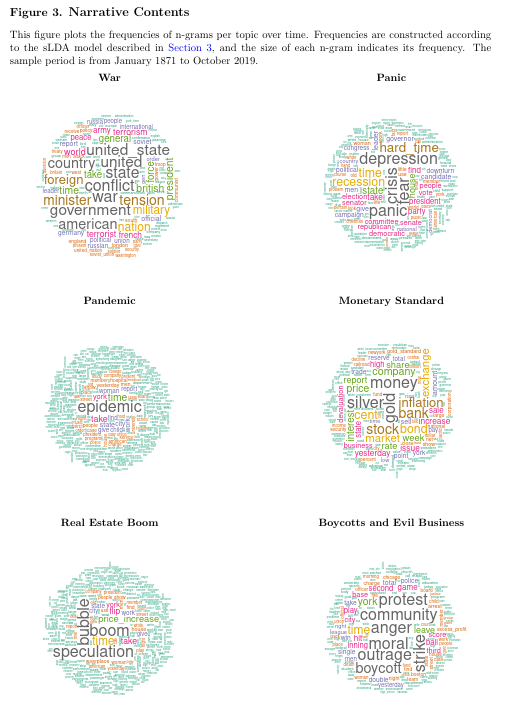
Scientists used an advanced natural language processing tool called sLDA to extract stories as they developed from nearly seven million New York Times articles over the past 160 years. “War” keyword topic narrative (see Figure 3 included just below) can positively predict excess market returns and is consistent with the literature on rare disaster risks, in which wars are also included. As probability is expected to rise during panicked and stressful times, an increase in “War” is associated with a rise in the equity premium. Similar results are also found from robustness analysis using the WSJ data sample. What about some specifics in different asset classes?
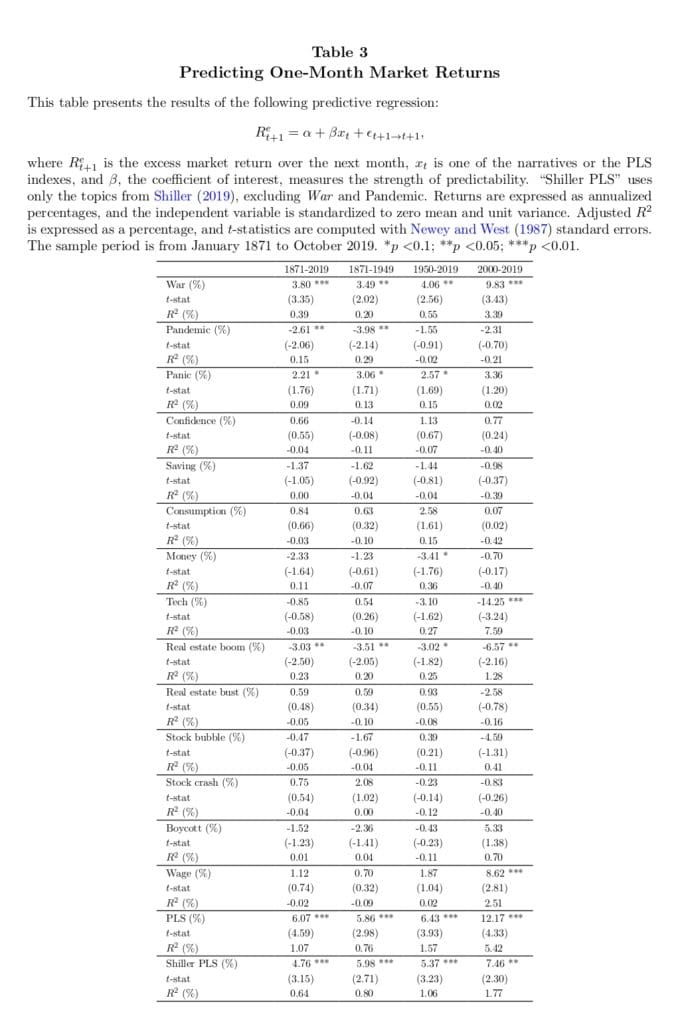
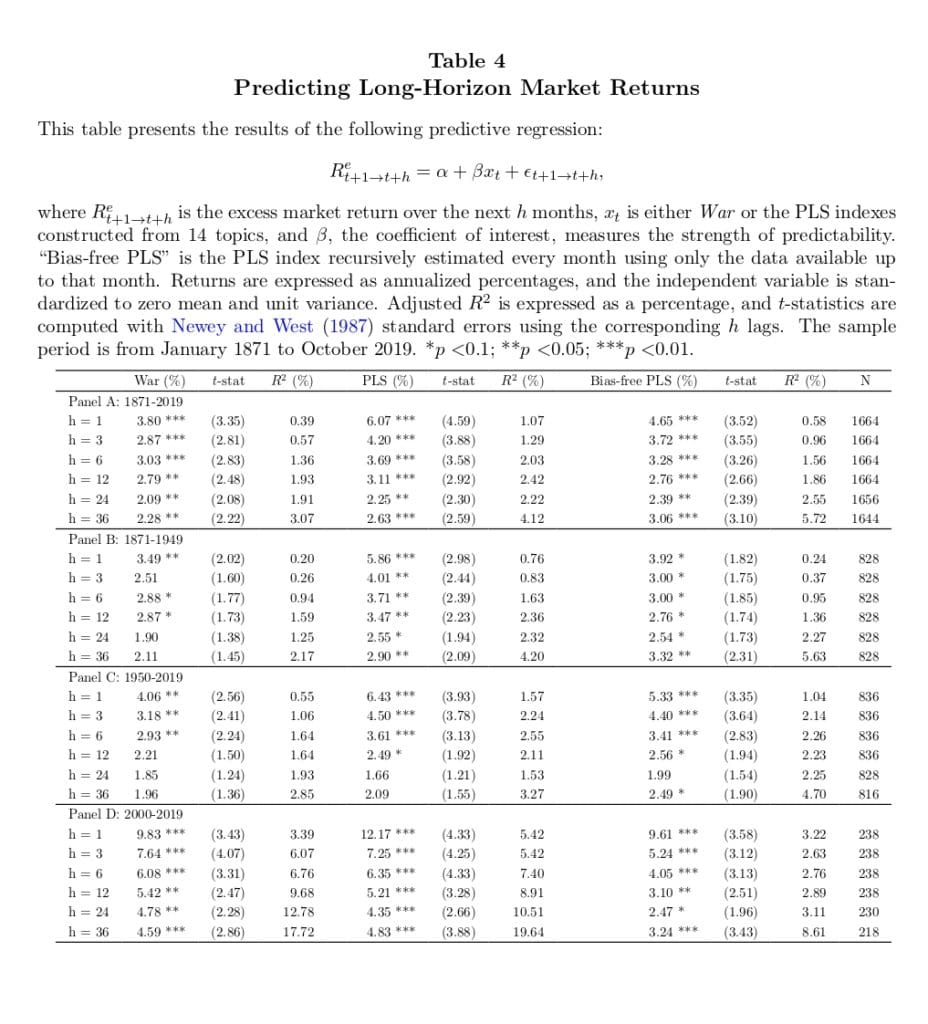
It is found that disaster risk increases the excess returns on mid- to long-term high-yield corporate bonds. In contrast, “War” negatively predicts excess returns on safer investment instruments such as short-term government bonds and investment-grade corporate bonds. At the cross-sections, evidence also supports the prediction that resilient equities or equities that provide good returns during high-risk periods of disasters require lower returns to compensate for the risk. And finally, what about the whole stock market? Over 160 years, a one-standard-deviation increase in “War” predicts a 3.80% increase in annualized excess returns in the next month; over the past 20 years, the respective number is 9.83%. The research’s R2 suggests that the predictive power of War is statistically and economically significant for stock market returns.
Authors: Dat Mai and Kuntara Pukthuanthong
Title: War Risk: Time Series and Cross-sectional Evidence from the Stock and Bond Markets
Link: https://papers.ssrn.com/sol3/papers.cfm?abstract_id=4190811
Abstract:
We employ a semi-supervised topic model to extract the rare disaster risks and economic narratives from 7,000,000 NYT articles over 160 years. Our approach addresses the look-ahead bias and changes in semantics. War positively predicts market return in- and out-of-sample, while the economic narratives only predict in-sample. The predictability of War increases over time and is robust when extracted from WSJ. War as a solo factor prices characteristics-sorted portfolios with a negative risk premium and outperform some multifactor benchmarks when pricing machine learning-based nonlinear portfolios with an R2 of 54%. Our study lends support to the time-varying disaster risk model.
As always, we present several interesting figures and tables:
Notable quotations from the academic research paper:
“Our sample comprises nearly seven million articles in NYT and six hundred thousand articles from WSJ; thus, the computation costs and time to process this data size are prohibitive and almost impossible. To our knowledge, we are the first paper that analyzes news articles from all newspaper sections of NYT since the beginning of its inception; therefore, it helps us affirm our conclusion on how the economic and non-economic narratives move the market at both time series and cross-sections.
Among the narratives extracted from the NYT, we find the most important one is War.6 In tracking the articles making the most significant contribution to War over the past 30 years, we find that all of them feature wars, terrorism, and tensions in international relations. According to the time-varying disaster model, expected market excess returns should increase with the probability of rare disasters. Our results corroborate the theory. War strongly positively predicts market returns. The predicting power of War over the equity risk premium increases over time. Over 160 years, a one-standard deviation increase in War predicts a 3.80% increase in annualized excess returns in the next month, and the monthly in-sample R2 is 0.39%. In comparison, over the past 20 years, the respective numbers are 9.83% and 3.39%. War is significant for both subperiods (1871–1949 and 1950–2019). As a benchmark, the average R2 of the 40 well-known predictors is only 0.73% in-sample and -1.01% out-of-sample (see Goyal et al. (2021)). Our R2 suggests that the predictive power of War is statistically and economically significant.
We also find that the perception of rare disaster risk predicts bonds’ excess returns. Gabaix (2012) asserts that the higher the disaster risk, the higher the premium on long-term bonds. Our evidence is in line with his prediction. We find that the higher the disaster risk, the higher the excess returns on mid- to long-term high-yield corporate bonds. In contrast, War negatively predicts excess returns on safer investment instruments such as short-term government bonds and investment-grade corporate bonds.
Turning to asset allocation implications, we consider a mean-variance investor who allocates his portfolio between stocks and a risk-free asset using either the return predictive model or the historical mean return to guide the portfolio weights. Using Waralone or a combination of narratives to guide our portfolio decisions allows us to achieve a higher Sharpe ratio than a simple buy-and-hold strategy. With a risk aversion coefficient of three, we find the economic gains for the investor utilizing narratives in forming his portfolios increase over time, consistent with the R2OS results.
Table 3 reports the regression results. Over the whole sample of 1871–2019, among the 14 narratives, War is a strong positive predictor, with the coefficient being statistically significant at the 1% level. Economically, a one-standard-deviation increase in War is associated with a 3.8% increase in the annualized excess return in the next month. In addition to the full sample analysis, we also run predictive regressions over two subperiods for the last two decades. This approach serves two purposes: First, we want to address concerns about text quality in the earlier sample. Second, the last two decades present a unique period. Internet usage and the use of technology in diffusing information significantly changed after the year 2000, and how they will affect financial markets and society in the future is still unclear. In addition, the results during this period are probably the most relevant for the future, as emphasized in Goyal and Welch (2008). Accordingly, the positive association between War and future market returns remains in both subperiods with significance at 5% levels. Notably, War yields an impressive forecasting power over the past two decades with a coefficient of 9.8%, significant at the 1% level, and an in-sample R2 of 3.4%.
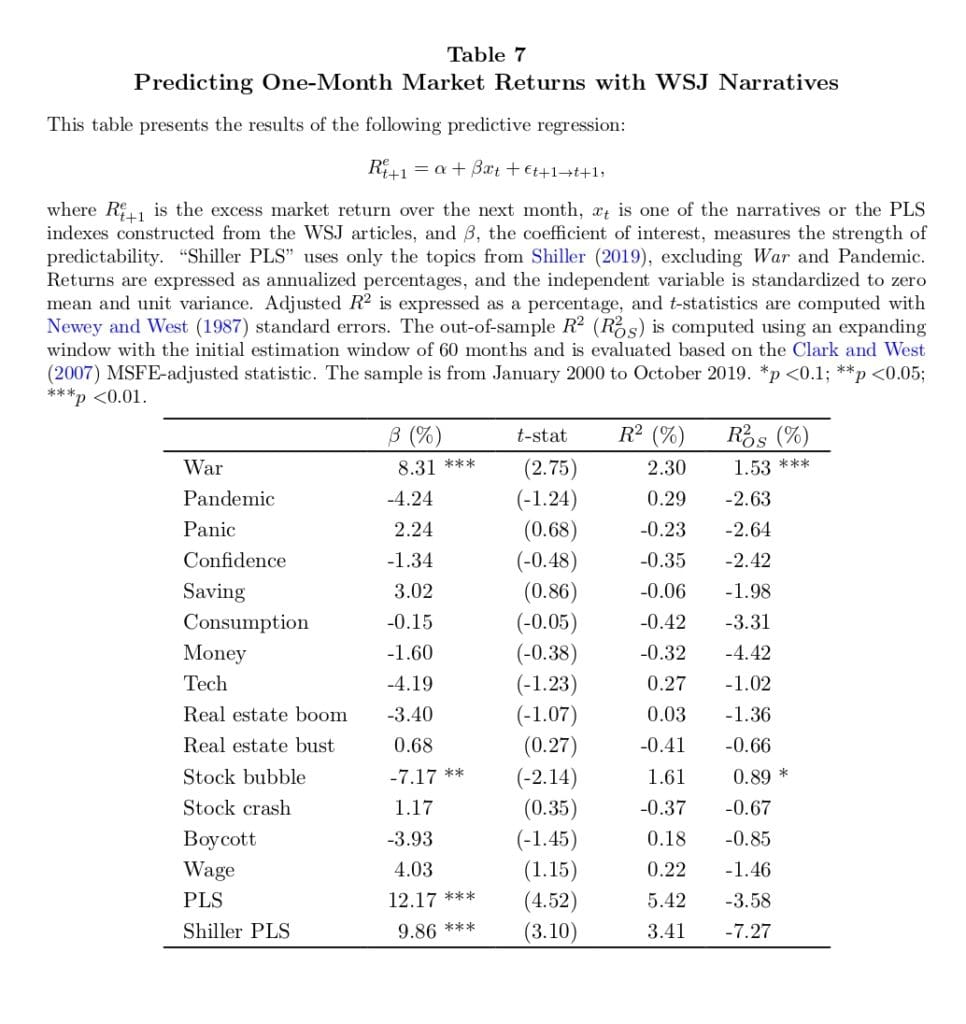
Table 7 reports results in predicting the excess market returns one month ahead using all WSJ narratives. Consistent with the NYT results, War constructed from WSJ is a strongly positive market predictor over 2000-2019, significant at 1%. Specifically, a one standard deviation increase in War attention is associated with an 8.3% annualized increase in market returns next month. Its R2OS , constructed in an expanding window fashion with an initial 60-month training period, is 1.53% (also significant at 1%). Besides War, Stock Bubble also shows significant prediction results (at 5%), although it is a negative predictor. Its R2OS is 0.89%, significant at 10%.
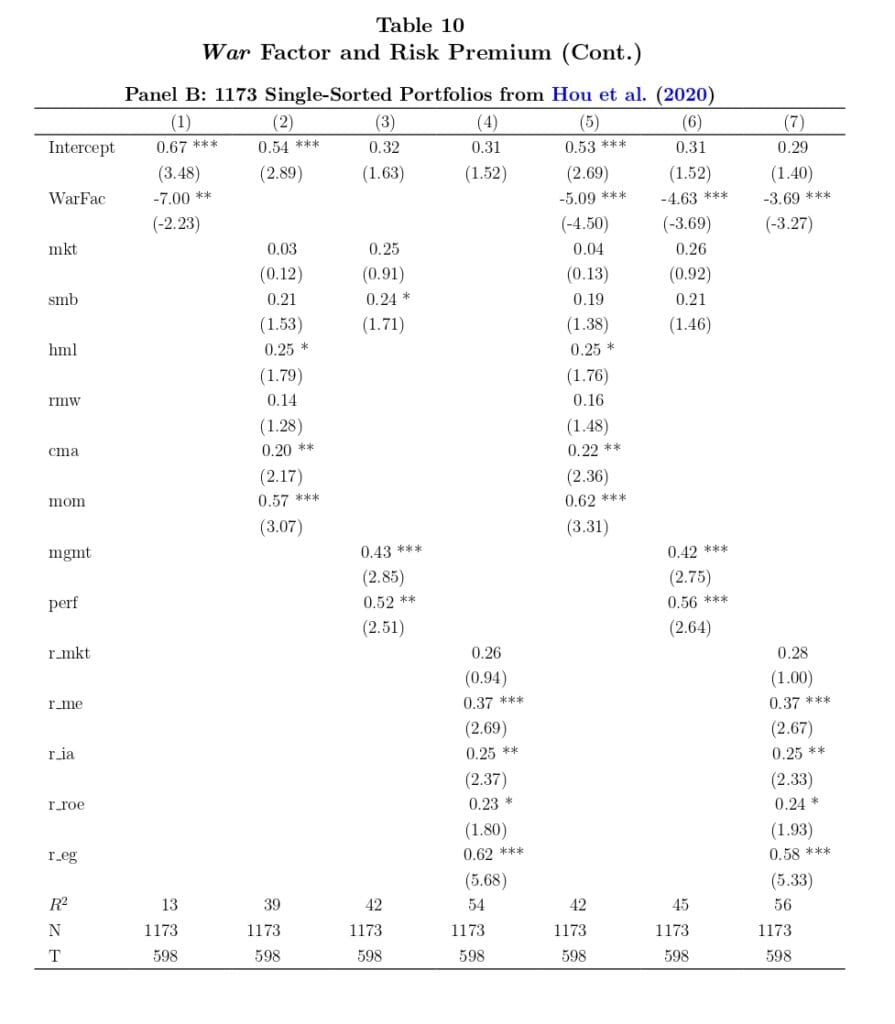
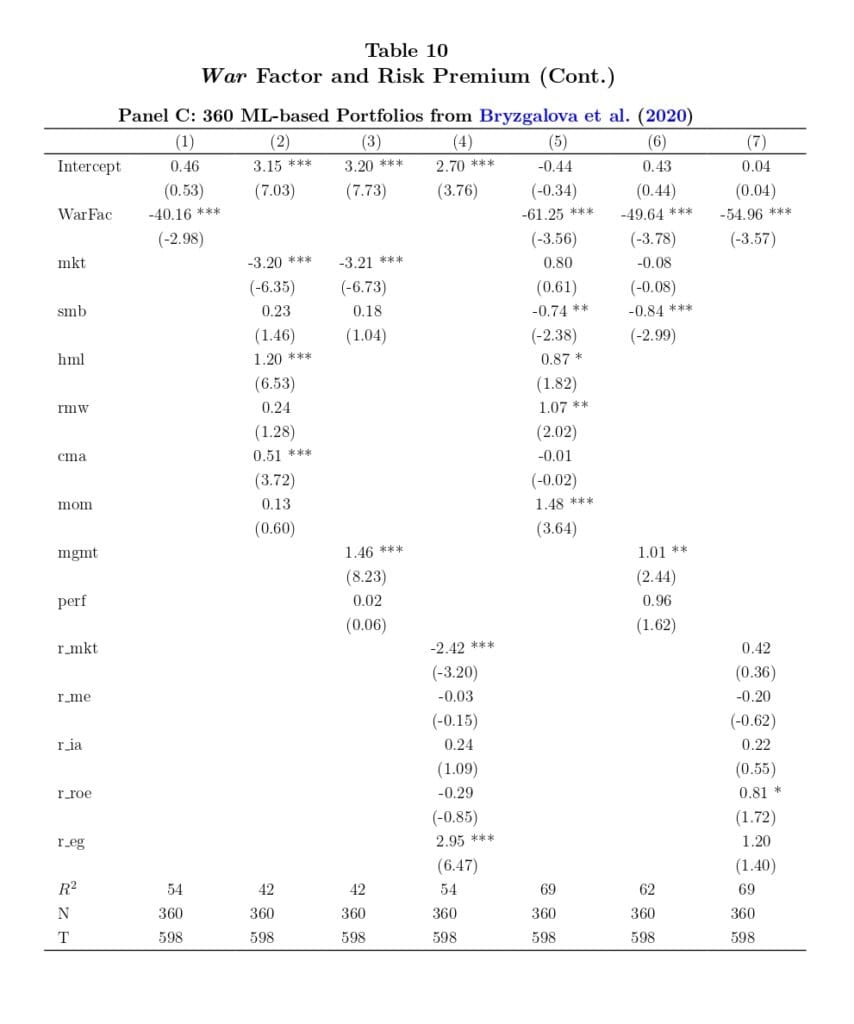
We now analyze the cross-sections individually to see more precisely how WarFact fares on each set of test assets. We start with the HXZ’s 118 anomalies as testing assets in panel A of Table 10. As comparisons, we also consider FF6, M4, and Q5. These factor models constitute the relevant benchmark factors to price the cross-sections considered. Starting in the first column with WarFact as War factor, its price of War risk is strongly significant at 1% (t-stat of |2.93|) and negative. Its monthly risk premium is -15.68%. Note that as our WarFact has a monthly standard deviation of 13.6%, its first-stage betas are much smaller than those produced by traded factors. As a result, its price of risk is much larger than the other traded factors. The negative sign implies assets providing high returns during high War risk periods perform as hedging assets; thus, they command a lower risk premium.”
Are you looking for more strategies to read about? Sign up for our newsletter or visit our Blog or Screener.
Do you want to learn more about Quantpedia Premium service? Check how Quantpedia works, our mission and Premium pricing offer.
Do you want to learn more about Quantpedia Pro service? Check its description, watch videos, review reporting capabilities and visit our pricing offer.
Do you want algorithmic access to the full Quantpedia database via the API? Subscribe to Quantpedia Pro, ask for an API key, and explore the in/out-of-sample statistics, source academic papers, and code snippets — ideal for quantitative research, systematic trading workflows, and AI model training.
Are you looking for historical data or backtesting platforms? Check our list of Algo Trading Discounts.
Or follow us on:
Facebook Group, Facebook Page, Telegram, Twitter, Linkedin, Medium or Youtube
Share onLinkedInTwitterFacebookRefer to a friend


