Extending Historical Daily Commodities Data to 100 Years
100 Years of Daily Data
Finding a high-quality data source is crucial for quantitative trading strategies. Also, having a long history is beneficial. Fama & French, for example, offer free historical data for stocks and a variety of factors. However, it is very hard to get good-quality and free data for other asset classes. For this reason, we have already examined how to extend historical daily bond data to 100 years.
For any event-driven analysis or to perform stress tests of various historical situations, long-enough data can only help. Whether one wants to analyze past market patterns, or simply examine the risk of their portfolio under different historical scenarios, the use case for long data is pretty straightforward.
Following the theme of our previous article, we decided to extend historical data of another asset class, commodities. This article explains our commodity data methodology and introduces data sources, which helped us extend historical daily commodities data to 100 years.
Commodity data and data sources
To create the 100-year daily history of commodities, we combined multiple data sources:
1926 – 1979: Monthly PPI (Producer Price Index by Commodity: All Commodities)
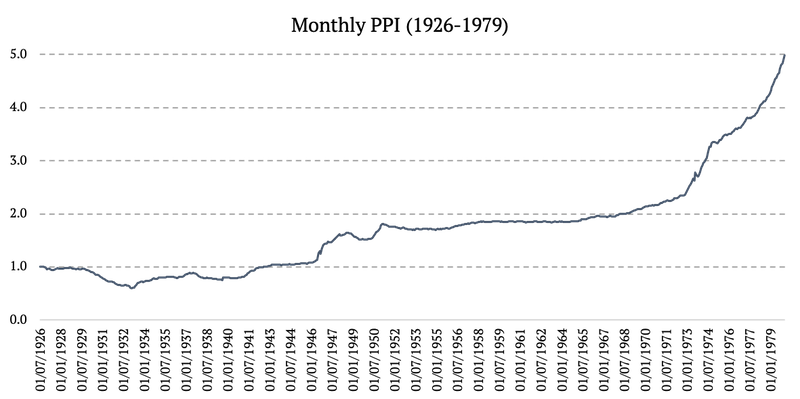
Source: https://fred.stlouisfed.org
1980 – 2006: S&P GSCI Commodity Total Return (SPGSCITR)
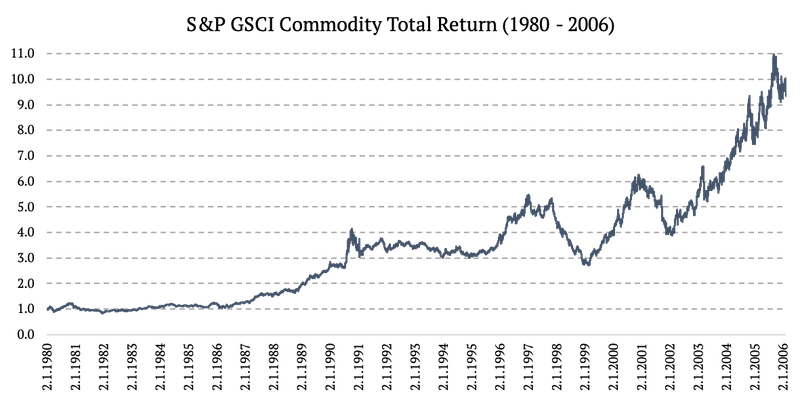
Source: https://www.investing.com
2006 – 2022: DBC ETF (Invesco DB Commodity Index Tracking Fund)
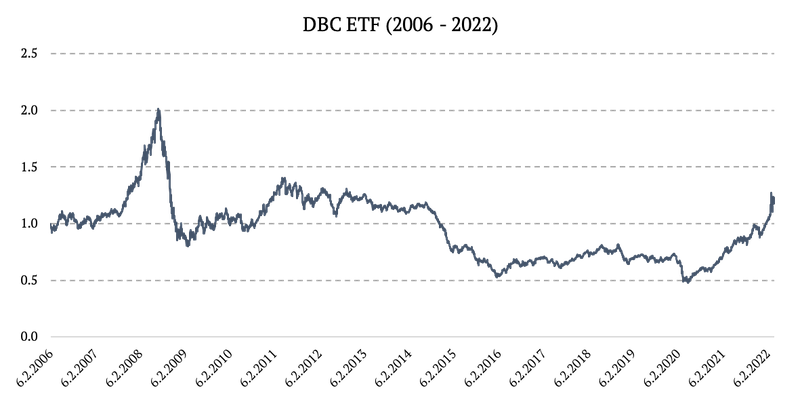
Source: https://finance.yahoo.com
How to Model Historical Commodity Data
Ideally, one would have a Commodity ETF data or a Commodity Index data available. That’s exactly what we have available since 1980. That being said, there are no freely available daily commodity data before 1980. Thus, we had to find some proxy for the price of commodities.
Producer Price Indexes (PPIs) measure changes in prices from a seller’s perspective. PPIs are available for a variety of products from almost any industry, including commodities and for quite a long data history. For this reason, we used PPIACO (Producer Price Index by Commodity: All Commodities) as our commodity proxy from 1926 to 1979.
PPI is a good proxy, but not perfect. We can immediately observe some flaws, like probably a too low beta to traditional commodity indices or a too smooth curve, i.e. lacking any volatility. However, both of these flaws we are able to fix.
Beta Adjustment
Firstly, we adjusted the PPI index to account for the correct commodity prices beta. We measured the beta of the PPI to commodity price index on newer history. The commodity price index is publicly available for free only since 1980, thus we had to perform the beta adjustment for the entire period 1926-1980.
Our calculated beta of PPI to Commodity index was around 1/3. This means, we had to adjust PPI by the multiple of 3 to arrive at the commodity beta. We then simply multiplied the daily change of PPIACO by 3 to obtain a more accurate commodity proxy.
Transforming Monthly Data into Daily Data
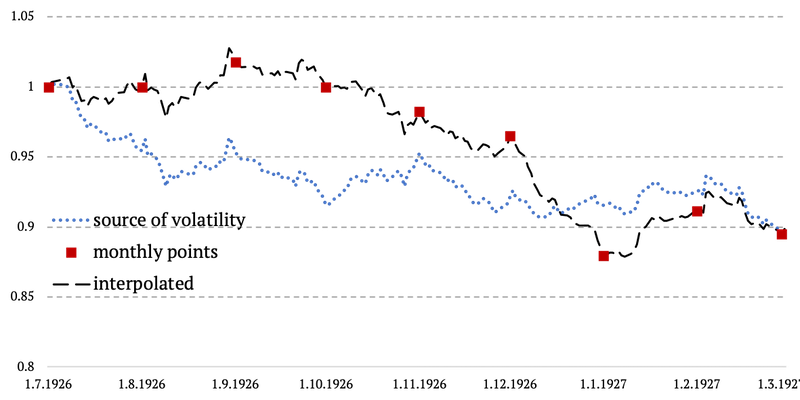
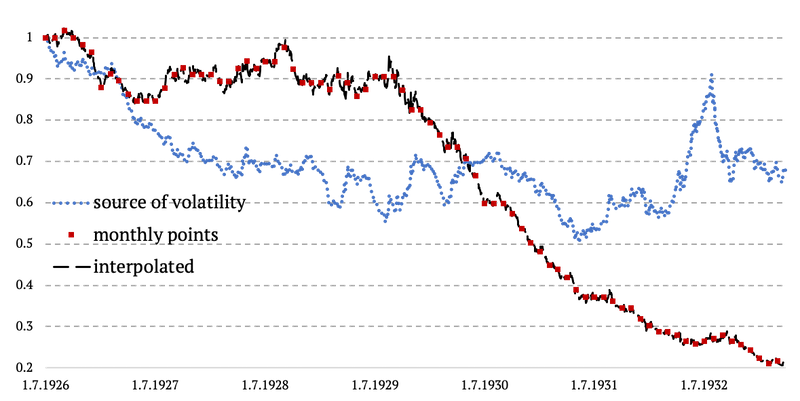
As mentioned above, the second flaw in our data is the lack of volatility. This is primarily caused by the PPI being published only on a monthly frequency. We already explained our methodology of creating daily volatility for monthly data in our recent article. We called it the Volatility Proxy Extrapolation. In very simple words – we take the volatility from the good proxy and apply it in between monthly data points of the original monthly data series (PPI in our case).
Commodity volatility proxy
It’s not that straightforward and easy to find a viable proxy for daily commodity volatility before 1980. However, observing the recent commodity behavior and also taking into account a composition of commodity indices in the past (heavily weighted towards Energy), we do assume that a good proxy for commodity volatility is the equity Energy sector. More precisely, an excess return of the Energy sector vs entire Market.
Thus, firstly, we calculated the spread of the Energy sector (from F&F 12 Industry Portfolios) against the market (from F&F 3 Factor). This is our daily commodity volatility proxy.
How to create a daily volatility for monthly data
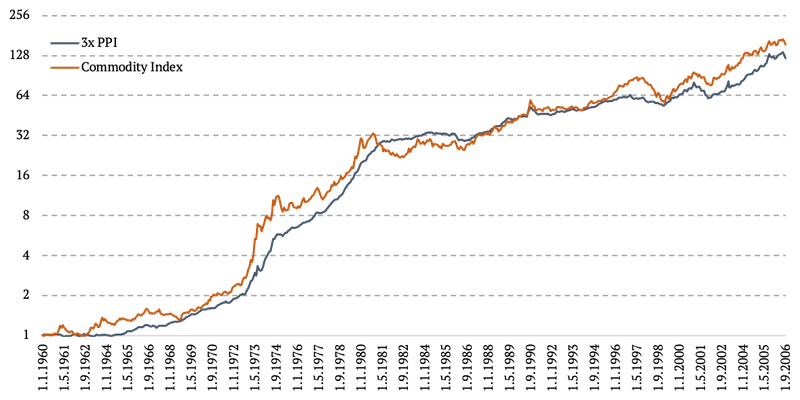
After calculating the Energy sector spread, we then followed our methodology outlined in Extending Historical Daily Bond Data to 100 Years. We calculated the monthly cumulative difference of the spread, subtracted it from the monthly cumulative difference of 3x PPI and divided it by the number of trading days in the respective month. Thus, getting the daily volatility. The last step was to calculate the cumulative daily return of the commodities.
The methodology is probably easily understood by the simple chart below. We basically copy the daily volatility from the Energy – Market spread and plug it in between two monthly data points of 3x PPI. And we ensure there are no jumps or gaps in data and that everything happens in a linear fashion. See the chart below.
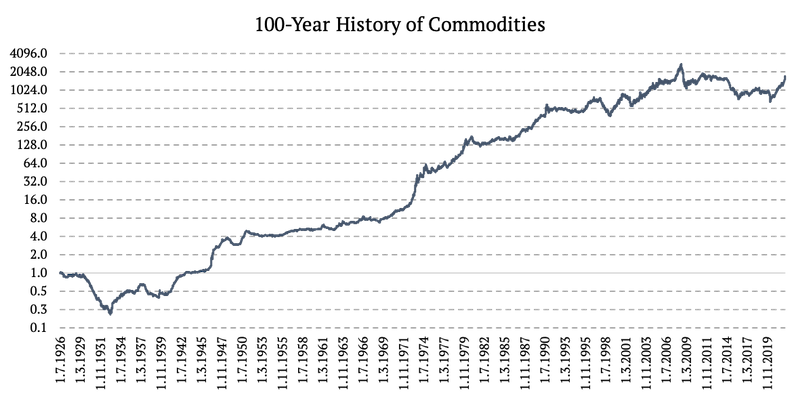
Combining Various Commodity Data Sources
Now that we successfully created daily data series from 1926 to 1979, we need to take one last step. We finally combined the three periods of different calculations and data sources into one time series:
- 1926 – 1979: Volatility proxy extrapolated daily return,
- 1980 – 2006: S&P GSCI Commodity Total Return (SPGSCITR),
- 2006 – 2022: DBC ETF (Invesco DB Commodity Index Tracking Fund).
The figure below uses the log2 y-axis.
Are you looking for more strategies to read about? Sign up for our newsletter or visit our Blog or Screener.
Do you want to learn more about Quantpedia Premium service? Check how Quantpedia works, our mission and Premium pricing offer.
Do you want to learn more about Quantpedia Pro service? Check its description, watch videos, review reporting capabilities and visit our pricing offer.
Are you looking for historical data or backtesting platforms? Check our list of Algo Trading Discounts.
Would you like free access to our services? Then, open an account with Lightspeed and enjoy one year of Quantpedia Premium at no cost.
Or follow us on:
Facebook Group, Facebook Page, Twitter, Linkedin, Medium or Youtube
Share onLinkedInTwitterFacebookRefer to a friend


