In this article, we explore the historical performance of sector momentum strategies and examine how their alpha has diminished over time. By analyzing the underlying causes behind this decline, we identify key factors contributing to the underperformance. Most importantly, we introduce an enhanced approach to sector momentum, demonstrating how this solution significantly improves the performance of an ETF sector momentum strategy, making it once again an effective tool for systematic investors.
Introduction
Sector momentum is an investment strategy that aims to capitalize on the continued performance of specific market sectors by focusing on those with recent strong returns, under the assumption that this momentum will persist. In this article, we explore sector momentum specifically within the context of ETFs. We have previously examined similar strategies in Sector Momentum – Rotational System and Industry Momentum – Riding Industry Bubbles, where we concentrated on long-only strategies. While the alpha of the sector momentum strategies was interesting in the past, the high correlation between sectors and increased market efficiency that came with the introduction of ETFs as investment vehicles diminished the performance of the traditional long-short sector momentum. We addressed a similar challenge in Robustness Testing of Country and Asset ETF Momentum Strategies. Our goal in this study is to improve sector momentum strategies, whether through long-short or long-only approaches, aiming to enhance overall performance despite these difficulties. We addressed a similar issue of improving momentum strategies for commodities in How to Improve Commodity Momentum Using Intra-Market Correlation article.
In this study, we utilise a dataset comprising the 9 sectors of the S&P 500 index (ETFs) for all analyses. These sectors include XLB (materials), XLE (energy), XLF (financials), XLI (industrials), XLK (technology), XLP (consumer staples), XLU (utilities), XLV (health care), XLY (consumer discretionary). All of these ETFs are adjusted for dividends and splits, meaning that historical prices have been modified to reflect dividend payouts and stock splits. This adjustment provides a more accurate representation of the ETF’s performance over time by accounting for total returns, including reinvested dividends, and by correcting for price changes due to splits. Using these adjusted prices is crucial for precise historical performance analysis and strategy comparison. The data were sourced from Yahoo Finance and represent the daily adjusted closing prices of the given ETF, covering the period from December 22, 1998 to September 5, 2024.
Recently, Yahoo Finance discontinued free end-of-day data downloads. As a result, we recommend sourcing data from our preferred provider, EODHD.com – the sponsor of our blog. EODHD offers seamless access to +30 years of historical prices and fundamental data for stocks, ETFs, forex, and cryptocurrencies across 60+ exchanges, available via API or no-code add-ons for Excel and Google Sheets. As a special offer, our blog readers can enjoy an exclusive 30% discount on premium EODHD plans.
Additionally, it’s important to clarify that in this study, the notation “S&P 500” refers to the SPY ETF (SPDR S&P 500 ETF Trust), which is also adjusted for dividends and splits. This exchange-traded fund replicates the performance of the S&P 500 index, while the adjustments account for dividends and stocks splits. We use this data as a benchmark for comparison.
In every table perf stands for yearly performance (return), st dev represents yearly standard deviation, max dd means maximal drawdown, Sharpe ratio is calculated as a return to a volatility and Calmar ratio as a negative return to a maximal drawdown.
In this research, we calculate the momentum of the ETFs based on the adjusted monthly prices of each individual ETF. For each month, we sort all 9 ETF momentum values from highest to lowest. We then select an optional number of ETFs to go short (those with lowest momentum value) and an optional number to go long (those with the highest momentum value).
Step 1 – Benchmark
In the first step we focus on two benchmarks for our research for comparison of effectiveness of the following tested strategies. For this purpose, we created an equally-weighted (EW) benchmark consisting of all 9 ETFs, monthly rebalanced, and than we compared it to the S&P 500 index.
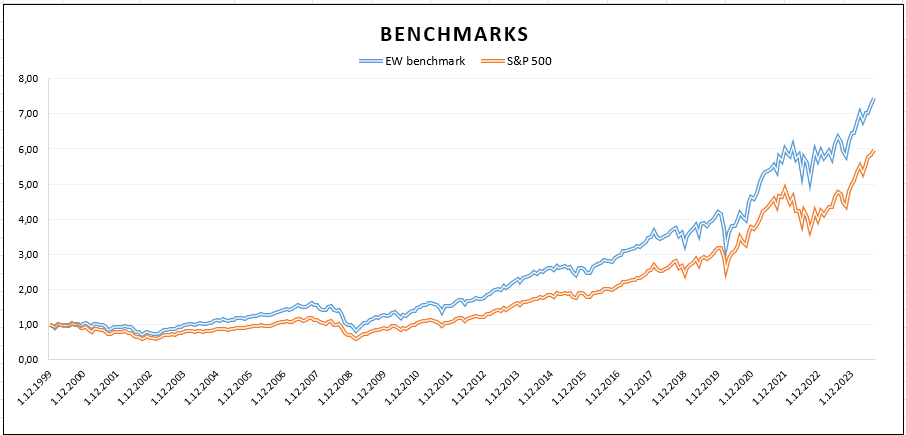
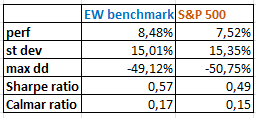
The graph in Figure 1 clearly demonstrates that the equally weighted (EW) benchmark outperforms the S&P 500 index over the period from 1999 to 2023. The effectiveness of the EW benchmark is further supported by the Sharpe ratio and Calmar ratio presented in Table 1.
Step 2 – Long/short momentum strategy
Secondly, we wanted to assess how effective long/short momentum strategies can be on S&P 500 sectors. We selected 3 worst ETFs to go short and 3 best to go long, based on their momentum. For this analysis, we will consider a 12-month momentum ranking period and 1-month holding period.
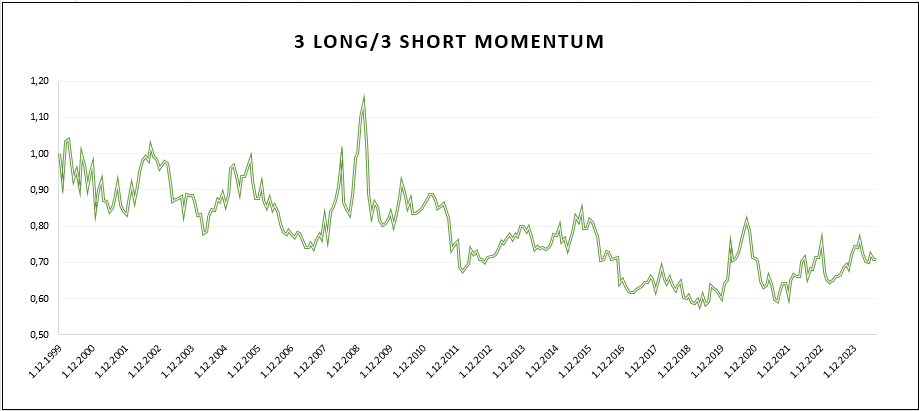
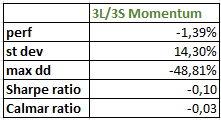
The 3 long/3 short momentum strategy has shown poor performance, characterized by negative returns and high drawdowns, resulting in unfavorable ratios values. The curve of the graph exhibits an unstable evolution with a declinig tendency, reflecting inefficiency. The only positive aspect of this strategy is the visible positive performance during market crisis, which indicate some hedging properties.
Additionally, we gradually adjusted the ranking period, ranging from 1 month to 12 months, and varied the number of assets on long/short sides (4v4, 3v3, 2v2, 1v1). Unfortunately, these changes did not yield any beneficial results.
Step 3 – Separation of the long/short momentum legs
Next, we decided to separate the long/short momentum into a long-only momentum strategy and a short-only momentum strategy.
Long-only momentum strategy
When we focused on long-only strategy, we decided to set 12-month ranking period for momentum (and 1-month holding/rebalancing period), as it is a widely used period in most academic papers. We applied this ranking period in every strategy case, selecting 1 sector with the best monthly momentum (1 Long), 2 sectors with the best momentum (2 Long), and continued this process until we selected 6 sectors with the best momentum (6 Long).
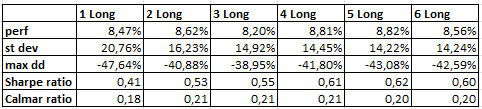
Considering primarily the Sharpe ratio results, long-only momentum strategy shows promising potential, especially when selecting 4 or more sectors to go long.
Short-only momentum strategy
Similar to the long-only strategy, we also set 12-months ranking period and select 1 (1 Short), 2 (2 Short), …, up to 6 (6 Short) sectors to go short, based on the worst monthly momentum, and then calculate their performance characteristics.
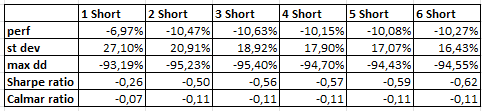
Based on the performance results of each strategy, we can conclude that the strategy involving the 1 worst momentum sector yields the best results, even though they are still negative. However, the surprising fact is that short-only momentum strategy that selects 1 ETF doesn’t have as negative return as other variants, because -7% performance is significantly better than -10% performance.
Then, we had a spark of inspiration—what if we used an asymmetrical long-short momentum strategy that picks different numbers of assets in the long leg than in the short leg? And what if the short-leg (hedging leg) didn’t have the same weight as the long leg? We do not need to hedge 100% of the long momentum leg by short momentum leg—it may be enough to short just a little and increase the performance of the overall long-short momentum by decreasing the beta exposure of the long leg by hedging with (relatively) cheap short leg.
Therefore, the conclusion is that the long-only momentum strategy is more effective when it includes 4, 5, or 6 sectors, whereas the short-only momentum strategy achieves the most suitable results by utilizing only 1 sector. Plus, we will analyze strategies that don’t short the same percentage of the portfolio as they go long.
Step 4 – Combination of the momentum and short strategy
Considering the results of the long-only and short-only momentum strategies (introduced in the Step 3), we decided to combine the long-only strategy with a selective hedge, where the short-strategy is not set with 100% weight, but only 5% to 30%. While working with this strategy, it is necessary to keep the shorting costs in mind. We assume they are approximately at the level of the 3-month interest rate.
We decided to implement a momentum + short strategy, utilizing 4, 5, or 6 sectors in the long momentum strategy while shorting 1 sector. For this asset, we initially set a weight of 5%, then increased it to 10%, followed by 15%, and continued until we reached 30%. Throughout this analysis, we maintained a 12-month ranking period (and 1-month rebalancing period).
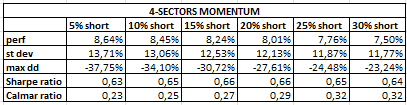
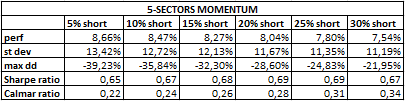
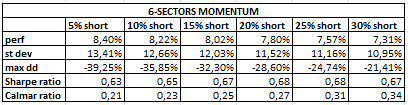
By comparing the results from Tables 5, 6, and 7 with those in Table 1 presented in Step 1, we can conclude that the momentum + short strategies are more effective than the S&P 500 or equally weighted benchmark. Therefore, their application is beneficial for investors, especially the 5-sectors momentum strategy.
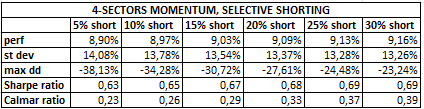
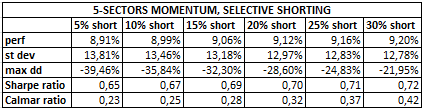
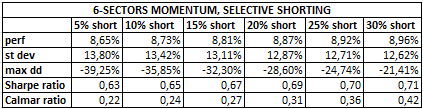
In this step, we adjusted the shorting aspect of the strategy, focusing on selective shorting. Maintaining a short position throughout the entire investment period is not necessary. Instead, we aimed to hold the short position only when the equally weighted (EW) benchmark (introduced in Step 1) was in a negative trend – specifically, below the 12-month moving average.
As in the previous step, we selected 4, 5, and 6 sectors with the best monthly momentum for the long-momentum part. For the short-momentum part, we used 1 sector with the worst monthly momentum, applying varied weight settings from 5% to 30% in 5% increments, but only when the EW benchmark showed a negative trend. The 12-month ranking period remains unchanged.
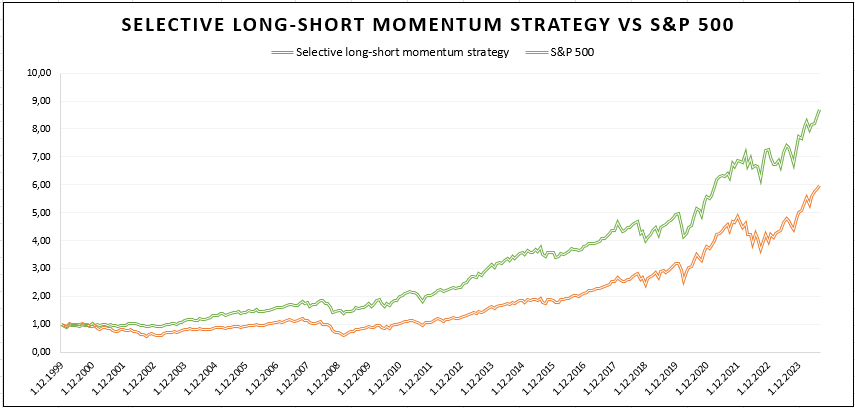
At first glance, it is evident that our long-short momentum strategy and the S&P 500 index exhibit very similar behavior in the market, albeit with different growth intensities. Our strategy has yielded noticeably higher values, demonstrating a tendency to grow and outperform the benchmark from 2001 until the end of the observed period.
Conclusion
The long-short ETF sector momentum strategy by itself does not perform well, making its application unprofitable. Fortunately, there are approaches that can enhance this strategy. Although the separation into long and short momentum is not very beneficial independently, the correct independent settings of long and short legs can yield efficient results. We found that combining 4, 5, or 6 sectors with the best monthly momentum values for long positions, along with 1 sector with the worst monthly momentum value for short positions (applied with a weight not exceeding 30%), significantly increases the strategy’s performance. This approach can be further improved by going short only when the value of the EW benchmark is below the 12-month moving average. With this refined strategy, the Sharpe ratio reaches excellent values ranging from 0.60 to 0.72, and it also outperforms the S&P 500 index over more than 20 years, reflecting its effectiveness.
Author: Sona Beluska, Junior Quant Analyst, Quantpedia
Are you looking for more strategies to read about? Visit our Blog or Screener.
Do you want to learn more about Quantpedia Pro service? Check its description, watch videos, review reporting capabilities and visit our pricing offer.
Do you want to know more about us? Check how Quantpedia works and our mission.
Are you looking for historical data or backtesting platforms? Check our list of Algo Trading Discounts.
Or follow us on:
Facebook Group, Facebook Page, Twitter, Linkedin, Medium or Youtube
Share onLinkedInTwitterFacebookRefer to a friend


