An Empirical Analysis of Conference-Driven Return Drift in Tech Stocks
Introduction
Corporate conferences have long been recognized as pivotal events in financial markets, serving as catalysts that signal upcoming innovations and strategic shifts. Scheduled corporate events induce market reactions that can be systematically analyzed to reveal predictable return patterns. In this work, we focus on examining the return drift exhibited by technology stocks in the days surrounding their respective conferences, employing simple quantitative methods with daily price data.
The hypothesized return drift is premised on the notion that investor sentiment and market dynamics are significantly altered by the information disseminated at these conferences. Investors, reacting to both anticipatory signals and post-announcement adjustments, tend to drive prices in a measurable manner in the windows immediately preceding, during, and after the events. By systematically analyzing stocks of companies such as Apple, Google, and Microsoft, this study aims to validate the existence of these drift patterns and shed light on the underlying mechanisms, thereby enhancing mutual understanding of event-driven asset pricing dynamics.
Background
The influence of scheduled corporate events on stock market behavior has been extensively documented in the finance literature. Early seminal work by Cutler et al. (1989) and subsequent analyses by Fama (1998) provide a theoretical framework that supports the idea that information flows during such events can temporarily distort market prices. These studies are complemented by more contemporary investigations (e.g., Brennan, Huh, and Subrahmanyam, 2018), which have applied high-frequency data methodologies to uncover subtle yet statistically significant return adjustments around key corporate announcements. Our analysis builds on this foundational work by specifically correlating conference dates with empirical return outcomes in the technology sector.
Parallel research has increasingly focused on the nuances of investor behavior in the context of event-driven trading. In the realm of technology stocks, conferences serve not only as venues for product launches but also as opportunities for signaling future growth trajectories and strategic investments. Although the integration of emerging technologies, such as artificial intelligence, is a growing area of interest, our study treats these elements as secondary to the primary narrative of innovation and market reaction. This distinction aligns with the insights presented by Baker and Wurgler (2007) and Hong and Stein (2007), who argue that while novel factors do influence market perceptions, the timing and structure of investor responses largely conform to classical event theory. Our study contributes to this literature by providing a targeted analysis of the return drift phenomenon, supported by rigorous methodological execution and empirical validation.
Methods
In this section, we will briefly outline our thought process, idea development, and discuss the employed approaches, presenting preliminary and initial investigation results that lay the groundwork for advanced and further work.
Data
Dates of conferences are from the corresponding Wikipedia pages, and correctness checked by a simple Google double-check (in case of Google conference, Google search is the primary source):
- Worldwide Developers Conference (Apple)
- Google I/O (Alphabet Inc.)
- Microsoft Build (Microsoft)
Financial data for corresponding stocks AAPL, GOOGL (choice of Class A shares is because of slightly better liquidity than Class C GOOG), and MSFT are from EODHD.com – the sponsor of our blog. (All prices are dividend-adjusted and take stock splits into consideration, so-called adjusted close by data source.)EODHD offers seamless access to +30 years of historical prices and fundamental data for stocks, ETFs, forex, and cryptocurrencies across 60+ exchanges, available via API or no-code add-ons for Excel and Google Sheets. As a special offer, our blog readers can enjoy an exclusive 30% discount on premium EODHD plans.
Our considered data sample spans from September 12, 2011, to June 3, 2025.
Initial Analysis
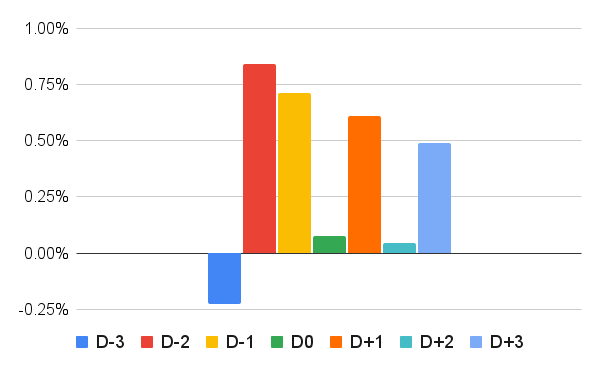
The first type of analysis involved a simple investigation of the distribution of results around the days preceding (D-3 to D-1) and following (D+1 to D+3) the conferences. Here, D0 represents the number of days during the conference, which may range from one to four, and averages the return over these days as if one holds stock continuously.
The following are histograms presenting results for each stock in an long position (buy) and its respective conference:
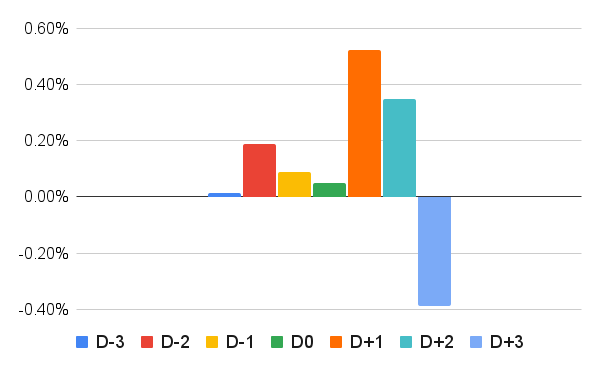
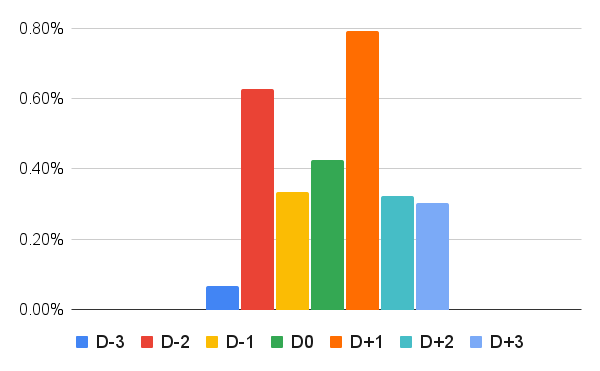
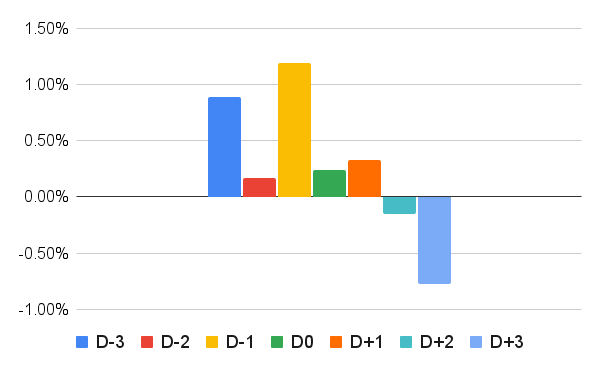
We can see there is a drift preceding, during, and after the catalyst, in this case, the conference days. What it differs in is, of course, intensity. The strongest is the anticipatory run, which the old trading adage of speculation wisdom characterized as: “Buy the rumor, sell the news.” However, post-conference drift is also not negligible, especially in the case of Apple and Google.
Results
As we typically do, after conducting initial investigations and simple analyses, we aim to develop an actionable trading strategy to create a valuable and practical investment strategy based on the exploitable findings.
We evaluated several options, ranging from preceding and following days, and found a straightforward yet powerful combination to achieve the most optimal results.
Conference Drift for Individual Stocks
We develop a concept of an easy trading strategy that holds long positions (buys) in any of the three mentioned stocks during a time window from D-2 to D+2.
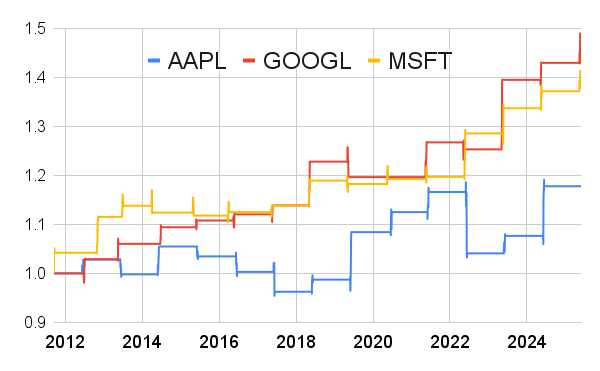
We can see that each of the stocks exhibits a fairly positive performance and steady returns, except for Apple, which has been slightly lagging behind its peers. Developer conferences, in the case of Apple, are probably not the one that takes the most attention, and price action is perhaps centered also around other events (like September’s announcement of new Apple products).
Final Strategy Development
So, what does the performance of a “buy and hold” portfolio of these three stocks during D-2 and D+2 of their conference days look like?
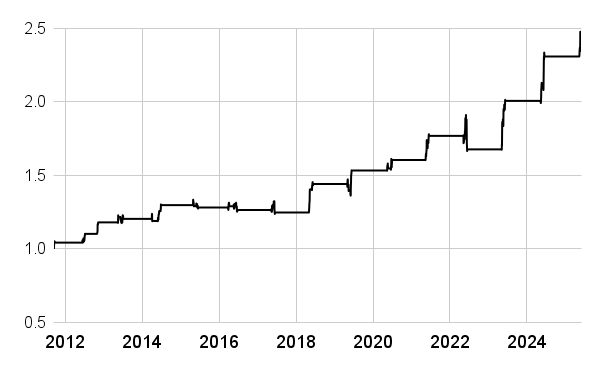
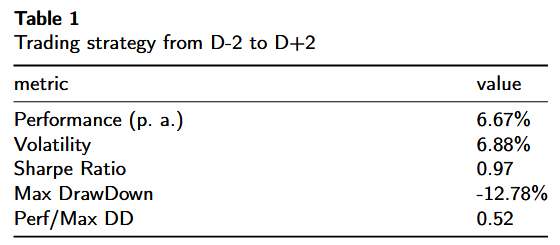
As a standard of our reporting, we present the most essential performance and risk metrics to evaluate the strategy:
Strategy exhibits steady returns with occasional sharp drawdown. Advantage of strategy is allocation to stocks only few days a year while trying only to capture positive behavior based on internal stock fundamentals.
Market Neutral Strategy (Alpha Generation)
The idea here is to employ a market-neutral strategy, supplementing the final plan with a short SPY leg, thereby effectively creating a spread portfolio that captures the excess (alpha) return based on the generated signal.
To verify and validate the generated signal, we created a histogram of the corresponding stock’s returns on days surrounding conferences and subtracted the return from the broad market, represented in this case by the SPY ETF.

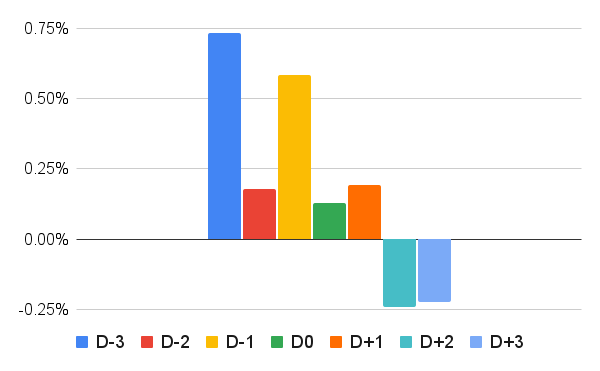
It is still evident that a significant portion of returns comes from D-2 to D+1, and capturing these market-independent returns is crucial.
MSFT and GOOGL are again better performing, while AAPL lags. Once again, the most probable explanation is that the developer conferences are not events when most of the AAPL price action takes place.
Market-Neutral Strategy
The rule here is to be long conference stock and short SPY, but only on days D-2 to D+2 to make it comparable with our first straightforward long-only strategy.
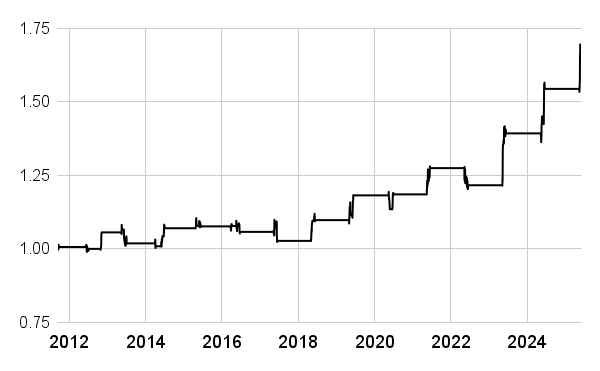
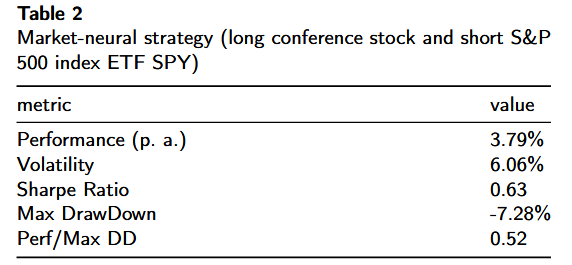
While this strategy offers a lower return, it also exhibits lower drawdown and achieves independence from the performance of the overall broad stock market, thereby offering a valuable additional choice for portfolio managers seeking to capture alpha.
Conclusions
The empirical results derived from the D-2 to D+2 trading strategy underscore a compelling market inefficiency that manifests around major technology conferences. Specifically, our strategy achieved an annualized performance of 6.67%, with a volatility of 6.88% and a Sharpe Ratio of 0.97, while recording a maximum drawdown of -12.78% and a performance-to-drawdown ratio of 0.52. These performance metrics not only validate the robustness of a strategy that capitalizes on the return drift phenomenon but also affirm that the scheduling of these events significantly influences investor behavior, thereby predictably distorting asset pricing.
Our analysis establishes that the return drift observed in the D-2 to D+2 window represents a profitable anomaly within the broader context of event-driven trading. By systematically correlating conference dates with tangible return outcomes, we provide empirical evidence of a market inefficiency. This anomaly, as evidenced by the statistically significant and repeatable performance metrics obtained, presents a engrossing case study on how systematic trading strategies that exploit transient pricing dislocations can achieve superior risk-adjusted returns, thereby contributing to both the academic literature and practical trading paradigms.
Author: Cyril Dujava, Quant Analyst, Quantpedia
Are you looking for more strategies to read about? Sign up for our newsletter or visit our Blog or Screener.
Do you want to learn more about Quantpedia Premium service? Check how Quantpedia works, our mission and Premium pricing offer.
Do you want to learn more about Quantpedia Pro service? Check its description, watch videos, review reporting capabilities and visit our pricing offer.
Are you looking for historical data or backtesting platforms? Check our list of Algo Trading Discounts.
Would you like free access to our services? Then, open an account with Lightspeed and enjoy one year of Quantpedia Premium at no cost.
Or follow us on:
Facebook Group, Facebook Page, Twitter, Linkedin, Medium or Youtube
Share onLinkedInTwitterFacebookRefer to a friend


