A Century of Meme Stocks and the Price of Coordination
Meme stocks are commonly studied through social-media activity, but this approach limits both the historical scope of research and the signals available to practitioners. In A Century of Meme Stocks and the Price of Coordination, Chad Schmerling develops an alternative: a machine-learning model trained to identify the holdings of the Roundhill MEME ETF using market and firm-level data rather than textual inputs. By adapting the feature set to historical data availability, the paper constructs a measure of “memeness” extending back to 1926. For traders and portfolio managers, its principal contribution is a framework for identifying speculative activity and examining how its return implications vary with the investment horizon.
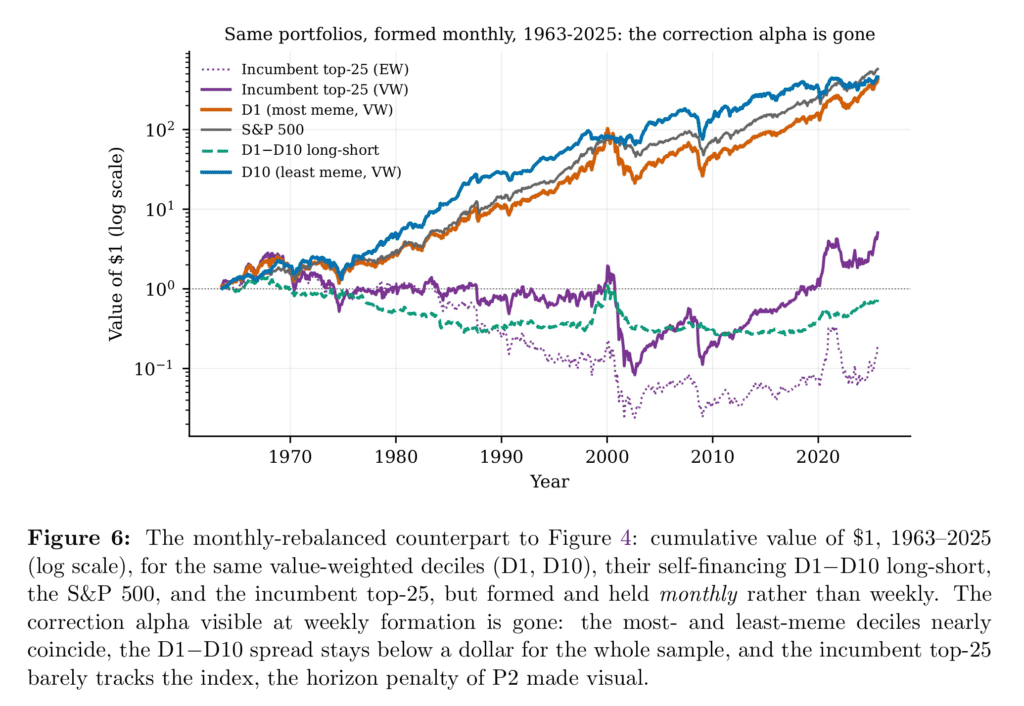
The historical results indicate a substantial difference between weekly and monthly portfolio formation. Over 1963–2025, a value-weighted portfolio that buys the most meme-like decile and sells the least generates an annualized Fama–French five-factor-plus-momentum alpha of 11.5% (t = 6.8). Among stocks above the NYSE median market capitalization, the corresponding estimate is 9.3% (t = 5.9), suggesting that the result is not confined to small stocks. However, the return pattern is short-lived: gains following cohort entry are concentrated in the first one to two weeks and subsequently reverse. With monthly rebalancing, the all-stock decile spread’s estimated annual alpha falls to a statistically insignificant 2.2%. The practical implication is that holding period and rebalancing frequency are central to evaluating this signal.
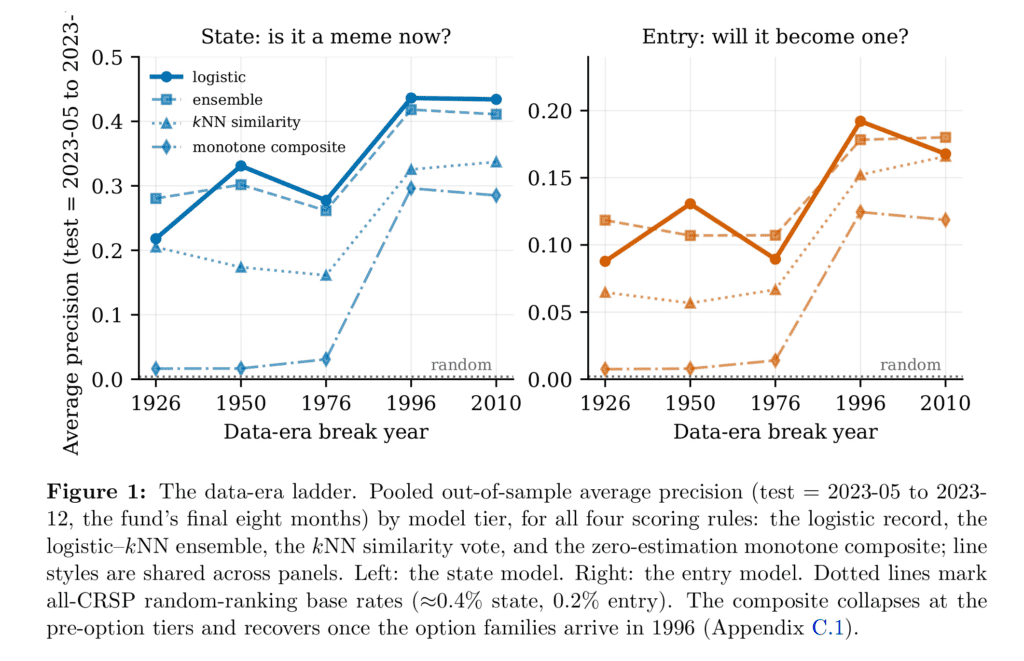
Options data make a particularly useful contribution to classification. Performance improves substantially when the model includes the options features available from 1996, while the subsequent addition of short-interest, securities-lending, and retail-flow variables provides little further improvement in the broad-universe test. Relevant characteristics include option volume relative to stock trading, the share of short-dated options, and implied volatility, alongside trading activity and institutional ownership. These findings suggest that options activity can help identify speculative participation without relying directly on social-media measures. They do not, however, establish that any individual feature constitutes a profitable standalone trading signal.
An important qualification is that the century-long results are a historical reconstruction. The classifier is trained on ETF holdings from 2021–2023, so its application to earlier periods cannot be interpreted as a strategy that investors could have implemented at the time. The more directly relevant test freezes the model in April 2023 and evaluates subsequent performance through August 2025. In this 28-month window, the weekly-rebalanced top-25 portfolios report annualized returns of approximately 130–138%, Sharpe ratios of 1.8–1.9, and negative market betas. Monthly versions produce lower returns and lower Sharpe ratios. These are notable results, but they are gross of transaction costs and involve weekly turnover of approximately 21–22%. Maximum drawdowns of 37–40% also underline the risk associated with the concentrated weekly portfolios.
The paper interprets the persistence of these patterns through limits to arbitrage and coordinated investor behavior. Meme-like stocks exhibit elevated crash risk: cohort members lose at least half their value within a year at a frequency of 13.0%, compared with 9.6% for the broader universe. For portfolio managers, this evidence is relevant to position sizing, concentration limits, and stress testing. It should also be distinguished from the risk of shorting speculative stocks, where continued price appreciation and funding constraints can prevent an investor from maintaining a position until an eventual reversal.
The study offers three practical lessons: evaluate speculative signals at horizons shorter than the conventional monthly interval; consider options activity as an input to identifying crowded retail participation; and assess implementation costs and tail risk alongside reported alpha. Its contribution is a testable framework for studying these effects. Establishing their value in a live portfolio requires further evidence on net returns, capacity, and performance beyond the relatively short out-of-sample period.
Authors: Chad Schmerling
Title: A Century of Meme Stocks and the Price of Coordination
Link: https://papers.ssrn.com/sol3/papers.cfm?abstract_id=7103138
Abstract:
“Meme stocks” are known by their social-media chatter, impossible to identify before the internet age. I instead learn “memeness” from a meme-stock index fund’s holdings using market data alone, so stocks can be scored back to 1926. Memeness identifies coordinated retail mispricing: prices displaced by crowds that congregate faster and more cheaply as coordination technology improves. The displacement corrects at a weekly horizon: a value-weighted five-factor-plus-momentum alpha near 10%/year (t ≈ 7), earned in two weeks and reversed within a month. It persists because arbitraging it means bearing crash risk that realizes on the crowd’s timetable. Both the mispricing and its crash content emerge in force after 2000, exactly when coordination costs collapse; sampled weekly, the correction alpha holds out of sample in 2023–2025.
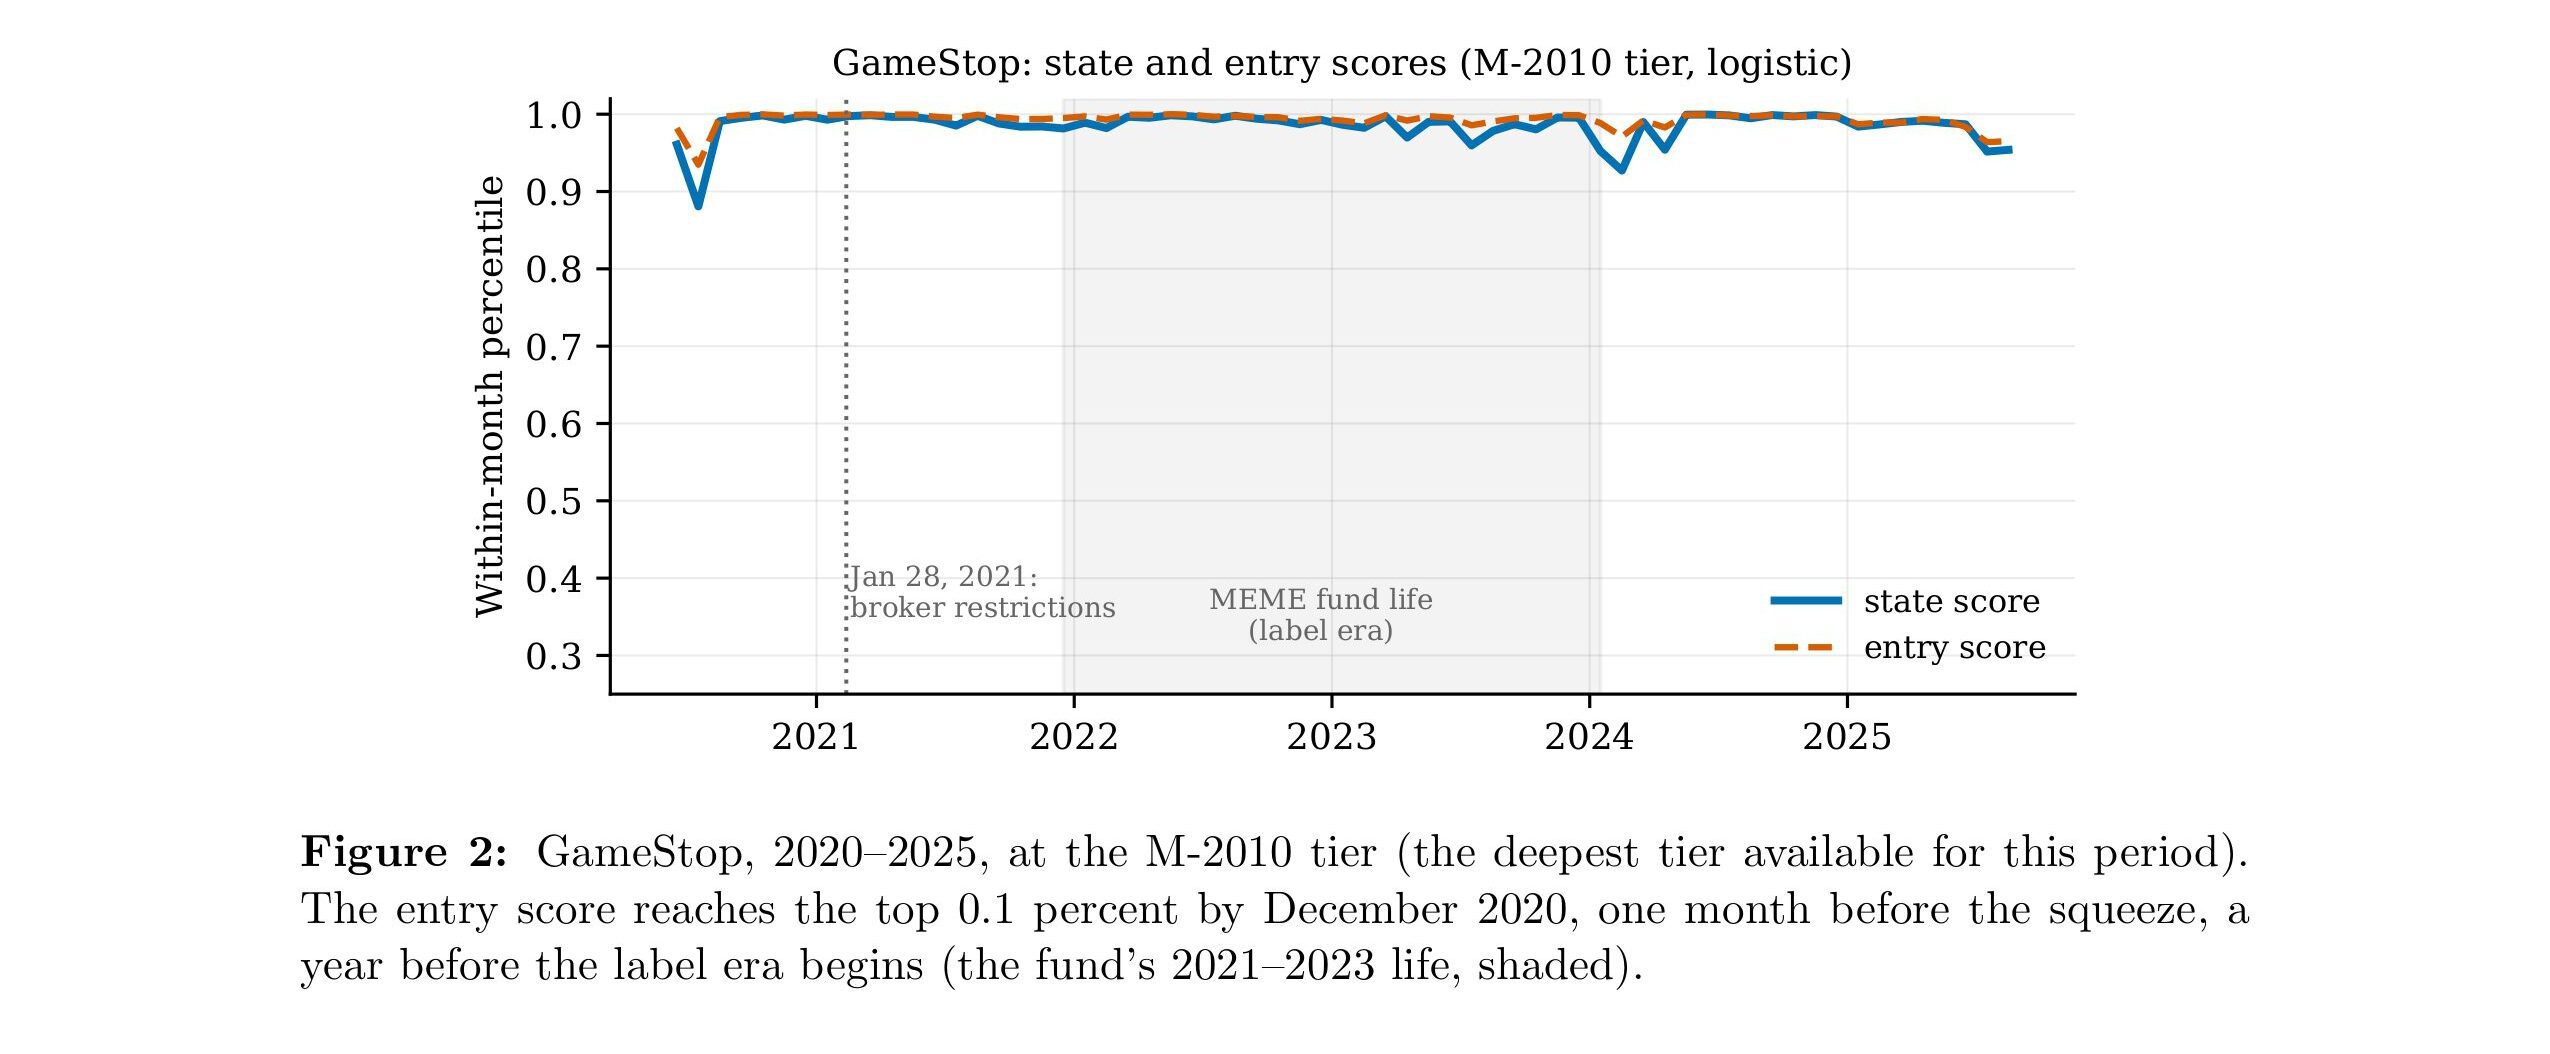
As always, we present several interesting figures and tables:
Notable quotations from the academic research paper:
“That measurement turns out to price a large, previously unspanned correction alpha, the paper’s central result. A value-weighted portfolio that buys the most meme-like decile of stocks and sells the least, rebalanced weekly (D1−D10), earns a Fama–French five-factor- plus-momentum alpha of 11.5% per year (t = 6.8) across all stocks and 9.3% per year (t = 5.9) among large caps alone, 1963–2025. Adding replicated lottery (MAX) and market- beta factors, the two controls most likely to explain away a crowd-attention correction alpha, leaves it essentially unmoved, at 11.4% (t = 6.8) and 9.2% per year (t ≈ 6), respectively. That the correction alpha survives among large caps, where bid–ask bounce and illiquidity cannot manufacture a spread, is what makes it an asset-pricing fact: coordinated attention prices a common source of risk that the standard factor menu does not span.
What does a century of meme stocks teach that a cross-section of attention-grabbing stocks cannot? Attention is an individual-level friction, present in every era: its price effects are small, transient, and roughly constant through time. Coordination is different. It is a technology: pools and tipsters, radio, retail brokers, investment clubs, cable television, message boards, Reddit; and each successor has been cheaper to organize than the last. Scoring the whole century with one fixed definition is what lets me argue that the asset-pricing objects here scale with the price of coordination, not the supply of attention: comovement is acquired at cohort entry, crash-prone displacement concentrates where coordination is strongest, and both the meme mispricing and its correction alpha are in force only after 2000. Frenzy frequency itself rises 1.4-fold to 2.1-fold across the same divide. The payoff is a secular prediction that no attention-based design can deliver: as coordination costs keep falling toward zero, I expect displacement episodes to grow larger, more frequent, and more correlated, with crash externalities that are a policy margin distinct from attention itself.
As people congregate into communities, they periodically manufacture buying frenzies that push a security’s price away from its fundamental value. For a matter of weeks, coordinated attention substitutes for information. This is not new behavior: RCA and the leveraged pyramids of 1929, the go-go electronics names of the 1960s, and Ameritrade at the center of the day-trading boom in 1999 carry, in price and volume alone, the identical signa- ture the model finds in GameStop in January 2021, decades before any of the technology that supposedly makes 2021 unique. What is new, and still growing, is the coordination technology that manufactures these frenzies, together with the option market in which the resulting demand is now most cleanly detected. The century panel shows that as this technology has cheapened, frenzies ignite more often and each one pays more to whoever identifies it early. Coordinated attention overriding fundamentals is a widening, measurable channel, and it is widening on precisely the dimension that shows no sign of reversing: the speed and cheapness of assembling a crowd.
The correction alpha on meme stocks is real and large at the horizon coordinated attention actually operates on, and it is invisible, or inverted into a penalty, at the horizon most of asset pricing measures the world, and most allocators act, on: a month. Anyone who identifies a meme stock correctly but waits on a monthly cycle to act on it is, over this channel, systematically on the wrong side of a clock that has been running faster every decade for a hundred years. What a century of prices makes plain is that the meme stock was never the artifact of any single era’s technology; it is what a crowd does to a price whenever it can, and all that has changed is how quickly, and how visibly, it now does so.”
Are you looking for more strategies to read about? Sign up for our newsletter or visit our Blog or Screener.
Do you want to learn more about Quantpedia Premium service? Check how Quantpedia works, our mission and Premium pricing offer.
Do you want to learn more about Quantpedia Pro service? Check its description, watch videos, review reporting capabilities and visit our pricing offer.
Do you want algorithmic access to the full Quantpedia database via the API? Subscribe to Quantpedia Pro, ask for an API key, and explore the in/out-of-sample statistics, source academic papers, and code snippets — ideal for quantitative research, systematic trading workflows, and AI model training.
Are you looking for historical data or backtesting platforms? Check our list of Algo Trading Discounts.
Or follow us on:
Facebook Group, Facebook Page, Telegram, Twitter, Linkedin, Medium or Youtube
Share onLinkedInTwitterFacebookRefer to a friend