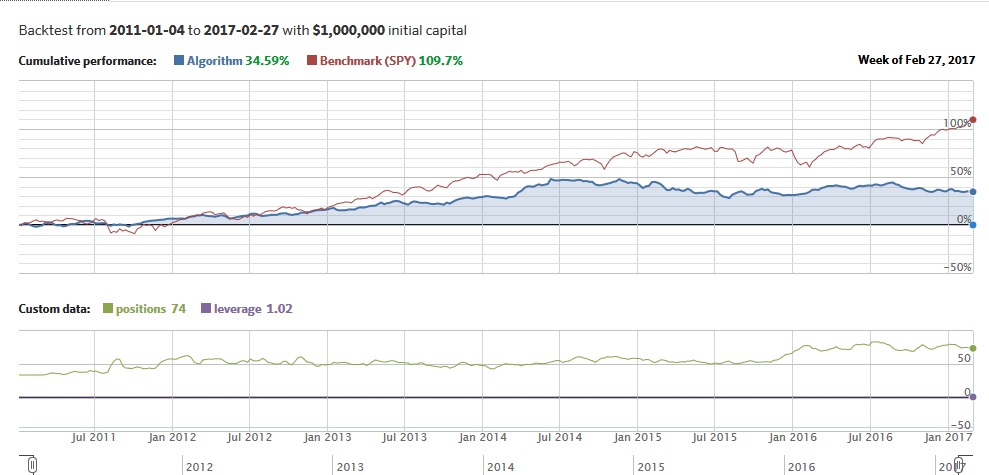
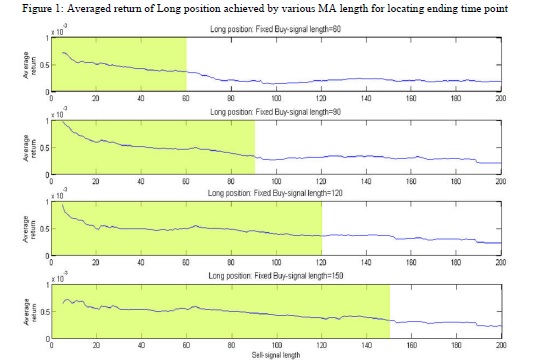
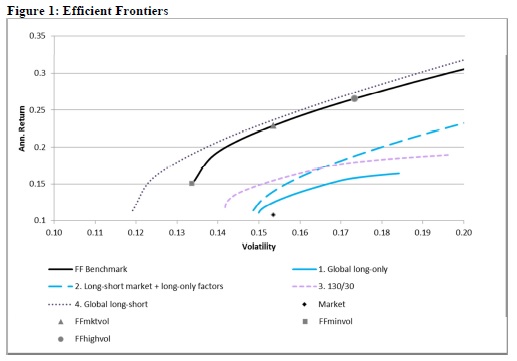
A related paper has been added to:
#14 – Momentum Effect in Stocks
Authors: Bhattacharya, Li, Sonaer
Title: Has Momentum Lost Its Momentum?
Link: http://papers.ssrn.com/sol3/papers.cfm?abstract_id=2791138
Abstract:
We evaluate the robustness of momentum returns in the US stock market over the period 1965 to 2012. We find that momentum profits have become insignificant since the late 1990s partially driven by pronounced increase in the volatility of momentum profits in the last 14 years. Investigations of momentum profits in high and low volatility months address the concerns about unprecedented levels of market volatility in this period rendering momentum strategy unprofitable. Past returns, can no longer explain the cross-sectional variation in stock returns, even following up markets. Investigation of post holding period returns of momentum portfolios and risk adjusted buy and hold returns of stocks in momentum suggests that investors possibly recognize that momentum strategy is profitable and trade in ways that arbitrage away such profits. These findings are partially consistent with Schwert (2003) that documents two primary reasons for the disappearance of an anomaly in the behavior of asset prices, first, sample selection bias, and second, uncovering of anomaly by investors who trade in the assets to arbitrage it away. In further analyses we find evidence that suggest three possible explanations for the declining momentum profits that involve uncovering of the anomaly by investors, decline in the risk premium on a macroeconomic factor, growth rate in industrial production in particular and relative improvement in market efficiency.
Notable quotations from the academic research paper:
"In this paper, we investigate whether momentum profits have been driven away or at the very least its pattern altered in the wake of growing knowledge about momentum strategy and competition amongst arbitrageurs who trade on it, if we were to believe momentum profits were caused in the first place due to delayed price reactions to firm-specific information as suggested by Jegadeesh and Titman (1993, 2001).
Our analyses span over the period between 1965 and 2012. We divide the entire time period into three subperiods. The first subperiod corresponds to the Jegadeesh and Titman (1993) sample period, 1965 to 1989, the second subperiod covers the Jegadeesh and Titman (2001) “out of sample period”, 1990 to 1998, the third subperiod corresponds to the period 1999 to 2012. In our study, we choose to examine the persistence of momentum profits while avoiding concerns of data dredging by conducting tests in our out-of-sample period that starts at the beginning of 1999 immediately after Jegadeesh and Titman’s (2001) “out of sample period” ends. Using the data over the 1999 to 2012 sample period, we find that Jegadeesh and Titman (1993) momentum strategies fail to yield profits in the more recent times. This period is particularly interesting as it witnessed the dot-com bust after catching the boom by its tail and also the financial crisis followed by the greatest stock market meltdown since the great depression. One of our concerns in dealing with this unique period is what if the recent turbulence in the economy with a series of high-loss episodes in the US stock market and unprecedented levels of market volatility has rendered momentum strategy unprofitable?
We employ alternate methodologies to scrutinize whether the rapid decline of momentum profits to insignificant levels in this 14 year period is indeed an outcome of the marked rise in market volatility. For instance, we use controls for the periods of unusual volatilities in the capital market, 2007 to 2009 in particular and yet fail to reject the hypothesis that momentum profits have not declined to insignificant levels. Excluding the last financial crisis, 2007 to 2009 serves the additional purpose of excluding spring of 2009 that witnessed the biggest momentum crash in the history of stock market since the summer of 1932 as alluded to by Daniel and Moskowitz (2012). Next, we employ the daily median volatility index, VXO for the period 1986 to 1998 to classify months in the latest subperiod into high and low expected volatility months.5 If momentum profits have declined because of increased volatility of the market, momentum strategy should be profitable at least in months when the implied volatility is as low as in low volatility months in the period 1986 to1998, a period when momentum is profitable. However, what we document is that while momentum strategy is profitable in the period 1986 to 1998 no matter the implied volatility, it fails to generate profit for the period 1999 to 2012 even in the 60 months classified as low volatility months primarily clustered between November 2003 and July 2007.
We also investigate whether momentum profits resurface in this period following up markets as documented by Cooper, Gutierezz and Hameed (2004). Not only are these momentum profits insignificant on average following up markets, their distribution also reveal visible and statistical difference from those in the periods 1965 to 1989 and 1990 to 1998, indicating a deeper and more fundamental change in the underlying process of generation of momentum profits, beyond huge market crashes. The distribution of up market momentum profits in this period is extremely volatile interspersed with huge negative returns that suggest that momentum as a strategy has become riskier in the latest subperiod compared to the two earlier subperiods. Further analysis indicates that the idiosyncratic volatility of momentum portfolio returns has increased compared to the previous periods. We also examine whether cumulative past returns can explain the cross-sectional variation in stock returns. In the presence of return continuation, we expect past stock returns to be positively related to current stock returns, especially following up markets since momentum profits are essentially up market phenomena. As expected in the periods 1965 to 1989 and 1990 to 1998, current stocks returns are positively related to past returns exclusively following up markets. However, in the current subperiod, with decline in momentum profits past returns fail to explain current returns following up markets and show a reliably negative relation following down market.
We suggest three possible explanations for the declining momentum profits that involve uncovering of the anomaly by investors, decline in the risk premium on a macroeconomic factor, growth rate in industrial production in particular, and relative improvement in market efficiency.
The first explanation proposes that momentum profits decline post 1998 because investors become increasingly aware about the profitability of implementing a relatively simple momentum trading strategy, wherein they identify winner (loser) stocks and buy (sell) them. The growing awareness and competition amongst these investors would lead to an increasingly earlier identification and trading of momentum stocks. This explanation predicts intensified reaction to both winner and loser stocks in the identification period itself, which would result in either exhaustion or, at the least, a substantial reduction in return continuation in the holding period.6 We find evidence consistent with this prediction.
The second explanation is based on the findings of Liu and Zhang (2008) who document that growth rate of industrial production, in various specifications, explains over half of the momentum profits. We find that in the latest subperiod although the momentum portfolio’s returns continue to load on this industrial production factor, this particular risk factor is no longer priced.
The third explanation explores the possibility of relative improvement in market efficiency. Following Griffin, Kelley, and Nardari (2010), we compute their DELAY measure, that reflects the degree of response of stock returns to past market returns, and we record a fairly significant reduction in delay in all size portfolios but for the largest one."
Are you looking for more strategies to read about? Check http://quantpedia.com/Screener
Do you want to see performance of trading systems we described? Check http://quantpedia.com/Chart/Performance
Do you want to know more about us? Check http://quantpedia.com/Home/About