A Deeper Look on Commitments of Traders Report
Sun Tzu once wrote (paraphrasing) “know yourself, know your enemy, and you shall win a hundred battles without loss”. This proverb is true also in financial markets as it is always easier to prepare trading/investment strategy when you know who are other market participants and what their intentions probably are. A new academic research paper written by Robe & Roberts gives a more in-depth insight into the CFTC’s weekly “Commitments of Traders” report. The COT’s report offers a small number of trader groupings; therefore, its usefulness is very limited. However, Robe & Roberts use trader-level data that originate from the CFTC’s Large Trader Reporting System (LTRS), which allows them to create a very detailed look at the composition of agricultural futures market.
Authors: Robe, Roberts
Title: Who Holds Positions in Agricultural Futures Markets
Link: https://papers.ssrn.com/sol3/papers.cfm?abstract_id=3438627
Abstract:
We use non-public data regarding all trader-level futures positions, reported to the U.S. grain and oilseed derivatives market regulator (the CFTC), in order to describe the nature of market participants, the maturity structure of their holdings, and the aggregate position patterns for nine different categories of traders that we separate based on their main lines of business. We provide novel evidence about the overall extent of calendar spreading and about the contribution of commercial traders to total spreading activity.
Our sample’s 3,854 traders account for 86 to 93 percent of the total futures open interest at the end of an average day in 2015–2018. Well over 90 percent of their positions have maturities of less than a year. Among our nine trader categories, just three (hedge funds and commercial dealers/merchants, plus commodity index traders on the long side) account for about four fifths of all reported trader positions. In fact, fewer than 200 “permanent” large traders (overwhelmingly from these three categories) make up the bulk of the daily open interest in the four largest agricultural futures markets.
In the aggregate, the positions of commercial dealers and hedge funds (including commodity pool operators, commodity trading advisors, managed money traders, and associated persons) are highly negatively correlated. This correlation is strikingly strong for short positions: as a result, the sum total of commercial dealers’ and hedge funds’ respective shares of the short open interest fluctuates relatively little over time.
We show, for the first time, that calendar spreads account for more than a third of all large trader positions; that much of the intra-year variation in the total futures open interest can be tied to changes in the extent of calendar spreading; that about half of all spread positions involve contracts expiring in 4 to 12 months (either spreading with shorter-dated contracts, or involving only maturities of 4 to 12 months); and that commercial traders who are not swap dealers (dealers and merchants, mostly) make up from a quarter to two fifths of all calendar spread positions. Again, commercial dealers’ and hedge funds’ shares of the spread open interest are negatively correlated. None of these patterns can be inferred from public data, as the CFTC’s Commitments of Traders Reports (COT) do not break out spreads for “traditional” commercial traders in general and commercial dealers and merchants in particular.
Notable quotations from the academic research paper:
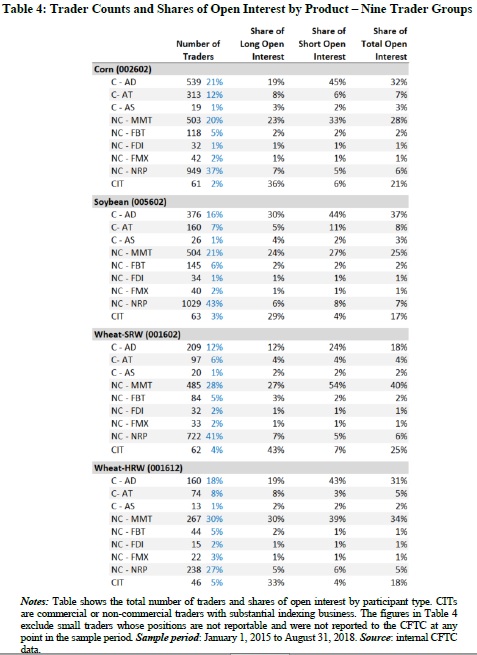
” This table reports the shares (in percent) of the reported open interest (OI) for nine trader categories in the four largest U.S. agricultural futures markets. The Commodity Index Traders (CIT) category comprises the commercial swap dealers and managed money traders with substantial indexing business. Commercial trader categories include commercial dealers (AD), commodity swap dealers (AS, excluding commodity index traders), and other traditional commercial traders (AT). Non-commercial traders include managed money traders (MMT, excluding commodity index traders), floor brokers and traders (FBT), financial dealer intermediaries (FDI), traders with multiple registrations other than MMT (FMX), and other large market participants that are not registered with the CFTC (NRP). Each individual reported trader’s OI is calculated based on averages of daily long and short positions. Individual totals are then summed up across all large traders in a given category. The figures exclude small traders whose positions are not reported to the CFTC, which account from 10 to 15 percent of the total open interest. Because CITs’ positions are overwhelmingly long, the “open interest” for that group of traders (calculated as the average of their long and short positions) understates by approximately half their contribution to the long-only open interest.
| Do you want to test these ideas yourself? We offer our readers Historical Trading Data Discounts. |
The public COTs’ categories mix rather dissimilar kinds of traders. First, three of the four disaggregated COT groupings include traders that are principally involved in commodity indexing as well as traders that are not. We isolate the former to create a distinct group of “commodity index traders” (CIT). Second, under the label “Other non-commercials,” the COTs include floor traders, brokers, and several other disparate types of financial intermediaries. We disaggregate this “catch-all” group into several smaller, but more homogeneous, sub-categories. Third, in the same vein, a single commercial COT category lumps together all large “Producers,” “Processors” (mills, biofuel refineries, etc.), elevators and other kinds of physical-market “Dealers and Merchants”, plus all the other large commercial “Endusers” that are not commodity swap dealers. Intuitively, one would expect those diverse kinds of market participants to trade differently. Using the non-public information on each trader’s daily positions and main line(s) of business, we document that, indeed, commercial dealers are—in the aggregate—often net short (resp. long) when all other traditional commercial traders are— collectively—net long (resp. short).
Next, our data allow us to disaggregate the COT information not only by finer trader subgroups, but also by maturity. A big drawback of the public COT reports is that they sum up trader positions across all contract expirations. This aggregation obscures dissimilarities in the respective extents to which different trader groups’ are active at the near and far ends of the futures curve and in their calendar spreading styles.
In 2015-2018, we find no (wheat) or almost no (corn, soybeans) activity at maturities beyond three years. For virtually all of our nine trader sub-categories, on average 93 (corn) to 97 percent (wheat) of the open interest is concentrated within the front year expiry range. Noncommercial traders tend to focus on the near end of the futures term structure: two thirds of the aggregate non-commercial positions involve contracts expiring in 130 days or less, vs. only about half of all commercial positions. This focus on the two nearest maturities is strongest for managed money traders: on average, up to 70 percent of their aggregate positions in the four largest agricultural futures markets involve contracts expiring within four months.
Last, but certainly not least, the ability to disaggregate trader positions by maturity allows us to provide novel evidence on calendar spreading. While the public COTs show the aggregate net long, net short, and calendar spread positions held in the aggregate by three broad categories of large traders (commercial swap dealers, managed money traders, and other non-commercial traders), the COTs do not break out calendar spreads for the other types of commercial traders. Using the CFTC’s non-public trader-level data, we tabulate spread positions for all of our nine (more granular) trader sub-categories. We show, to our knowledge for the first time, that—in the aggregate—calendar spreads account for over one third of large trader positions and that non- CIT commercial traders (mostly dealers and merchants) contribute, on average in 2015—2018, from 28 percent (SRW wheat) to 40 or more percent (beans, corn, HRW wheat) of all calendar spread positions in each market. This novel evidence provides empirical support for a long tradition, in the agricultural economics literature, of prominent authors’ arguing that calendar spreading is a key component of many commercial traders’ activities in grain and oilseed futures markets—a fact that is all but absent from the corresponding finance literature.”
Are you looking for more strategies to read about? Sign up for our newsletter or visit our Blog or Screener.
Do you want to learn more about Quantpedia Premium service? Check how Quantpedia works, our mission and Premium pricing offer.
Do you want to learn more about Quantpedia Pro service? Check its description, watch videos, review reporting capabilities and visit our pricing offer.
Do you want algorithmic access to the full Quantpedia database via the API? Subscribe to Quantpedia Pro, ask for an API key, and explore the in/out-of-sample statistics, source academic papers, and code snippets — ideal for quantitative research, systematic trading workflows, and AI model training.
Are you looking for historical data or backtesting platforms? Check our list of Algo Trading Discounts.
Or follow us on:
Facebook Group, Facebook Page, Telegram, Twitter, Linkedin, Medium or Youtube
Share onLinkedInTwitterFacebookRefer to a friend


