An Analysis of Volatility Clustering of Equity Factor Strategies
Introduction
Factor investing is a centrepiece of modern portfolio management and there is a lot of research related to it. For example, Jennifer Bender et al. (2013) identified the following equity factors, which historically provide premium and are backed by academic research: Value, Low Size, Low Volatility, High Yield and Momentum. However, there is much more evidence from essential authors Eugene F. Fama and Kenneth R. French in their three-factor (1993) or five-factor (2014) models.
There are many well-documented ways how to allocate among equity factors, besides others, one from our colleague Matus Padysak (2021), who published “The Active vs Passive: Smart Factors, Market Portfolio or Both?”, where he combined smart equity factors with the market portfolio. As he states, the smart equity factors allocated by blended fast/slow time-series momentum signal enhances the market portfolio, especially during market downturns, when they perform very well. Worth mentioning is also a paper from FTSE Russell (2020), which covers allocation of equity factors over three allocation schemes: (1) Equal Exposure, (2) Risk Exposure, (3) Equal Risk Contribution.
Volatility Clustering
Volatility clustering is a well-known effect in equity markets. In simple meaning, volatility clustering refers to a tendency of large changes in asset prices to follow large changes and small changes in asset prices to follow small changes. This interesting effect can be sometimes uncovered as one of the reasons for the functionality of some selected trading strategies. For example, low-volatility months in stock indexes (like the S&P 500 Index) are usually also months with higher performance. As volatility tends to cluster, a low volatility month in the present can signal a low volatility month with a better performance also in the future. This is the basic rationale why long-only trend-following strategies perform pleasantly in bull markets in stocks.
Equity Factor Strategies
How can we build on this knowledge? It is natural to think also about the other investment universes. Based on this, we will be testing two hypotheses: (1) firstly, if there is a volatility clustering anomaly present in equity factor strategies; (2) secondly, if there is any performance pattern related to volatility. For our equity factor strategies, we chose:
Investment Factor Strategy goes long 20% of firms with the lowest investments (Investments is the growth of total assets for the fiscal year ending in t-1 divided by total assets at the end of t-1) and goes short 20% of firms with the highest investments. The portfolio is rebalanced yearly, and stocks are weighted equally.
Low-Volatility Factor strategy goes long 20% of firms with the lowest average daily volatility during the previous 36-months and goes short 20% of firms with the highest average daily volatility in the last 36-months. The portfolio is rebalanced monthly, and stocks are weighted equally.
Quality Factor Strategy goes long 20% of firms with the highest ROA (Return on assets) calculated as quarterly earnings (Compustat quarterly item IBQ – income before extraordinary items) divided by one-quarter-lagged assets (item ATQ – total assets) and goes short 20% of firms with the lowest quality. The portfolio is rebalanced monthly, and stocks are weighted equally.
Size Factor Strategy goes long 20% of firms with the smallest market capitalization and goes short 20% of firms with the highest market capitalization. The portfolio is rebalanced yearly, and stocks are weighted equally.
Value Factor Strategy goes long 20% of firms with the lowest P/B ratio and goes short 20% of firms with the highest P/B ratio. The portfolio is rebalanced yearly, and stocks are weighted equally.
The investment universe in all five cases consists of 500 US stocks with the highest liquidity (defined as stocks with the highest average monthly dollar turnover). We are interested in factor strategies that are investable in real life; therefore, we are building our investment universe from stocks that have sufficient liquidity.
We use SPY ETF (SPDR S&P 500 ETF Trust) as our proxy for the broad equity market (where the volatility clustering effect is the most visible).
Hypothesis testing
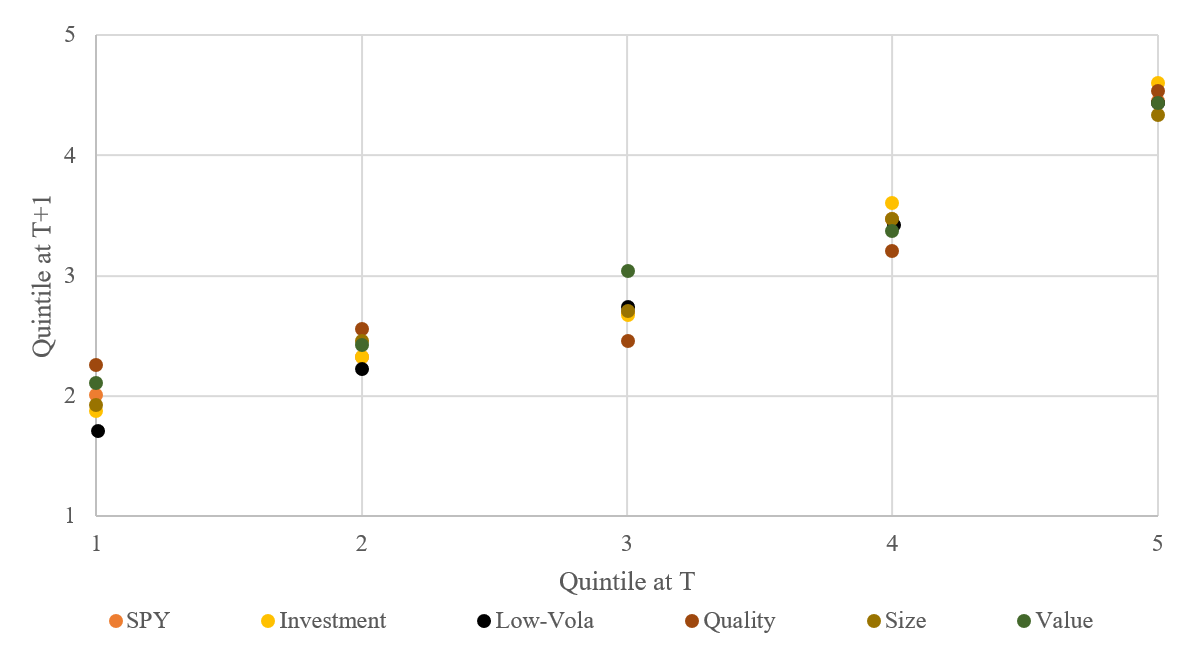
We start with gathering needed data for years 2000-2020 and calculating end of month volatility from daily returns from t-1 to t-20. We divided these monthly volatilities into quintiles where 5. quintile consists of months with the highest volatility and 1. quintile consists of months with the lowest volatile months. Then we compared quintiles for months in t and t+1 to test our hypothesis about the existence of volatility clustering in equity factor strategies. Results in Table 1 and Figure 1 show clear proof for accepting our first hypothesis as we can see nicely clustered subsequent month quintiles next to prior quintiles.
Table 1 Average next month volatility quintiles
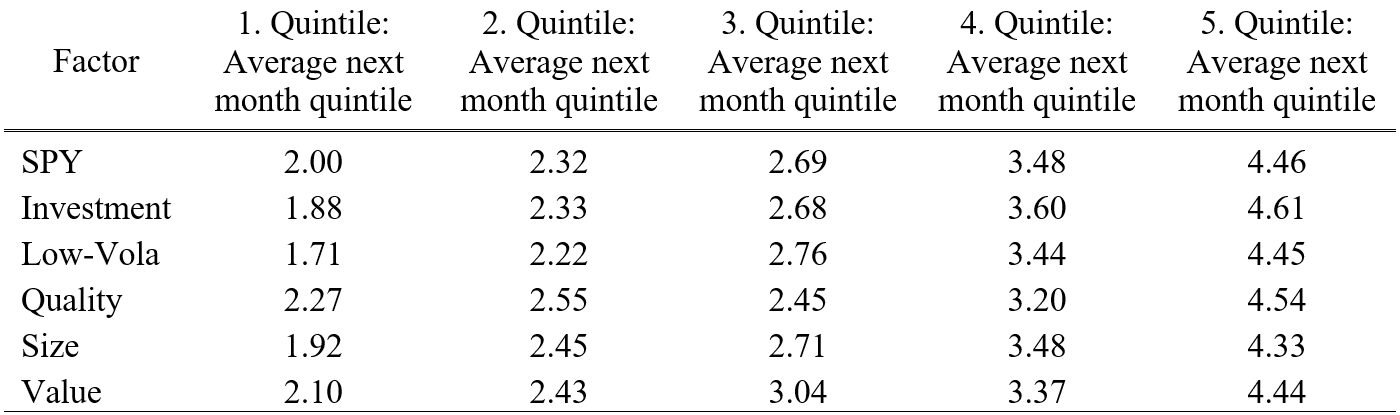
We could further analyze individual factor distribution among quintiles, but at first sight, there is no significant outlier or data structure that is worth mentioning, and mostly, it is not in our interest to do such analysis. We can clearly see SPY values what we consider as a benchmark where volatility clustering anomaly is robustly documented. Compared to equity factor strategies, the evidence is obvious. Although the volatility of some factors is stickier than others, the pattern we observe is alike.
Figure 1 Average next month volatility quintiles
And what about the relationship between performance and volatility? We have already mentioned that with higher volatility, SPY has lower to negative returns – we would like to find a similar pattern in our factor strategies. Therefore, we have performed a similar analysis of selected equity factors, where we have found interesting results (Figure 2). We can clearly see the downward-sloping SPY curve; however, the equity factor strategies do not have that clear pattern. They have a quite stable performance during all quintiles (except Value) with a mild increase in top quintiles. We can’t freely accept our second hypothesis. Nevertheless, the average performance is slightly higher in 4. and 5. quintile, which seems like the opposite pattern as it is recognized at SPY.
Figure 2 Average performance per volatility quintiles at T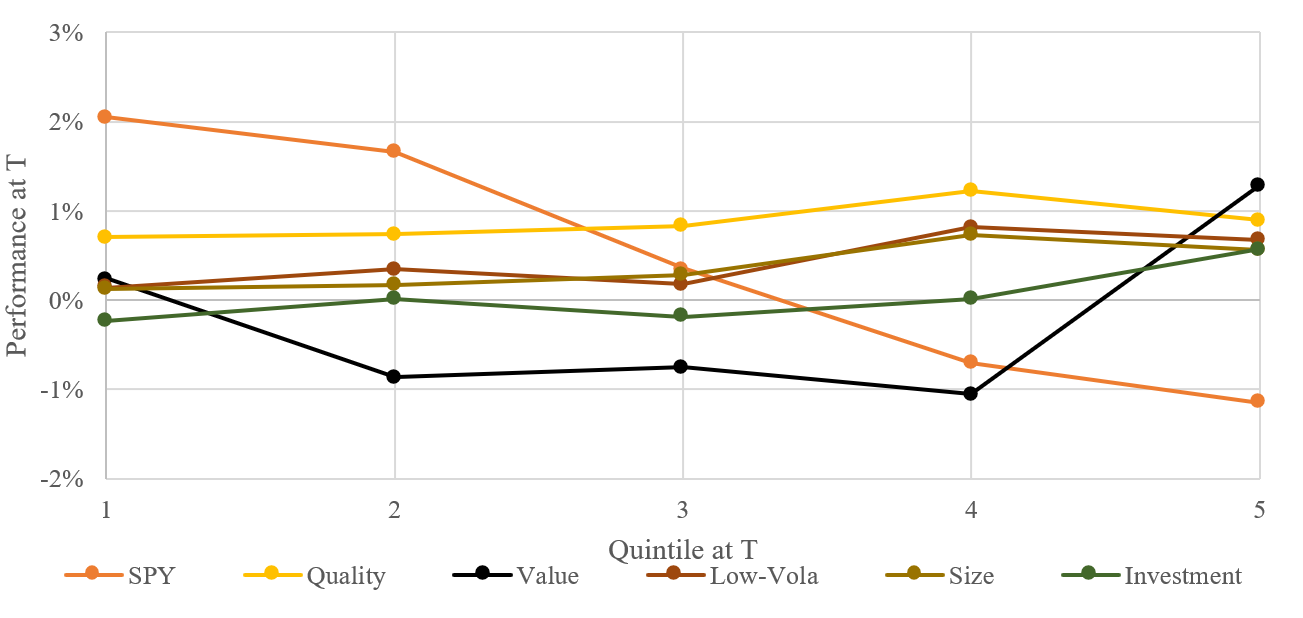
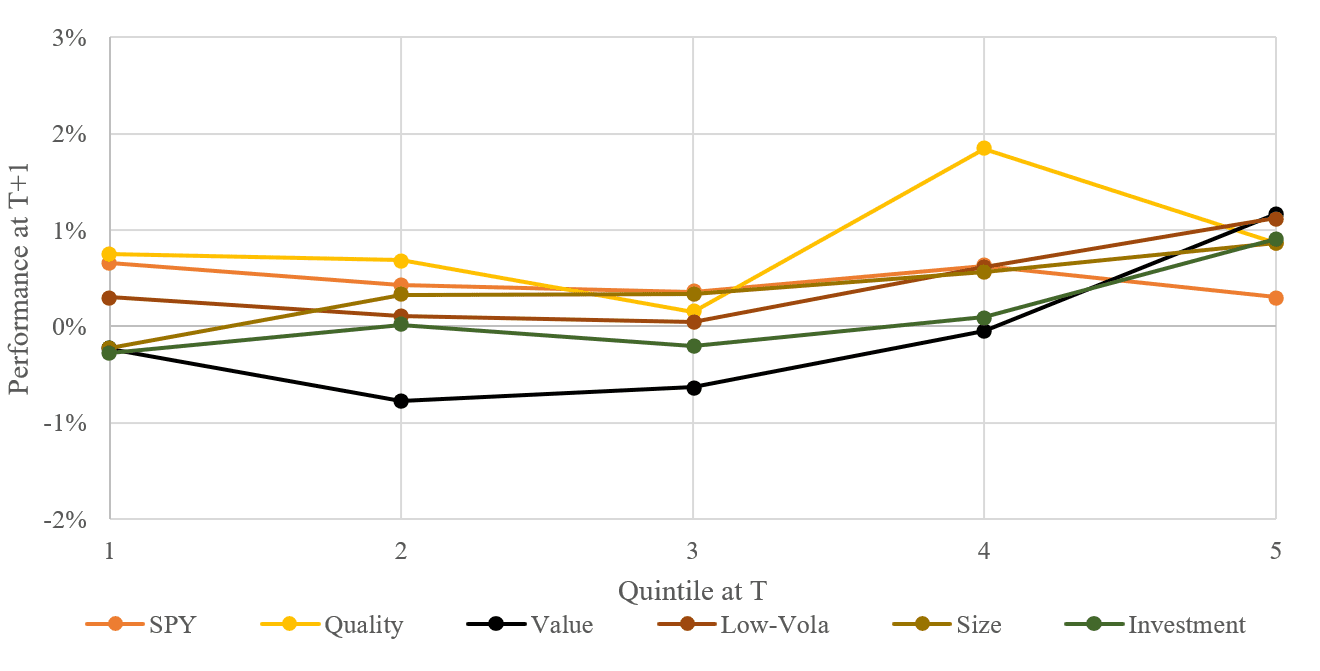
Volatility clustering is an interesting effect, but we are looking for a predictive signal. So, to look for any predictive ability, we need to know the performance in the subsequent months after basis months. Therefore, we have performed the same full sample analysis on the T+1 month performance (Figure 3) from which we have got interesting results.
Analysis of performance for T+1 months shows that the subsequent average monthly performance after a prior month in 5. quintile volatility is also in the highest quintile. What does it mean numerically? After a 5. quintile of T month, (1) the following month T+1 is on average in 4.5. quintile and (2) the average performance for factor strategies in T+1 month is 0.99%. Numerically, it looks like promising results; therefore, we have decided to build a factor allocation strategy using the knowledge mentioned above.
Figure 3 Average performance at T+1 per volatility quintiles at T
Trading strategy test
So, let’s analyze a few simple trading rules. The first idea we wanted to examine was based on the idea to buy equity factor strategies only in the months after their volatility was in the 5. quintile. We used a monthly expanding window – the first three years of our dataset were used to calculate the first set of quintiles. After December 2002, we started to compare T month volatility with 5. quintile of expanding window volatility for each equity factor strategy. Strategies that had T month volatility in the 5. quintile level were added into the portfolio with pro-rata weights for T+1 month. The final weight of individual factor strategy in T+1 depends on the number of selected factor strategies in the portfolio – it could be from 20% if all five strategies are selected to 100% if only one strategy is selected. Although the whole dataset analysis indicated delightful and highly positive results, the final strategy didn’t hold results in a similar way with disappointing -2.2% average YoY performance.
It looked really strange, so we decided to investigate. Instead of using the expanding window to calculate thresholds between quintiles, we tried to use the fixed thresholds (calculated from the whole history). Fixed thresholds are not usable in real trading (we can’t use information about volatility of some factor from the year 2018 to setup thresholds between quintiles in the year 2004), but we wanted to see the performance of the amended strategy to understand the overall negative performance. Strategy with fixed levels performed a little better, but the overall performance was still negative.
Figure 4 Equity Factor Allocation Strategy – Expanding Window vs Fix Level Volatility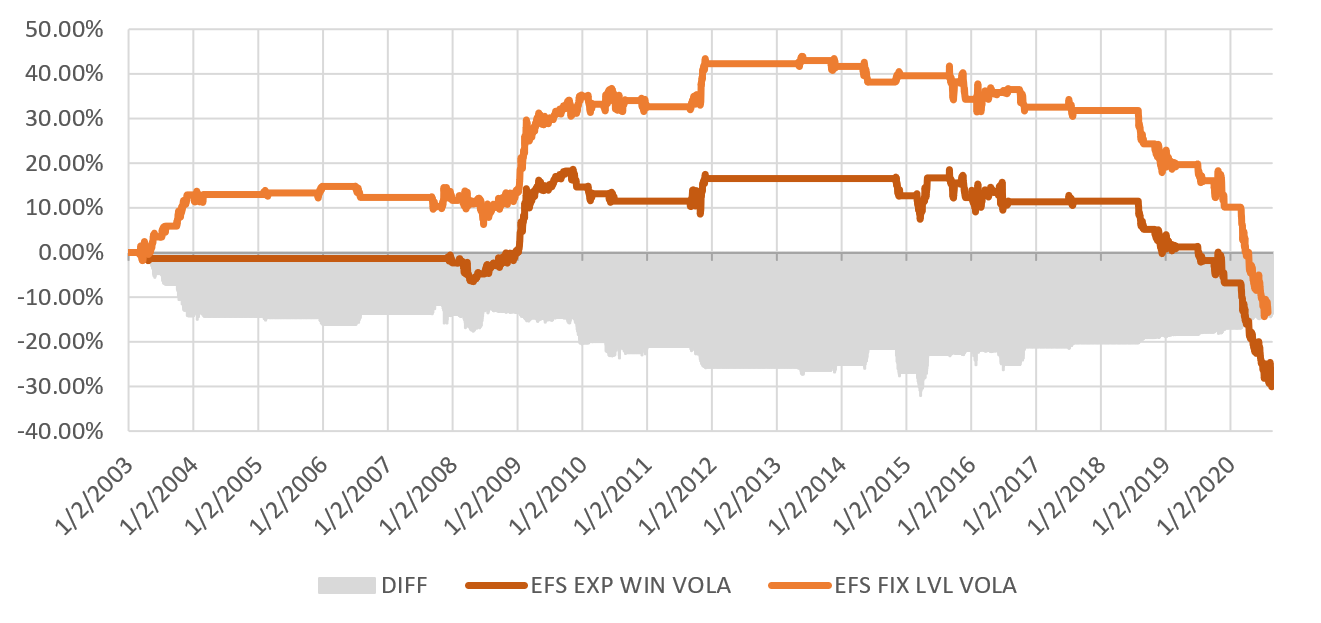
We tried to fixate the weights of all underlying factors to 20% so that all five underlying factor strategies have a similar impact on the resultant factor allocation strategy (even though the use of cash is not optimal). The result was still negative.
Finally, we tried to investigate the performance during the first three years of our sample – 2000 to 2002 (which were first removed from the strategy but were present in the volatility clustering analysis). And there we found our answer. During this early period, the performance of the tested factor allocation strategy was more than 50%.
Figure 5 Equity Factor Allocation Strategy with Fix Level Volatility 2000-2020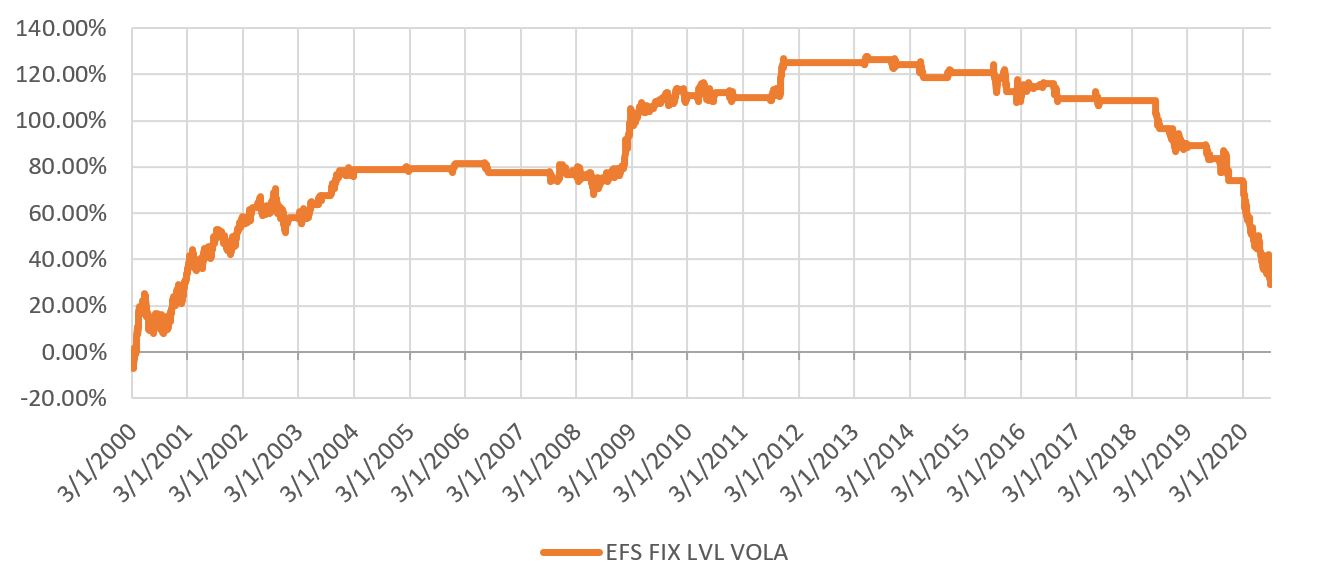
As we can see in Figure 5, the factor allocation strategy based on volatility clustering worked well during the Dot-com bubble and financial crisis. However, by the end of 2018, the strategy started to underperform really quickly after almost a decade of nearly flat performance. This underperformance is not isolated to a single equity factor, but past volatility’s predictive ability vanished for almost all factors. We can only speculate that some underlying fundamental shift in the market structure caused the change also in the behaviour of equity factor strategies. Similar findings of the structural shift in factor performance are also reported in the paper written by David Blitz (2021). Our short analysis only adds a small piece of evidence for the whole puzzle.
Conclusion
This article is an example of a change in the performance of a trading strategy. We tested two hypotheses: (1) if the volatility clustering anomaly is present in the five selected equity factor strategies and (2) if there is any performance predictability pattern connected to the volatility clustering. We were able to confirm both hypotheses. We have found that if the average equity factor strategy’s volatility rises into 5. quintile, the average performance of that equity factor strategy in the next month is 0.99%. However, this analysis does not apply to real life. Real-life factor allocation trading strategy based on expanding window calculation of volatility quintiles delivers a negative performance of -2.2% YoY. Additionally, a significant part of the underperformance is realized during the last few years (2018-2020). It seems that using volatility to predict equity factor performance is one of the ideas that will remain on the graveyard of the trading strategy ideas …
Author:
Radovan Vojtko, CEO, Quantpedia.com
Dominik Cisar, Analyst, Quantpedia.com
Are you looking for more strategies to read about? Sign up for our newsletter or visit our Blog or Screener.
Do you want to learn more about Quantpedia Premium service? Check how Quantpedia works, our mission and Premium pricing offer.
Do you want to learn more about Quantpedia Pro service? Check its description, watch videos, review reporting capabilities and visit our pricing offer.
Do you want algorithmic access to the full Quantpedia database via the API? Subscribe to Quantpedia Pro, ask for an API key, and explore the in/out-of-sample statistics, source academic papers, and code snippets — ideal for quantitative research, systematic trading workflows, and AI model training.
Are you looking for historical data or backtesting platforms? Check our list of Algo Trading Discounts.
Or follow us on:
Facebook Group, Facebook Page, Telegram, Twitter, Linkedin, Medium or Youtube
Share onLinkedInTwitterFacebookRefer to a friend


