An Investigation of R&D Risk Premium Strategies
Introduction
A firm as an independent entity is engaged in a wide range of activities that affect its value. While the impact of some activities on the firm’s value is immediate and indisputable, there also exists a variety of activities that might impact the firm’s value in the future, while their outcome is yet uncertain. A similar logical approach can be used when evaluating the firm’s assets. The majority of a firm’s assets, such as inventories or equipment, are physical, and their value can be easily recorded into the books. On the other hand, the firm also owns assets like workforce skill or production methods that are less tangible and have uncertain value. Under the efficient market hypothesis, the investor should be able to recognize the value of these less-tangible assets. However, in conditions of an inefficient market, the uncertainty caused by intangible assets or indirect activities complicates the stock’s valuation, which could possibly lead to mispricing.
One of the aptest examples of such intangible assets, respectively indirect activity, are expenditures on Research & Development. R&D investments represent a company’s unique expenditure, which is responsible for creating an information asymmetry about the firm’s growth potential and future prospects. In a case when market value reflects only the firm’s financial statements without taking the long-term benefits of R&D investments into consideration, the company’s stocks may be underpriced. On the other hand, the firm’s stock prices may also face overpricing. This might happen in a case when the investors judge the possible future outcomes of current R&D investment based on the past firm’s R&D success, which is not a guarantee by any means.
This puzzle is even supported by the US GAAP and IFRS accounting standards. Under these standards, the costs of R&D must be expensed in the same fiscal year as they occur and therefore could significantly influence the reported earnings of a company in the current year. However, the R&D expenditures usually represent a long-term investment that implies a possible future revenue and cash-flow, and therefore should theoretically be considered as an asset. Whether investors value the R&D expenditures as an expense or as a long-term asset is a cause of possible mispricing.
Even the opinions of academics and the results of various studies regarding this puzzle are not unanimous. A group of academics documents that R&D expensing might result in earnings distortion, and firms with intensive R&D expenditures may be undervalued, as was already outlined. Subsequently, other researchers add that the uncertainty about R&D outcomes leads investors to require a higher return, and R&D activities could, therefore, represent an additional risk factor. On the other hand, others argue that the premium of R&D intensive firms is a result of other risk factors that are unrelated to the amount of their R&D expenditures.
The different conclusions of previous studies, therefore, raised two important questions in us. Is there a premium among firms with intensive expenditures on R&D? If so, does R&D expenditures represent a robust risk factor, or are there any other hidden economic forces that could explain the R&D premium? In this article, we have tried to answer these questions by revisiting and expanding the three previously conducted researches on R&D premium.
Revisiting the paper no.1
The first research paper that we have taken a look at is the one from Lauren Cohen et al. (2012). In this paper, the authors demonstrate that the future benefits of current R&D expenditures are predictable, steady and rather easy to compute based on past R&D success. Following this argument, they show that two firms with a similar amount of R&D expenditures can have quite different but predictably different future performance. Yet, the authors have been able to find out that the investors do not take these differences into account. Therefore, taking advantage of information about firms’ past R&D success could lead to earning abnormal returns. Now, we have tried to document whether is this a real case in today’s market.
Strategy
We have set our investment universe to 3000 largest companies by Market Cap that are listed either on NYSE NASDAQ or AMEX, have higher stock price than $5, and have reported R&D expenditures in each year of the investigated period. Inspired by the methodology of this research, we begin by expressing the firms’ ability to transform the R&D expenditures into growth in sales. This “ability” is calculated at the end of each year by running 8 year rolling firm-by-firm regressions on firm-level sales growth (defined as log (Sales t / Sales t-1)) on lagged R&D (defined as (Sales t-j / Sales t-j ); where j=1,2,3,4,5)). We run separate regressions for five different lags of R&D (i.e., R&D from years t-1, t-2, t-3, t-4, and t-5) and then take the average of these five R&D regression coefficients as the measure of “ability”. Therefore, we need data from 13 years to be able to establish firm´s ability.
Once we establish the “ability” for each firm, we sort the universe into quintiles based on this measure. As we are primarily interested in firms with high R&D expenditures, we simultaneously (at the end of each year) create a secondary tercile sorting based on the amount of the firm’s R&D expenditures relative to the firm’s sales (R&D t / Sales t). Then, we go long (short) on the stocks that are in the intersection of high (low) quintile when sorted by “ability” and high tercile when sorted by relative R&D expenditures. We rebalance on a yearly basis and weight equally.
Results
When backtesting the strategy as described, we have found out that there is not a relevant number of stocks in the intersection of the sorts on the long side. Therefore, we have adjusted the “ability” sorting from quintile to tercile sorting, as well as relative R&D expenditures sorting only to 2 groups: high/low. In the following graph, we can see the results of a strategy that went long (short) on the stocks that are in the intersection of high (low) tercile when sorted by “ability” and high group when sorted by relative R&D expenditures.
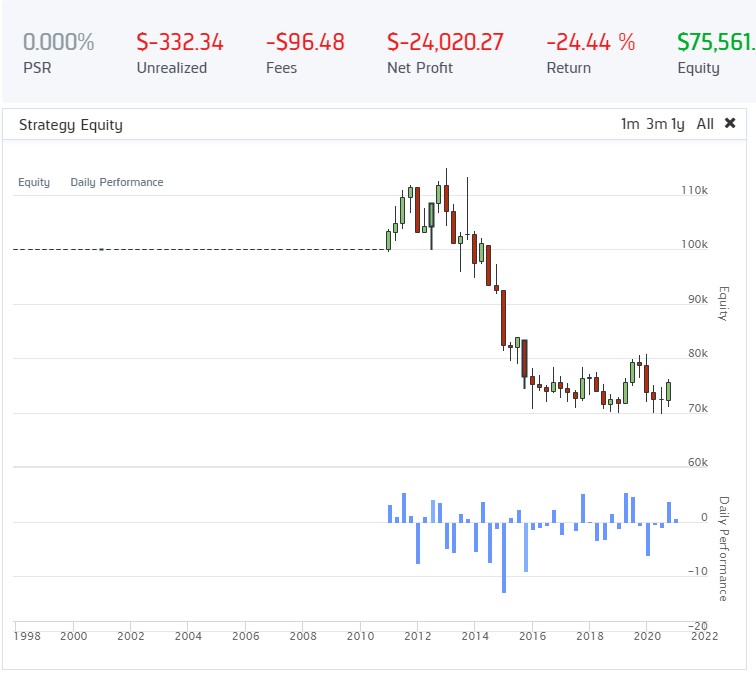
As already mentioned, for the formation of the “ability” measure, we require 13 years of data. Since we are working with a dataset that begins in 1998, the resulting equity curve is restricted to the period from 2011 to 2020. In this period, the strategy has not been able to provide a positive outcome. The strategy yielded a negative compounding annual return of -2,76%, while only 30% of opened positions have been profitable.
For examining the strategy’s performance over a longer period, we have decided to adjust the length of the regression period from 8 years to 4 years, as well as to reduce the number of considered time lags from 5 to 2. These adjustments have allowed us to extend the equity curve back to 2004. The performance of such a further adjusted strategy can be seen in the following graph.
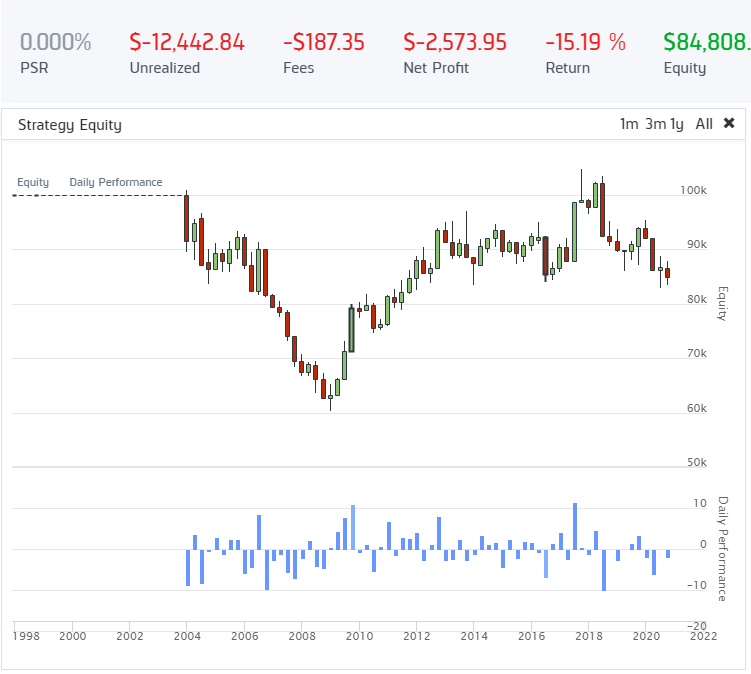
As we can see, the performance provided by this adjusted strategy for a longer period is not any better. The extended time window only confirms that the strategy is not able to provide a stable positive outcome. From 2004 to 2020, the strategy earned a negative compounding annual return of -0,96%, while 40% of trades have been profitable.
Filtering for sectors
Since there is a significant difference in R&D expenditures among firms from different market sectors, the strategy’s results might be driven by sector exposure. Therefore, we have looked at how the strategy would stand if we have filtered the stock universe to stocks from a particular sector. Out of the 11 known market sectors, the backtesting of the strategy has been relevant only for the Technology and Healthcare sectors, while only these two sectors have provided a sufficient amount of trades. The technology and Healthcare sectors also represent firms with the highest expenditures on R&D, which only enhances the relevancy of testing the strategy inside these sectors.
When following the described strategy and filtering the universe to stocks from the Technology sector, the results still remain insignificant. When filtered to technology stocks, the strategy yielded a compounding annual return of 0,14% from 2011 to 2020. When adjusting the regression period from 8 to 4 years and the number of considered time lags from 5 to 2 to obtain a longer backtesting period (2004-2020), the strategy still yielded a compounding annual return of only 2,91%.
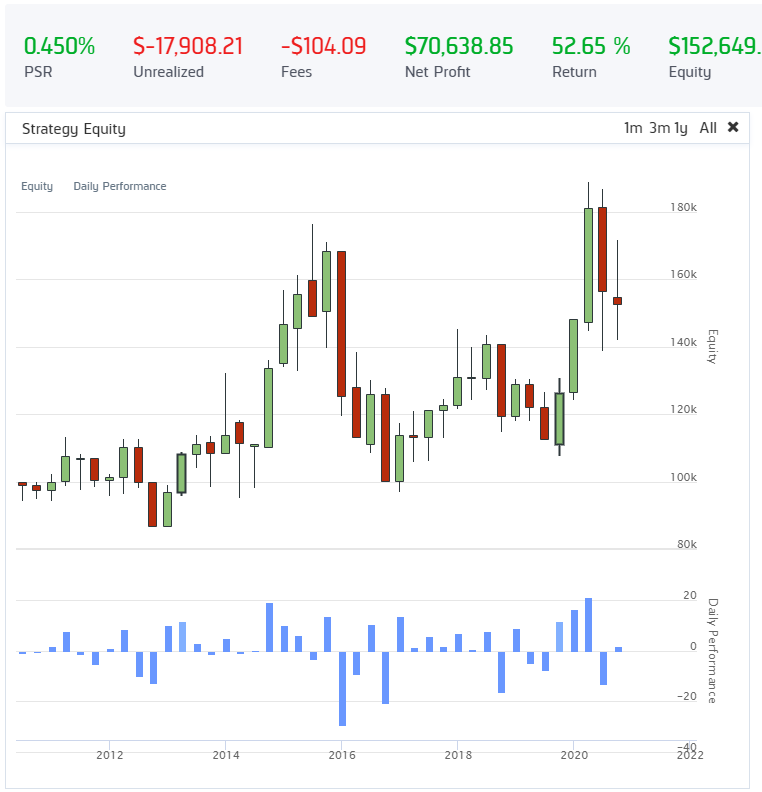
After all, the strategy seems to work well when filtering for stocks form the Healthcare sector. The performance of the described strategy with applied filter for stocks from Healthcare sector can be seen in the following graph.

| What about Data? Look at Quantpedia’s Algo Trading Discounts. |
Filtered to stocks from the Healthcare sector, the strategy yielded a compounding annual return of 8,2% from 2011 to 2020. However, when adjusting the strategy to obtain a longer backtesting window, the results for the Healthcare sector became insignificant. The adjusted strategy gained a compounding annual return of just 1,08% from 2004 to 2020.
Further modifications and testing
After testing the strategy for sector filers, we have decided to test a few more alternations to the original strategy.
First of all, we have tried to determine whether the unsatisfactory results are driven by not selecting the good performing stocks on the “long” side or rather by selecting the good performing stocks on the “short“ side. For this purpose, we have decided to change the “short” side to SPDR ETF (“SPY”). Such adjusted strategy has provided a total return of -1,27% from 2011 to 2020, meaning that stocks selected on the “long” side have not able to beat the market benchmark in the long term. Similarly, we have tested this alternation for Technology and Healthcare sector filters by using sector ETFs “XLK” and “XLV”. The results of this altered strategies for Technology and Healthcare sector filters have been much worse than the results of the initial strategy. This only supports the finding that the strategy’s poor performance is mainly caused by not selecting great performing stocks on the “long” side.
Further, we have tested whether the unsatisfactory results are not caused by the selection of the dependent variable. Therefore, we have decided to change our dependent variable from “growth in sales” to “growth in Market Cap”, resp. “growth in ROA”. Similarly, we have switched the variable for the second sort from “R&D / sales” to “R&D / Market Cap”, resp. “R&D / ROA”. The results of such alternated strategies have been worse yet again. Therefore, we suggest that the unsatisfactory results have not been caused by wrong dependent variable selection.
Finally, we have decided to test for a different sorting principle. At first, we have made the same sorting based on “ability” as described. However, this time we have not made a secondary sorting and intersections. Instead, we took the high quintile of “ability” sorting and made a further tercile sorting by “R&D / sales” inside this quintile. This approach has provided us with the same number of stocks on the “long” and “short” side, as we went long (short) on the high(low) tercile of such sorting. In the same manner, we have tried the opposite sorting procedure. We took the high tercile of “R&D / sales” sorting and make a further quintile “ability” sorting inside this tercile. Even the strategies using alternative sorting have provided worse results than the original strategy, meaning that the sorting technique is not an issue as well.
Conclusion for the paper no. 1
After considering the results of all performed test and alternations we conclude, that the presented strategy is not able to consistently provide abnormal returns, and therefore the firms´ past R&D success does not have the ability to predict the future returns in the cross-section of US stocks. The only case where the strategy showed signs of positive performance and existing relation between past R&D success and future returns was among stocks from Healthcare sector.
Revisiting the paper no.2
The second research paper that we have revisited is the one from Louis K. C. Chan et al. (1999). In this paper, the presented approach to testing the influence of R&D expenditures on future returns has been much simpler than the approach from Cohen et al. (2012). This research does not consider any past ability of transforming R&D expenditures into future income. The authors simply relate the amount of the firm´s R&D spending to future stock performance. The results of the study argue that even though the market prices take the firms´ R&D expenditures into account, the stocks of firms with a high amount of R&D expenditures relative to their Market Cap earn greater average returns in the future. Now, following their methodology, we will try to uncover whether there still exists this premium in today’s market.
Strategy
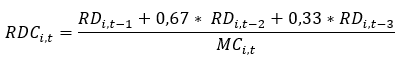
Equal to the previously revisited research, we have set our investment universe to 3000 largest companies by market cap, that are listed either on NYSE NASDAQ or AMEX, have higher stock price than $5, and have reported R&D expenditures in each year of the investigated period. For each stock i in our universe, we calculate a measure of R&D expenditures (RDC) at the end of the April of year t as:

where RD stands for the total reported amount of expenditures on Research & Development and MC for the firm´s current Market Cap. Then we sort the investment universe into quintiles based on RDC and go long (short) on the stocks in the high (low) quintile. For each of the further tested strategies, we rebalance the portfolio on a yearly basis at the end of April and weight the stocks equally.
Results
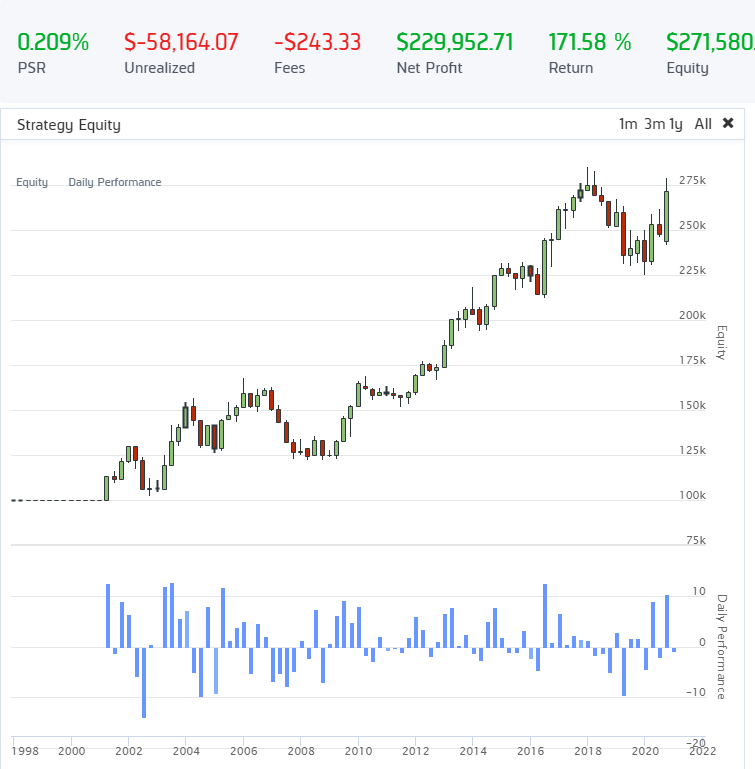
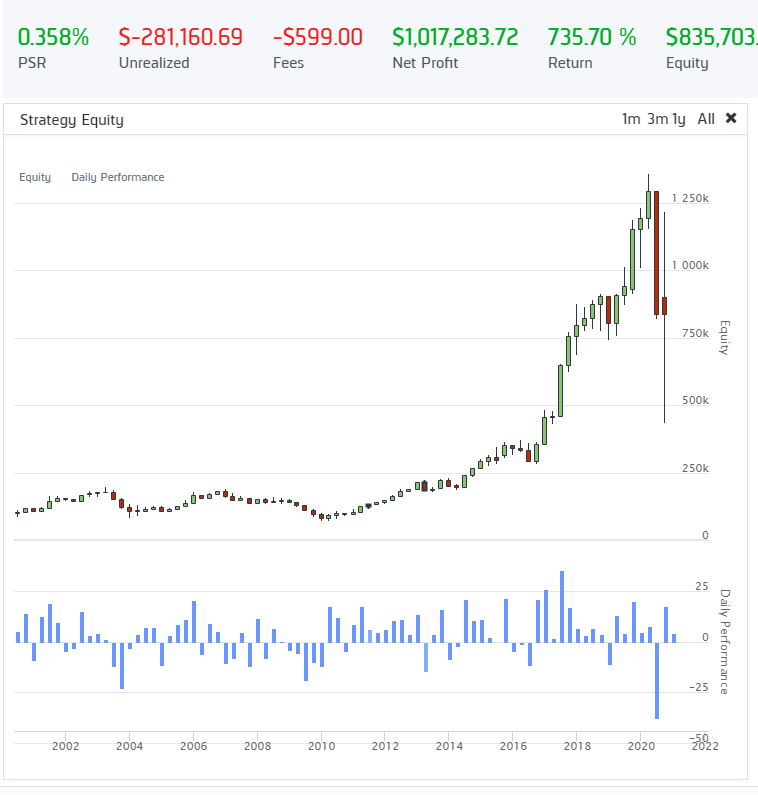
As earlier mentioned, the dataset that we have available begins in 1998. Since we need 5 years of reported data for the creation of the first portfolio, our backtest begins at the beginning of May 2003. The results of the described strategy in the backtested period can be seen in the following graph.
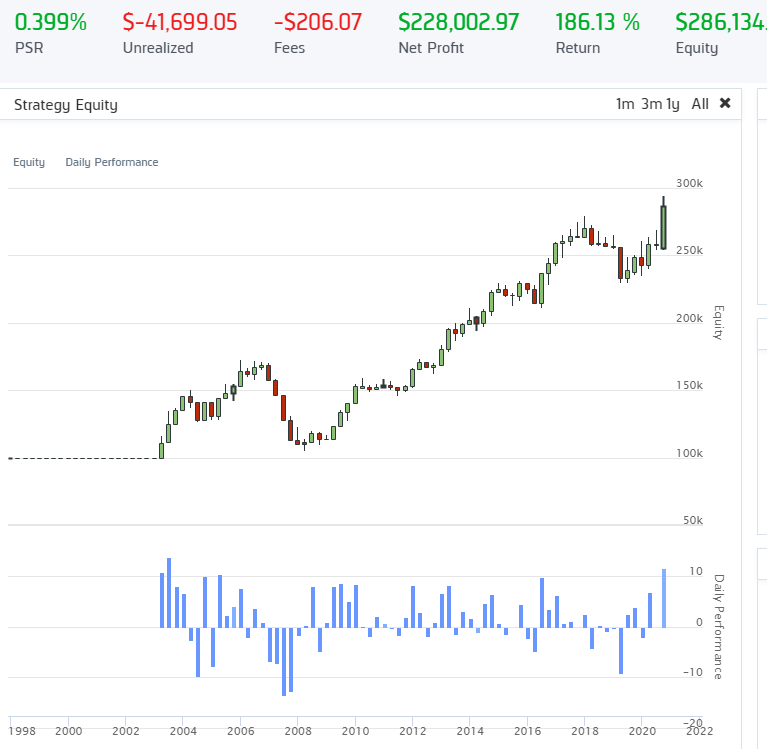
The strategy has been able to consistently provide positive results, earning a compounding annual return of 6,13% from 05/2003 to 12/2020. What is more, the strategy experienced annual volatility of approximately 11%, resulting in 0,56 Sharp ratio. An interesting feature, which contributes to the low experienced volatility, is the strategy´s ability to perform steadily during stock market crashes. In fact, the strategy has been able to provide a positive return during the stock market crash in Q3 and Q4 of 2008. Similarly, the strategy has provided only a slight loss during the stock market crash in Q1 of 2020.
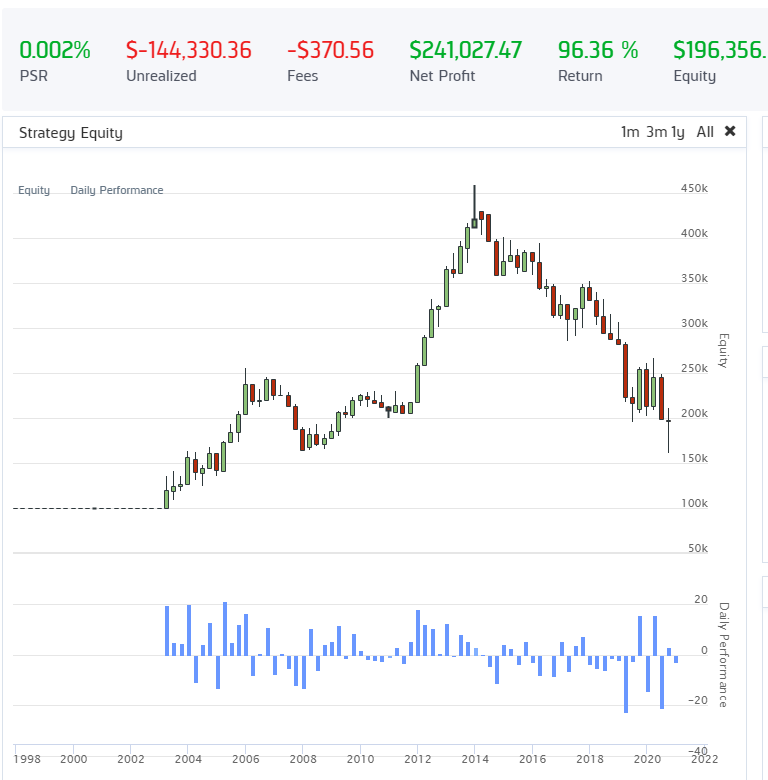
These findings have motivated us to extend the backtesting window and test the performance of the strategy during the 2000-2002 bear market. For this purpose, we have adjusted the calculation of RDC measure to:
Thanks to this adjustment, we have been able to start our backtest in May 2001. The performance of this adjusted strategy can be seen in the following graph.
This adjusted strategy also supports the earlier finding that the strategy seems to work well during stock market crashes. The strategy has been able to provide a slightly positive return during the bear market period in 2001-02. Overall, the shorter look-back period for R&D expenditures and their different weighting has not significantly influenced the strategy’s performance.
Filtering for sectors
Similar to the testing of the first strategy, we have proceeded by testing the performance of strategy among stocks from a particular market sector. Out of 11 known market sectors, we have considered the Technology, Healthcare and Communication Services sectors as relevant for testing, while these sectors represent the firms with the highest investments in innovation.
When filtering the investment universe to a particular sector´s stocks and following the same investing methodology, the positive results are significantly reduced. Filtered for stocks from Technology (Communication services) stocks, the strategy has been able to provide a compounding annual return of only 1,62% (1,96%) from 05/2003 to 12/2020. Once again, when filtering for sectors, the best result has been achieved among stock from the Healthcare sector. The performance of the described strategy with applied filter for stocks from the Healthcare sector can be seen in the following graph.
The strategy with this applied filter seemed to work and provide positive returns during the earlier period until the end of 2013. However, since 2014 the returns have turned and stayed constantly negative, resulting in a compounding annual return of 3,89% from 05/2003 to 12/2020.
Overall, the strategy has not been able to repeat significant positive results when the investment universe has been restricted to a particular sector´s stocks. These findings suggest that the positive results of the strategy that applies the non-filtered universe are driven by other economic forces such as sector exposure and not by R&D premium.
Further modifications and testing
Besides testing for filtered sectors, we have once again decided to perform tests on a few more modifications to the strategy.
A simple individual adjustment, when we sorted the investment universe by RDC to deciles instead of quintiles, has brought similar results. The compounding annual return has slightly increased from 6,13% for quintile sorting to 6,99% for decile sorting.
Further, we have continued by investigating whether the results are driven by selecting overperforming stocks on the “long” side or rather by selecting underperforming stocks on the “short “side. For this purpose, we have used the same technique as for the investigation of the first research paper. When using the SPDR ETF (“SPY”) on the “short” side instead of the low RDC quintile, we have obtained slightly better results (7,23%) with a very similar shape of the equity curve. This finding suggests that the strategy’s positive results are driven mainly by picking the overperforming stocks on the “long” side, while we are not able to pick underperforming stocks on the “short” side. This only supports the previous finding that the positive returns of strategy are not realized based on R&D premium, but thanks to the other economic forces and patterns, such as systematic picking of stocks from overperforming market sectors on the “long” side.
The same alternation has also been tested for Healthcare sector stocks, which have provided the only signs of R&D premium existence so far. In the following graph, you can see the performance of the strategy, which goes long on the high “RDC” quintile of stocks from the Healthcare sector and short on Healthcare sector ETF “XLV”.

Similar to the unmodified strategy for stocks from the Healthcare sector, the modified strategy seemed to work especially well during the earlier period until the end of 2013 and has provided a compounding annual return of 8,9% from 05/2003 to 12/2020. The results obtained by the modified strategy are overall far better than the results obtained by the unmodified strategy. This finding suggests that among stocks from the Healthcare sector, the strategy is able to pick great performing stocks, but it is unable to truly identify the underperforming ones.
Conclusion for the paper no. 2
Even though the presented strategy has been able to provide significant positive results, the further test has shown that once the strategy is applied for sector-neutral investment universe, the positive results vanish. Based on these findings, we conclude that the primary source of the strategy´s positive results is not R&D premium, but rather some other economic forces, most probably the sector exposure of portfolio´s stocks.
Similar to the findings from the first revisited research paper, we have found out that if there is one place to look at for R&D premium, it is among the Healthcare sector stocks. The strategy that went long on stocks from the Healthcare sector with the highest relative R&D expenditures and short on sector ETF “XLV” has earned an annual return of 8,9%.
Revisiting the paper no.3
The last research paper that we have taken a look at, is the one from Lin Yu et al. (2018). This research paper employs similar logic and methodology to test the influence of R&D expenditures on future returns, as the research paper from Louis K. C. Chan et al. (1999). In this paper, the researchers argue that R&D represents a unique risk factor, while increasing R&D expenditures increases cost and adds further risks in the form of product failure. They also add that firms with high R&D expenditures face bigger financial constraints, while these investments are mostly inflexible and often face regulation. Further, they believe that this risk factor is most profound in high-tech industries.
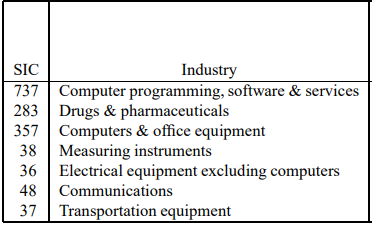
In their research, the authors have not examined the cross-section of returns based only on the R&D risk factor but combined this factor with other well-known factors such as size and value. Moreover, they added a categorization to high-tech and low-tech stocks based on SIC industry codes (see the table below for high-tech). Now, inspired by their methodology, we will try to revisit their findings for the most relevant combinations of these factors.
Strategy
Once again, we have set our investment universe to 3000 largest companies by Market Cap that are listed either on NYSE NASDAQ or AMEX, have higher stock price than $5, and have reported R&D expenditures in each year of the investigated period.
The tested strategies are defined based on two independent sorts. The first one sorts the investment universe into two groups: high-tech and low-tech stocks. Since we have not been able to make this categorization based on SIC codes, we have assigned the stocks from the Technology, Communication Services and Healthcare sector to the high-tech group and the remaining stocks to the low-tech group. Then, at the end of June of year t, we sort the universe into quintiles by the measure of relative R&D expenditures, calculated as the reported amount of the firm´s R&D expenditures for year t-1 scaled by the reported sales for year t-1. These two sorts are then combined to create different strategies. For each further described strategy, we weight the portfolio equally and rebalance yearly at the end of June.
Results
Based on the findings from previous research paper, that there is no R&D premium in sector neutral portfolios, we have started with testing the strategy only for the high-tech group’s stocks to avoid different sector exposure on “long” and “short” side. In the next graph, you can see the performance of the strategy, that goes long (short) on the high (low) quintile of relative R&D sort in universe filtered to high-tech group.
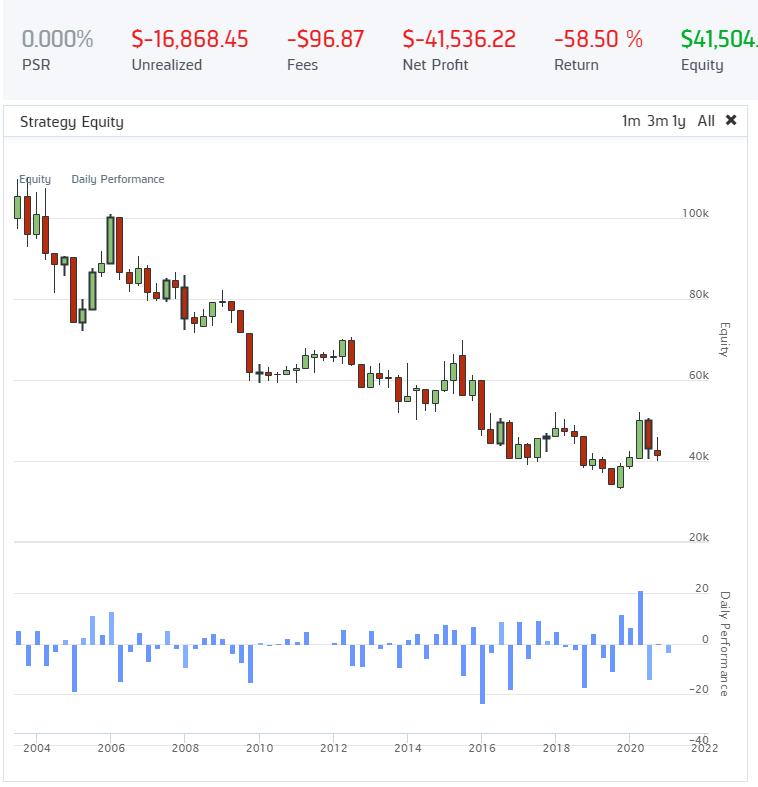
The performance of this strategy was severely influenced by the burst of the tech bubble, and therefore we provide a look at a back-testing period that begins in 07/2003. But even after shifting the start, the strategy consistently provides negative returns until the end of 2020. This finding further supports the findings from revisiting the previous research paper that there is no R&D premium in sector-neutral portfolios.
Further, we have also checked for an alternation of this strategy. At first, we have sorted the entire universe into quintiles based on relative R&D expenditures and then went long on all high-tech stocks form the high quintile and short on all high-tech stocks form the bottom quintile. The strategy with such adjusted sorting has again yielded a negative total return from 07/2003 to 12/2020.
Adding low-tech
Once we started the testing of strategies, which also considers the low-tech stock group, the results have improved. We have begun by testing a strategy, that creates independent quintile sorting by relative R&D expenditures in both high-tech and low-tech stock groups. In the next graph you can see the performance of strategy, that goes long on high quintile of R&D sorting for high-tech group, and short on low quintile of R&D sorting for low-tech group.
Even though the overall performance of this strategy has been better than the performance of strategies that considered only high-tech stocks, the strategy has not provided significant positive returns. Still, the better results support the previous study’s findings: If there is a premium among the cross-section of stocks with high R&D expenditures, the premium is not driven by the intensity of R&D expenditures but by other economic forces, such as sector exposure of the portfolio.
Once we have put more emphasis on sector exposure and not on R&D premium, the results got much better. In the following graph, we can see the performance of a strategy that creates quintile sorting by relative R&D expenditures and goes “long” on all high-tech stocks and “short” on all low-tech stocks from high quintile.
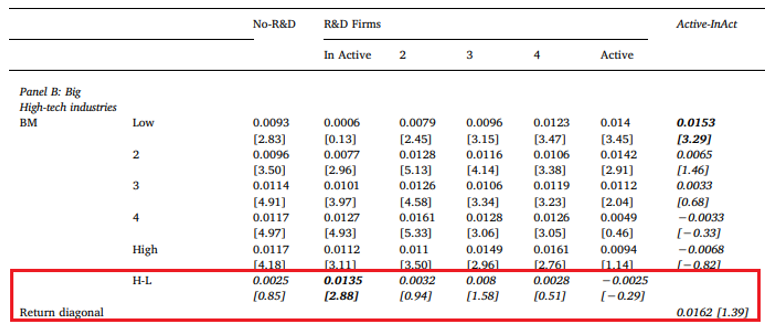
Adding value factor
As earlier mentioned, the researchers have also tested the behaviour of the strategy after adding value risk factor in the form of a book-to-market ratio. The table below shows the matrix of quintile sorts based on relative R&D and book to market ratio among stocks from high-tech industries. From the provided results, we can conclude that the addition of book to market ratio sorting does not have an influence on the overall results.
Conclusion for the paper no. 3
Revisiting the paper from Lin Yu et al. (2018), we have only found more support for the previous findings, that if there is a premium among the cross-section of stocks with high R&D expenditures, it is only found for strategies that consider stocks from all market sectors. Once we filter the investment universe to avoid sector exposure, the positive results vanish.
Conclusion
Considering all of the provided results from revisiting 3 different research papers on R&D premium we conclude, that the firm´s past R&D success does not have the ability to predict the future returns in the cross-section of US stocks. Similarly, we conclude that if there is a premium among the cross-section of stocks with high R&D expenditures, it is only found for portfolios that consider stocks from all market sectors. Once we control for the sector exposure of the portfolio, we are not able to earn significant returns. These findings suggest, that if we are able to earn significant positive returns, these returns are not earned thanks to the R&D premium, but rather to the sector exposure of portfolio and other economic forces. However, some of the results show that If there is one place to look at for R&D premium, it is among the Healthcare sector stocks.
Author:
Marek Lievaj, Quant Analyst, Quantpedia
Are you looking for more strategies to read about? Sign up for our newsletter or visit our Blog or Screener.
Do you want to learn more about Quantpedia Premium service? Check how Quantpedia works, our mission and Premium pricing offer.
Do you want to learn more about Quantpedia Pro service? Check its description, watch videos, review reporting capabilities and visit our pricing offer.
Do you want algorithmic access to the full Quantpedia database via the API? Subscribe to Quantpedia Pro, ask for an API key, and explore the in/out-of-sample statistics, source academic papers, and code snippets — ideal for quantitative research, systematic trading workflows, and AI model training.
Are you looking for historical data or backtesting platforms? Check our list of Algo Trading Discounts.
Or follow us on:
Facebook Group, Facebook Page, Telegram, Twitter, Linkedin, Medium or Youtube
Share onLinkedInTwitterFacebookRefer to a friend


