Anomaly-Based Trading Strategies in the Real Estate Sector. Can the Market Be Beaten?
This study examines the effectiveness of several anomaly-based trading strategies applied to the real estate sector represented by the RlEst index from the Fama–French 48 industry portfolios. Using monthly data from July 1, 1926, to December 1, 2025, we analyze whether selected strategies are capable of generating superior risk-adjusted returns compared to both the standalone RlEst index and the broader market represented by the Fama–French 12-industry portfolios. The tested approaches include trend-following strategies based on moving averages, momentum strategies based on the rate of change of the index, and seasonality-based strategies utilizing different look-back periods.
Introduction
Real Estate Investment Trusts (REITs) are companies that own, operate, or finance income-generating real estate. They offer investors a way to gain exposure to real estate markets without directly purchasing properties and often provide attractive dividend yields. Given the significant role of REITs in financial markets, it is of interest to identify effective investment strategies that could generate consistent profits in this sector.
Our research was inspired by a study The Market Timing Power of Moving Averages: Evidence from US REIT Indexes that examined REITs using a 24-month moving average over the period 1980–2010. In addition to trend-following and moving average analysis, this topic has also been addressed in studies Uncovering Trend Rules and Why have asset price properties changed so little in 200 years. However, none of these works take seasonality into account. Moreover, none of these studies are recent, and some of them do not cover a sufficiently long period for robust testing. Therefore, we attempted to approach this area from a different perspective.
For a more comprehensive analysis, it is important to consider a long historical period. To achieve this, we use the RlEst index from the Fama-French 48 industry portfolios as a proxy, which allows us to extend the testing period back to July 1, 1926.
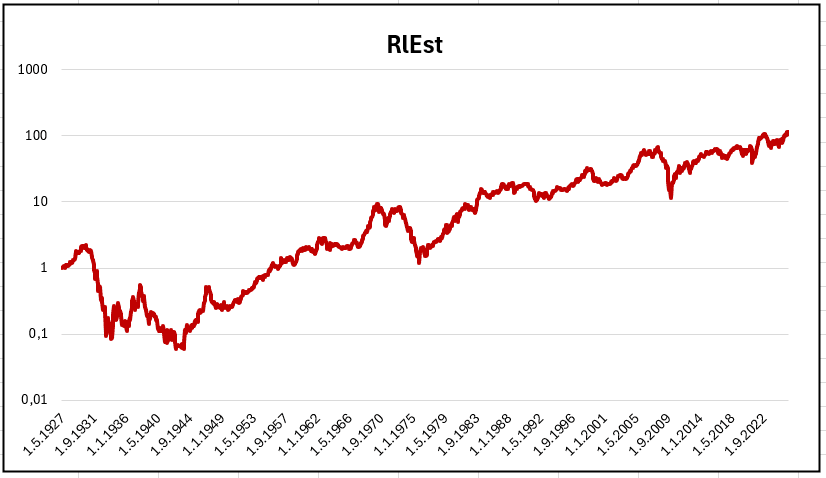
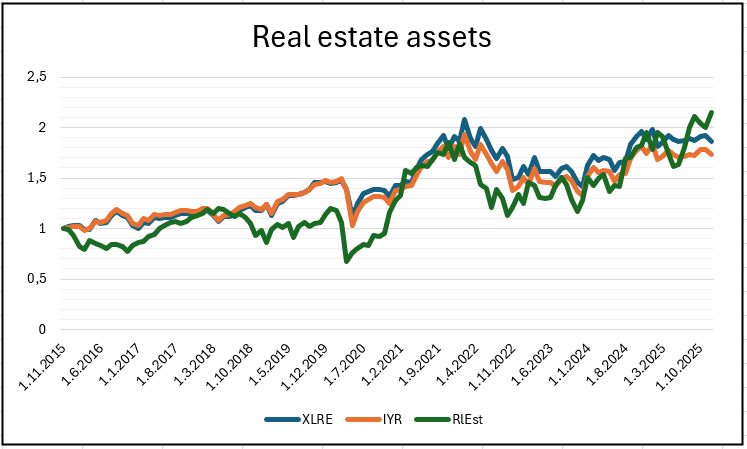
For instance, as shown in Figure 2, RlEst serves as a good approximation for Real Estate Investment Trusts ETFs, capturing the main trends. This extended time frame enables us to observe REIT performance across multiple historical economic cycles.
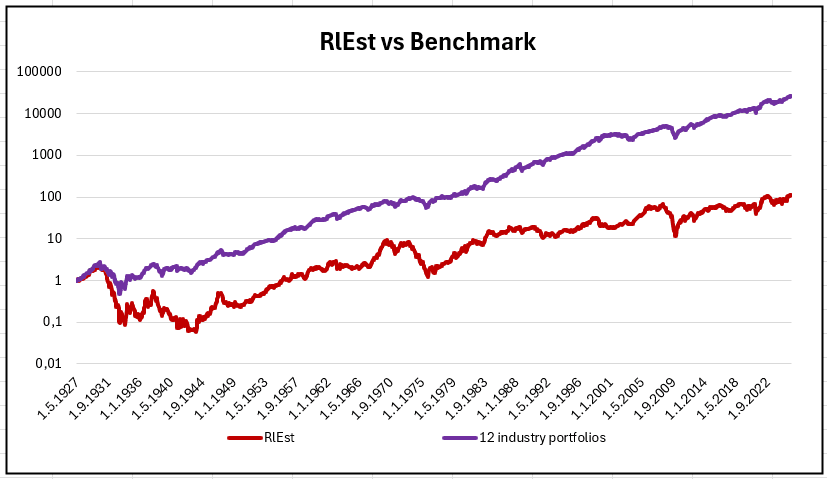
To ensure that the investment strategy is robust, we also compare it against a benchmark composed of the 12-industry portfolios from Fama-French, which represents the broader market through a diversification across 12 sectors. While RlEst focuses specifically on real estate, the 12-industry portfolios provides a broader market context for evaluation.
Historically, the real estate sector has experienced several notable crises. For instance, during the early 1930s, the U.S. real estate market suffered as part of the Great Depression. Although the Great Depression officially ended in the mid-1930s, outstanding debts and mortgage issues persisted for years, keeping property values and REIT returns under pressure. At the same time, the outbreak of war in Europe in 1939 created additional economic uncertainty. Investors worried about potential recessions or market volatility, contributing to drawdowns around 1940. In the 1970s, high inflation and economic stagnation affected property values. More recently, the 2008–2010 Global Financial Crisis, triggered by the U.S. housing bubble and mortgage defaults, led to severe declines in REIT valuations worldwide.
However, our main focus was whether any approach, based on long-term or medium-term anomalies, exists that could achieve a strong, profitable strategy capable of rivaling the market represented by the 12-industry portfolios, or if any systematic approach could improve return-to-risk ratios of the passive B&H strategy of holding REITs.
Methodology
As mentioned in the introduction, we utilized monthly data of the RlEst index, representing real estate trusts available in the 48-industry portfolios dataset, from July 1, 1926, to December 1, 2025. This dataset, as well as the benchmark dataset of the 12-industry portfolios, was sourced from Fama-French.
The strategies combined investing in RlEst with holding capital in cash, represented by the BIL ETF, sourced from Quantpedia’s Portfolio Analysis. This switching mechanism reflects a more realistic investment scenario.
Basic performance characteristics in each strategy characteristics table are presented as follows: the notation perf represents the annual return of the strategy, st dev stands for the annual standard deviation, max dd is the maximum drawdown, adjusted Sharpe r is calculated as the ratio of perf to st dev and adjusted Calmar r as the ratio of perf to max dd.
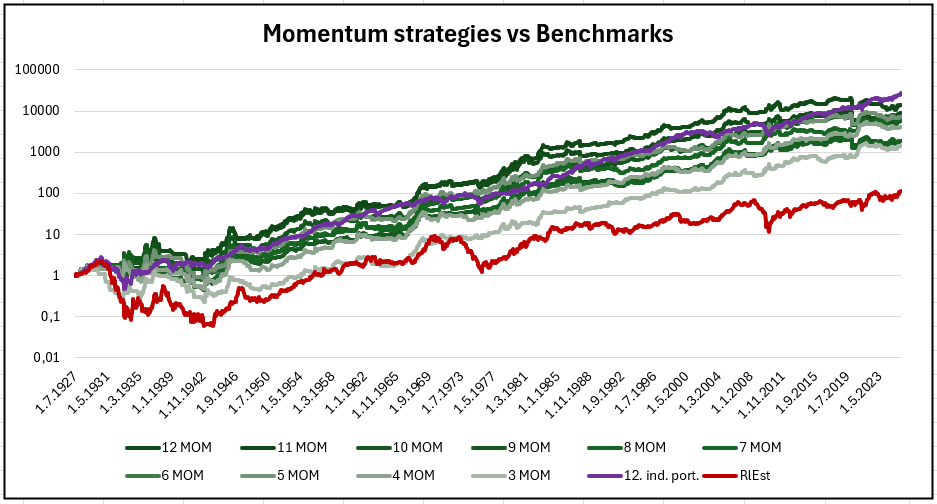
For better visualization, all graphs are presented on a logarithmic scale.
With the aim of identifying the most efficient approach, we tested several approaches, which are introduced separately. Each strategy is rebalanced monthly, starting with an initial portfolio value of 1.
Trend-following strategy
We began by examining a trend-following pattern using various forms of a moving average (MA). At the end of each month, the average RlEst value over the specified period was calculated. This value was then compared to the actual RlEst value for that month. When the actual value exceeded the moving average, a signal was generated to invest in RlEst in the following month. Otherwise, capital was held in cash. The process was repeated each month with the corresponding RlEst value and its moving average.
This methodology was applied 10 times, each with a different moving average window, starting with a 3-month (M) and 4-month period, and continuing up to a 12-month period.
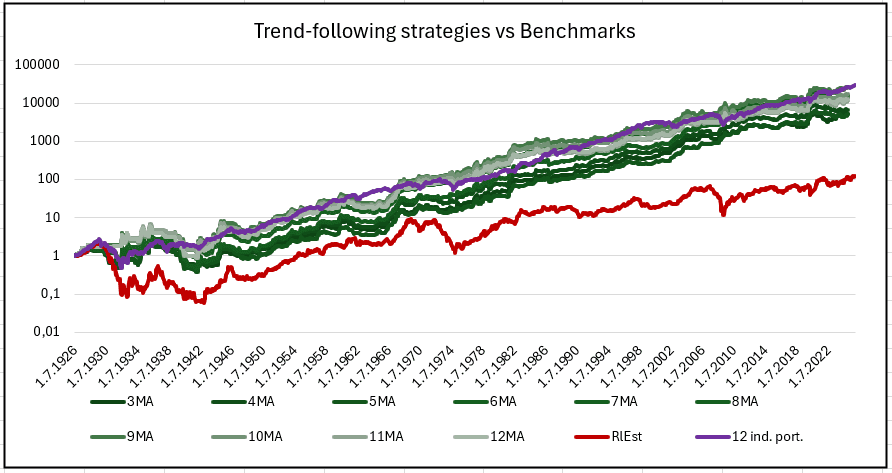
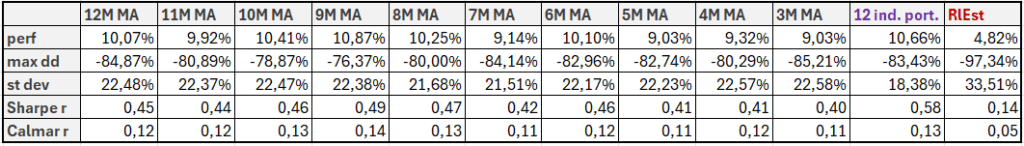
As shown in both Figure 4 and Table 1, all of the strategies easily outperformed the RlEst index, with Sharpe and Calmar ratios up to three times higher, demonstrating that the trend-following approach is applicable. However, compared to the broader market, represented by the 12-industry portfolios, the strategies are less effective. Although some moving average windows were more profitable and even outperformed the market during certain periods, ultimately all strategies achieved lower Sharpe and Calmar ratios than 12-industry portfolio.
Therefore, we proceeded to examine another anomaly.
Momentum strategy
The second strategy is based on the rate of change (momentum) of the RlEst value. At the end of each month, we calculated the momentum (MOM) of RlEst. If the momentum was positive, a signal was generated to invest in RlEst for the following month, otherwise, capital was held in cash. Similar to the trend-following strategy, this procedure was repeated on a monthly basis and tested across several time windows for momentum calculation, starting with a 3-month and 4-month period and continuing up to a 12-month period.
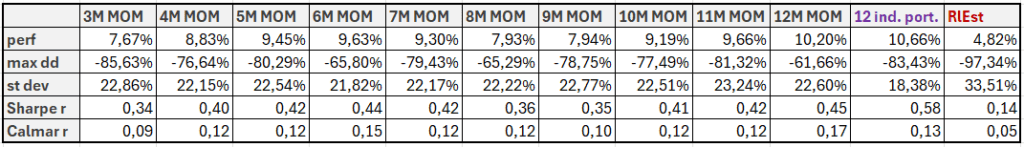
The behavior of the momentum strategies is very similar to that of the trend-following strategies. Each strategy was able to outperform the RlEst index, however, they were not as effective as the previous approach. Some strategies with longer momentum time windows were able to outperform the market for most of the time, but with the lower Sharpe and Calmar ratios.
After that we moved on to a different anomaly and sought to examine seasonality.
Seasonality
Seasonality in real estate trusts has not been as thoroughly examined as the previous anomalies, therefore, we were curious whether any time patterns could be used in trading. Each month, we examined whether the RlEst returns were positive a specific time ago in order to identify any repeating pattern that might indicate an upcoming profitable month. If the return was positive, we invested in RlEst for the following month, otherwise, no action was taken. For this analysis, we again tested several look-back periods, starting with 1-month and 2-month windows and continuing up to 12-month periods. This procedure was repeated on a monthly basis.
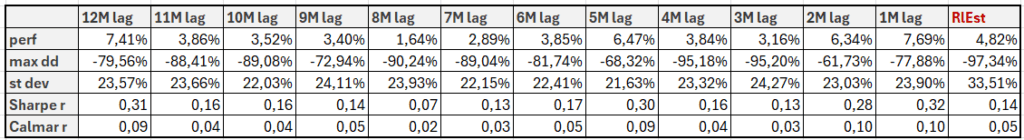
Results in Table 3 show that most effective is the approach with 12-month look-back period, which is the longest examined time window, and strategies with the shortest time window, using 1-month and 2-month look-back period. Therefore, we decided to combine these 3 approaches and create a composite strategy.
Average strategy
The new strategy combines three seasonality approaches using 1-month, 2-month, and 12-month look-back periods, as these achieved the most favorable results. Each month, we test whether to invest in RlEst for the following month based on its performance 1, 2, and 12 months earlier, evaluated separately. In the combined strategy, all three signals are then considered simultaneously, with each decision assigned a weight of 1/3.
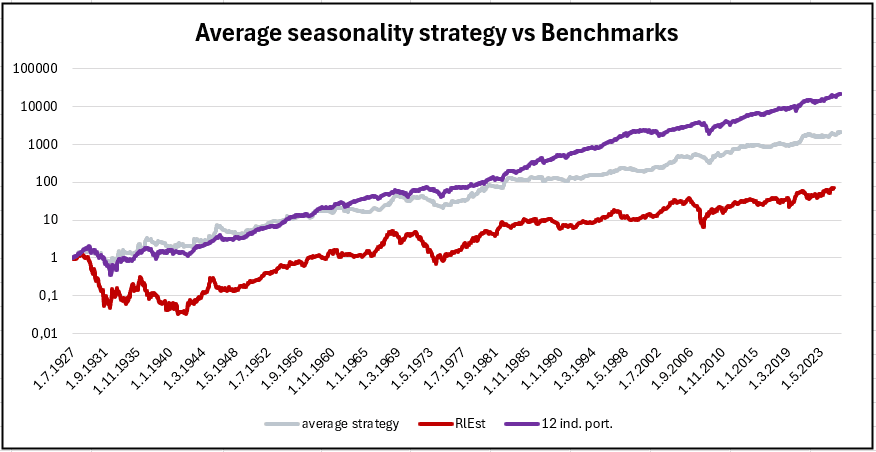
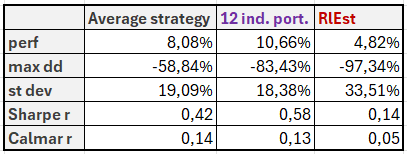
The combination of the 3 most effective seasonality approaches proved beneficial, achieving nice Sharpe and Calmar ratios and thus reflecting its effectiveness.
As a final attempt, we decided to enhance this average seasonality strategy by incorporating cash holdings. The procedure is almost the same -> when the analyzed return of the RlEst index in the past (1-, 2-, and 12-months ago) is positive, this generates a signal to invest in RlEst for the following month. Otherwise, the capital is held in cash. As before, this process was repeated on a monthly basis, separately considering the 1-month, 2-month, and 12-month seasonality look-back periods, with each signal assigned a weight of 1/3.
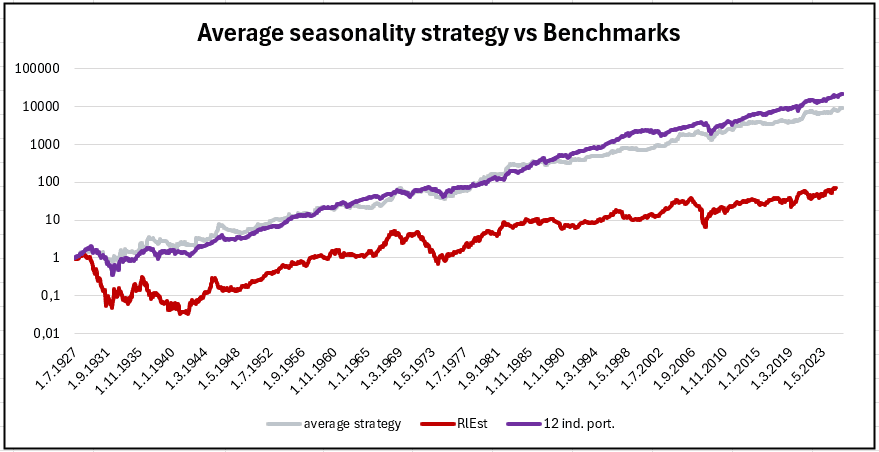
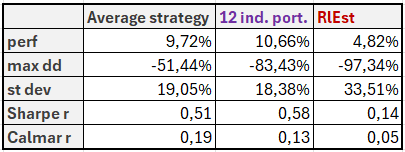
Considering holding capital in cash as an alternative to investing in RlEst improved the strategy, increasing the Sharpe ratio to 0.51 and the Calmar ratio to 0.19, which are the highest values achieved in this study. Composite seasonality strategy nearly matches performance and return-to-risk ratios of the broad equity market, which underscores the added value of seasonality signals.
One question still remains unanswered: why do the 12-month look-back period and the 1- and 2-month periods perform the best, even though they represent opposite ends of the time horizon?
One possible explanation is that the 1–2 month and 12-month look-back periods capture two different market effects. Short look-back periods, such as 1 or 2 months, may reflect short-term momentum or persistence in returns, where positive performance tends to continue briefly due to delayed investor reactions or market frictions. On the other hand, the 12-month look-back period is commonly associated with the well-documented long-term momentum effect observed in financial markets.
Intermediate horizons between these extremes may contain more noise or partial mean reversion, which weakens the predictive power of the signal. As a result, the very short-term and the longer-term signals can perform better, even though they represent opposite ends of the time horizon.
Another potential explanation relates to structural characteristics of REITs. Unlike typical equities, REITs distribute the majority of their income as dividends and operate within the slower-moving real estate market, where information and fundamental developments are incorporated into prices gradually. Short-term predictability may therefore reflect temporary continuation around dividend cycles, institutional fund flows, or delayed investor reactions to macroeconomic developments affecting the real estate sector. Meanwhile, the predictive power of the 12-month lag may capture longer-term persistence in property market fundamentals, annual portfolio rebalancing by institutional investors, or broader momentum effects that are well documented across equity markets. These mechanisms may coexist, leading to stronger signals at both very short and longer horizons, while intermediate horizons are more affected by noise and partial mean reversion.
Conslusion
The real estate trusts index itself could be consistently outperformed by all tested strategies. Both the trend-following and momentum approaches improved the risk-adjusted performance compared to holding the RlEst index alone. However, their performance remained below the 12-industry market benchmark when evaluated using Sharpe and Calmar ratios.
The most promising results were achieved with the seasonality-based strategies. In particular, combining the most effective seasonality signals with 1-month, 2-month, and 12-month look-back periods produced stronger results than the previously tested approaches. Further improvement was achieved when the strategy allowed capital to be held in cash during unfavorable periods. This final approach achieved the highest Sharpe and Calmar ratios within the study and came closest to matching the performance of the broader equity market.
Altough none of the tested strategies were able to consistently outperform the equity market benchmark represented by the 12-industry portfolios, the strategies significantly improved performance relative to the standalone RlEst index. This result may be partly explained by the fact that the troubled real estate sector historically experienced deeper drawdowns during major economic crises compared to the broader market. Adding a trend-following, momentum, and/or seasonality filter helps to mitigate losses in such crisis periods and should be thoroughly considered.
Author: Sona Beluska, Junior Quant Analyst, Quantpedia
Are you looking for more strategies to read about? Sign up for our newsletter or visit our Blog or Screener.
Do you want to learn more about Quantpedia Premium service? Check how Quantpedia works, our mission and Premium pricing offer.
Do you want to learn more about Quantpedia Pro service? Check its description, watch videos, review reporting capabilities and visit our pricing offer.
Do you want algorithmic access to the full Quantpedia database via the API? Subscribe to Quantpedia Pro, ask for an API key, and explore the in/out-of-sample statistics, source academic papers, and code snippets — ideal for quantitative research, systematic trading workflows, and AI model training.
Are you looking for historical data or backtesting platforms? Check our list of Algo Trading Discounts.
Or follow us on:
Facebook Group, Facebook Page, Twitter, Linkedin, Medium or Youtube
Share onLinkedInTwitterFacebookRefer to a friend


