Are There Seasonal Intraday or Overnight Anomalies in Bitcoin?
At Quantpedia, we love seasonality effects, and our screener includes several strategies that exploit them. These anomalies are fascinating since they usually offer a favorable risk and reward ratio and are commonly invested only during short periods. Frequently, these strategies are valuable additions to portfolios because they are not that sensitive to overall market performance. This short article presents a brief examination of some possible Bitcoin seasonalities.
If you are interested in more cryptocurrency research articles, then you are invited to visit our related page, or you can subscribe to Quantpedia Premium or Pro service, which also covers this asset class.
Seasonality Effects in Various Asset Classes
As we observe markets, we tend to identify various patterns that continuously repeat. As one of the most followed markets, the stock market is probably connected with most of the sayings, empirical observations, seasonality research, or even some legends like “sell in May and go away.” Although some proposed seasonalities might be far-fetched, there are plenty of sound and research-backed seasonality effects. In the stock market, there is sound evidence of many seasonality anomalies, e.g., the Turn of the Month effect (Xu and McConnell, 2006), Option-Expiration Week (Stivers and Sun, 2013), or Payday Anomaly (Ma and Pratt, 2018). However, the seasonality is not stock market exclusive. There is seasonality in Treasury bonds connected with auctions (Lou et al., 2013), annual rebalancing of the S&P GSCI index in commodities (Yan et al., 2019), or FOMC meetings and US dollar (Mueller et al., 2014). Overall, plenty of seasonality effects can be connected with a specific hour, day in the week/month, or even a more extended period. Regardless of the period, all effects have one common matter: abnormal performance during the timeframe. For example, there might be a large amount of capital that investors seek to allocate that creates upward pressure and stocks rise.
All the aforementioned effects are present in the developed markets that offer a long history either for empirical observations or thorough systematic analysis. Are there any seasonality effects in Bitcoin’s market? Indisputably, the BTC has attracted many, but there is high volatility, and the market is truly dynamic. This research aims to examine some possible seasonality effects in BTC using the hourly data from the Gemini exchange during 9.10.2015 – 3.2.2022.
One of the most recognized effects relates to the part of the day – the opening of the market, closing auction, overnight anomaly, intraday reversal, and many more daily effects were suggested by academics. However, the cryptocurrency markets are unique, and these crypto-assets are traded 24/7. Therefore, there is no “open” or “close” time. Although we can map the hours to when traditional markets are open, cryptos can still be traded outside these hours.
Main analysis
In our first examination, we map the Gemini hours to NYSE hours, and we examine the period when the NYSE is open (9:30-16:00). For BTC, we define the NYSE hours as 10:00-16:00 of NY local time (we miss half an hour to ensure that the NYSE is already open given our hourly granularity) to 15:00-21:00 UTC +0. Therefore, we define the intraday return as the return during 10:00-16:00, the overnight as return from 16:00 to 10:00 on the following day, and daily return as the return during 16:00 to 16:00 of the following day. Additionally, we define the days when the NYSE is closed (weekends and holidays) and the days when the NYSE is opened. To examine Bitcoin’s behavior, one can evaluate statistical properties, e.g., by plotting a boxplot.
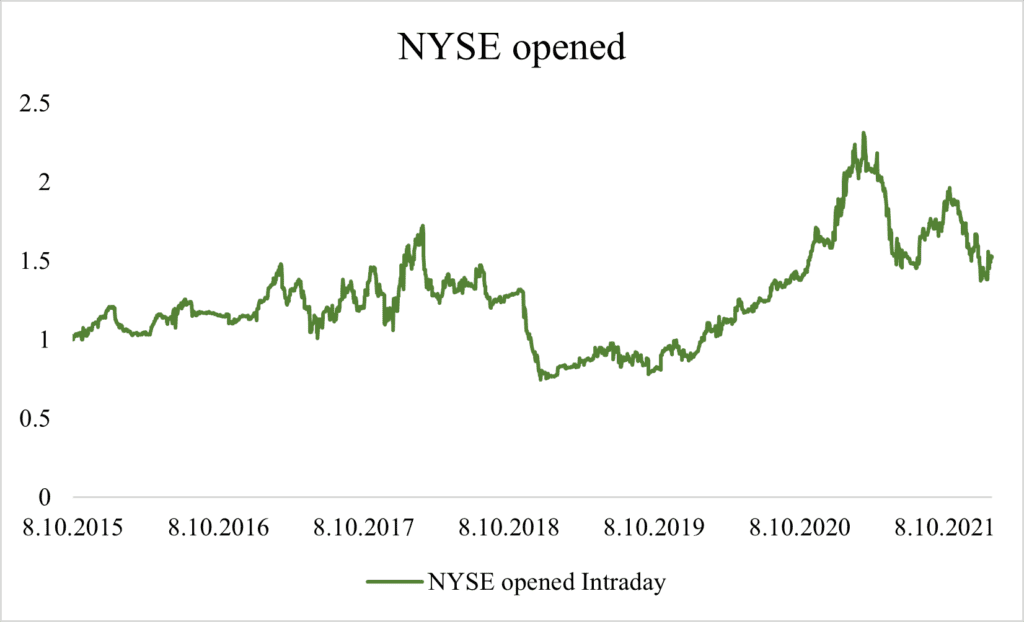
Secondly, by dividing returns into intraday, overnight, and daily components for days when NYSE is open or closed, one can examine the cumulative returns and empirically judge the properties during these distinct periods. Even though the crypto markets never close, defining the “intraday” and “overnight” components can be interesting since we can examine the performance when the main market is open. Additionally, it can represent the “core” daily hours when people (traders and investors) tend to be most active, at least on the traditional markets.
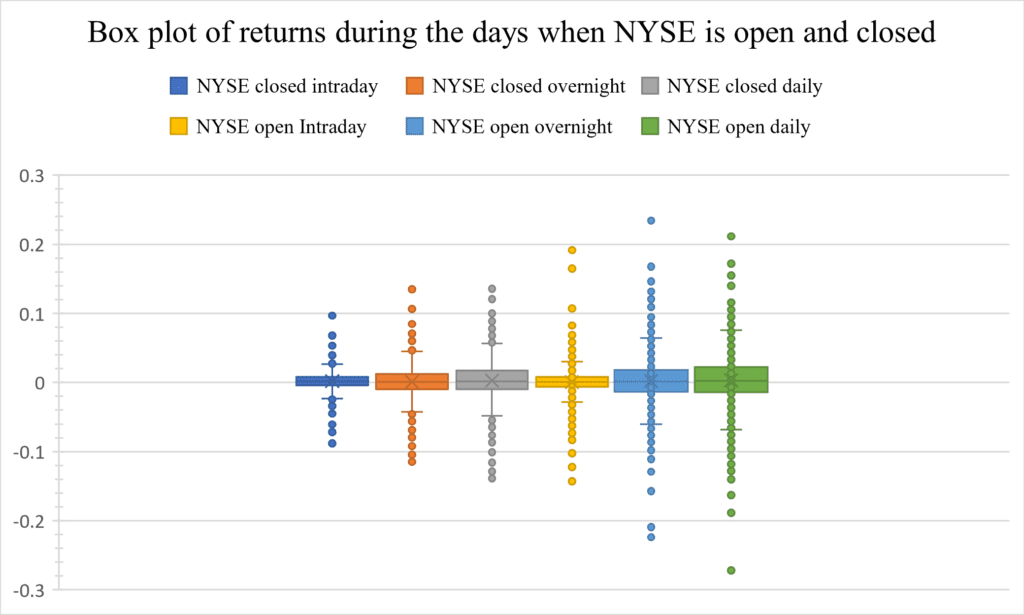
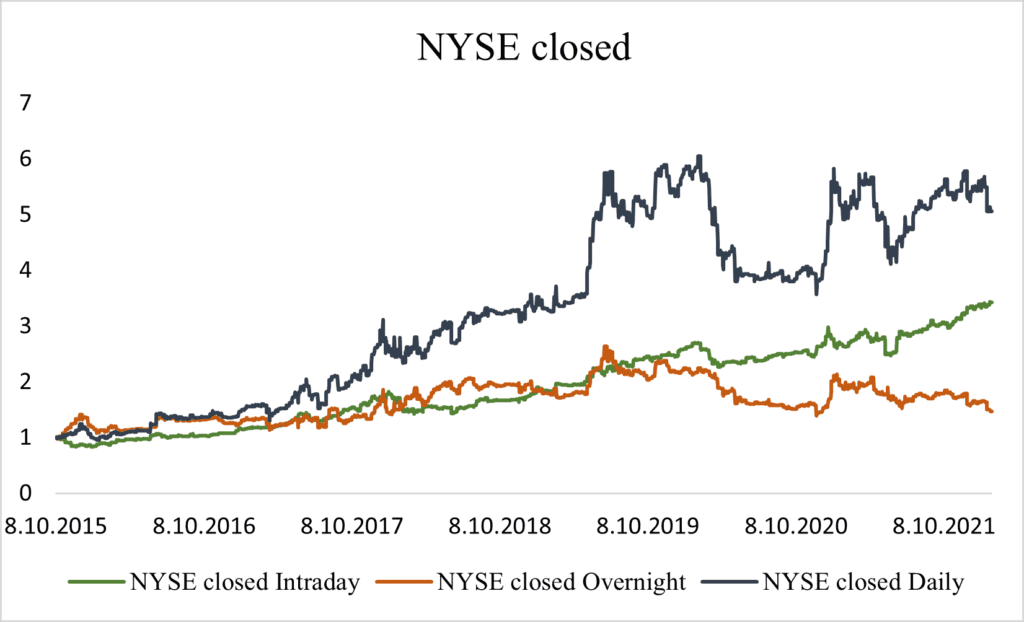
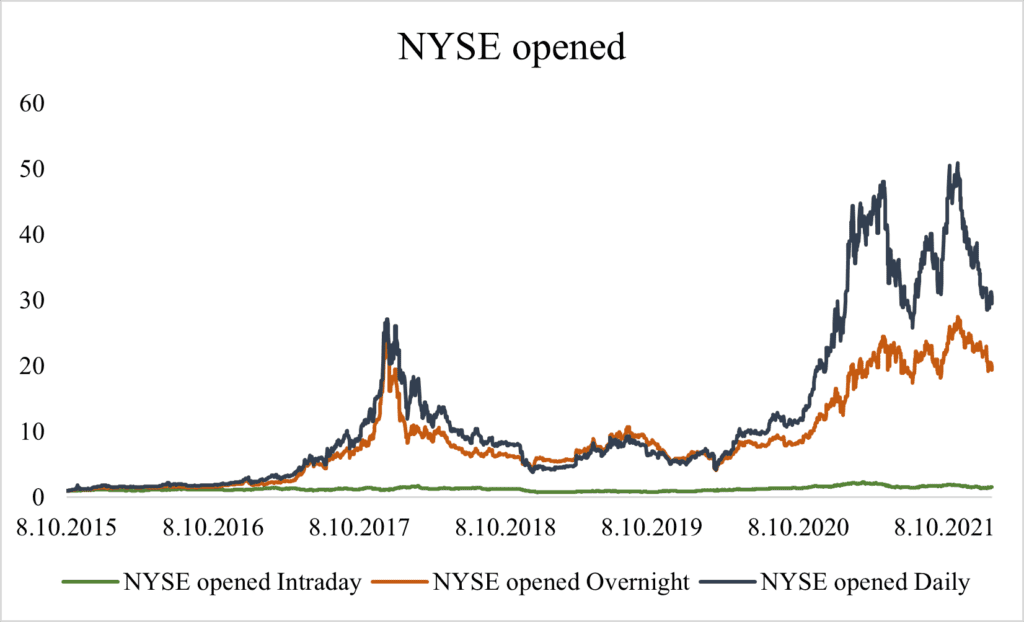
As expected, the most significant proportion of the overall return relates to the days when NYSE is open (there are more days like that). Several interesting properties can be observed during weekends and holidays. The intraday return is stronger and more stable than the overnight return. Conversely, this does not hold for the days when NYSE is opened. In this case, the overnight’s return dominates, and the intraday’s return is small and volatile.
Main Takeaways
So, what about the main takeaways? The weekends/holidays performance is driven mainly by the intraday’s component, and the overnight’s return is more volatile, at least from the US investor’s perspective. The opposite holds for the “normal” days when the NYSE is opened. The intraday return is relatively small and volatile, and the performance is driven mostly by the overnight component.
With the availability of the hourly data, we can also examine the hourly patterns in BTC. Are there significant differences during the day? Is there any period when it is best to hold the BTC? These are the questions we aim to answer in the following section.
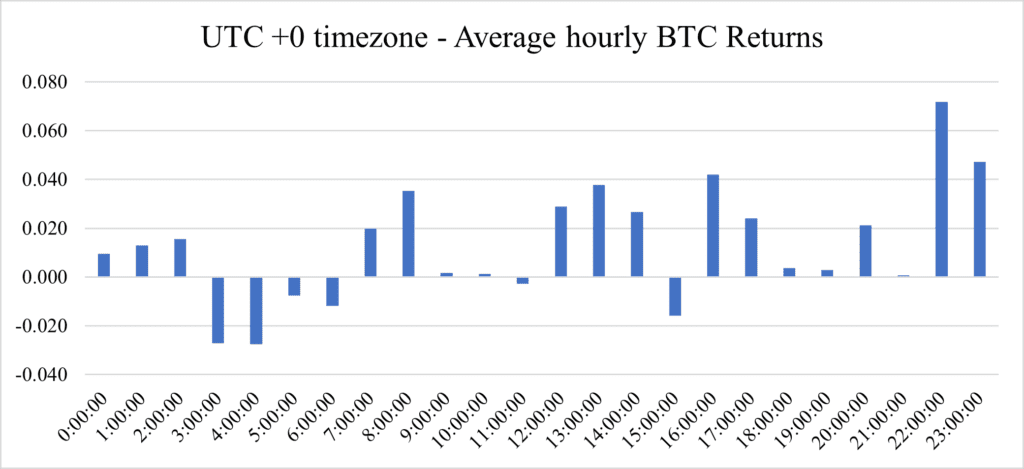
The hourly distribution of the daily returns is not uniform. There are several periods when the return is relatively small and economically insignificant. Furthermore, there are several hours when the BTC returns are above the average. In particular, the returns for 22:00 and 23:00 seem to be the most economically significant. On the other hand, the sample’s returns for 3:00 and 4:00 are the worst.
Which results are Significant and which are not?
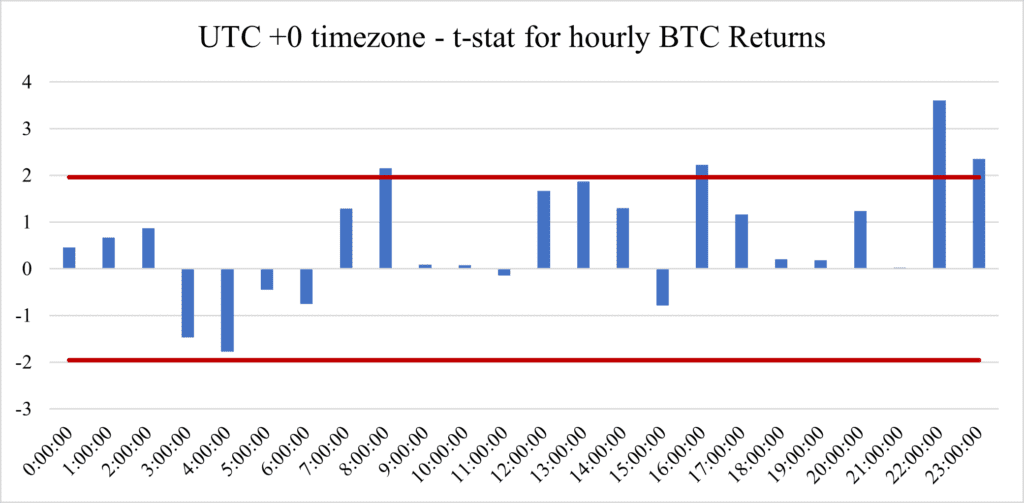
Nonetheless, the negative returns are insignificant, while several positive returns are statistically significant on the 5% level. From both statistical and economic points of view, the returns 22:00 and 23:00 dominate. Interestingly, all major markets are closed during this period. For UTC +0, the NYSE is open during 14:30 and 21:00, Tokyo Stock Exchange is also closed (it is opened from 00:00 to 06:00 of UTC +0 time), Hong Kong is also closed (it is opened from 01:30 to 08:00 of UTC +0 time), same as India (2:30 to 10:00 of UTC +0 time), and Australia is closed too (23:00 to 05:00 of UTC +0 time). Both London and continental Europe are closed during these significant hours since it is night there. Therefore, it seems that the best time to trade (and hold) BTC is when every other major exchange is closed.
Based on the previous results, we propose a simple seasonality strategy with a simple rule: buy Bitcoin at 21:00 (UTC +0) and sell it at 23:00 (UTC +0).
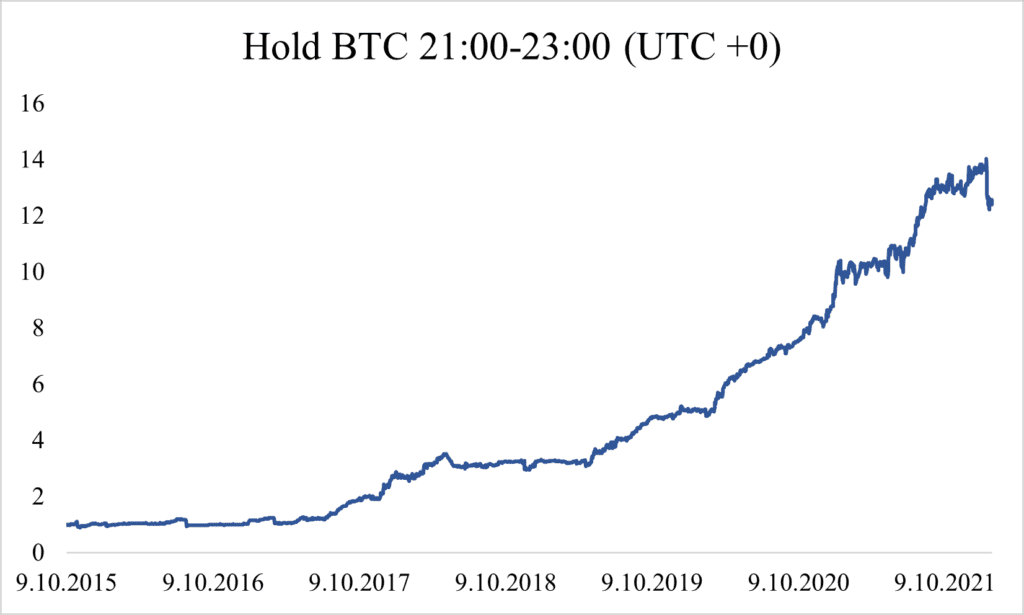
Compared to the BTC, the performance of the seasonality strategy is much more stable – the annualized volatility is 20.93%, and the maximum drawdown is only -22.45%. The annualized return is 33%.
Short conclusion
Firstly, we identified a major discrepancy among the intraday and overnight returns during the days when the NYSE is opened or closed (weekends and holidays). When the traditional market is closed, BTC has a strong intraday component and weak overnight component, and vice versa for the days when the NYSE is opened.
Secondly, we have examined the hourly patterns in Bitcoin’s return. Results also point to a systematical difference. There is no statistically negative hour, but the performance is worst during 03:00 and 04:00 (UTC +0). On the other hand, there are several hours when the BTC returns are statistically significant. The most sizeable and significant returns relate to the 22:00 and 23:00. We also show that based on this finding, it is possible to construct a simple seasonality based strategy that is invested only during the two hours of the day and can deliver sizeable annualized returns of 33% with much smaller risk than the passive BTC holding, either measured by the volatility or maximum drawdown.
Authors:
Matúš Padyšák, Senior Quant Analyst, Quantpedia.com
Radovan Vojtko, CEO & Head of Research, Quantpedia.com
Are you looking for more strategies to read about? Sign up for our newsletter or visit our Blog or Screener.
Do you want to learn more about Quantpedia Premium service? Check how Quantpedia works, our mission and Premium pricing offer.
Do you want to learn more about Quantpedia Pro service? Check its description, watch videos, review reporting capabilities and visit our pricing offer.
Are you looking for historical data or backtesting platforms? Check our list of Algo Trading Discounts.
Or follow us on:
Facebook Group, Facebook Page, Twitter, Linkedin, Medium or Youtube
Related Literature
Lou, Dong, Hongjun Yan, and Jinfan Zhang. “Anticipated and repeated shocks in liquid markets.” The Review of Financial Studies 26.8 (2013): 1891-1912.
Ma, Aixin and Pratt, William Robert, Payday Anomaly (September 28, 2018). Available at SSRN: https://ssrn.com/abstract=3257064 or http://dx.doi.org/10.2139/ssrn.3257064
Mueller, Philippe, Paolo Porchia, and Andrea Vedolin. “Policy Announcements in FX Markets.” London School of Economics and Political Science working paper (2014).
Stivers, Chris T. and Sun, Licheng, Returns and Option Activity over the Option-Expiration Week for S&P 100 Stocks (July 16, 2013). Journal of Banking and Finance, Vol. 37, pp. 4226-4240, November 2013., Available at SSRN: https://ssrn.com/abstract=1571786 or
Xu, Wei and Xu, Wei and McConnell, John J., Equity Returns at the Turn of the Month (July 2006). Available at SSRN: https://ssrn.com/abstract=917884 or http://dx.doi.org/10.2139/ssrn.917884
Yan, Lei and Irwin, Scott and Sanders, Dwight R., Is the Supply Curve for Commodity Futures Contracts Upward Sloping? (February 7, 2019). Available at SSRN: https://ssrn.com/abstract=3360787 or http://dx.doi.org/10.2139/ssrn.3360787
Share onLinkedInTwitterFacebookRefer to a friend


