Video Presentation for Bear Market Strategy

5.June 2019

We have a new Youtube video + online presentation for all people who liked our short article about the commodity strategy which can be used as a hedge / diversification during bear markets

Youtube video:


Online presentation:

"


Are you looking for more strategies to read about? Check http://quantpedia.com/Screener

Do you want to see the performance of trading systems we described? Check http://quantpedia.com/Chart/Performance

Do you want to know more about us? Check http://quantpedia.com/Home/About


Follow us on:

Facebook: https://www.facebook.com/quantpedia/

Twitter: https://twitter.com/quantpedia

Youtube: https://www.youtube.com/channel/UC_YubnldxzNjLkIkEoL-FXg


Continue reading

Quantpedia Update – 31st May 2019

31.May 2019

Two new strategies have been added:

#431 – Intraday Momentum in the Indian Equity Markets
#432 – Investment-Momentum Strategy

Two new related research papers have been included into existing strategy reviews. And three additional related research papers have been included into existing free strategy reviews during last few weeks.

Continue reading

Skewness / Lottery Effect in Commodities

30.May 2019

We at Quantpedia are continually building a database of ideas for quantitative trading strategies derived out of the academic research papers. Motivated by the recent fall of the S&P500 index at the end of 2018, we have added a new filtering field into our Screener, which you can use to find strategies that can be utilized as a hedge/diversification to equity market risk factor during bear markets. We would like to present one strategy that is profitable itself, but with an added value of negative correlation with the equity market, to be able to perform in the desired way also during the " bad" times.

The strategy we would be talking about can be found in our database under the name #281 – Skewness Effect in Commodities and is built on a research paper written by Fernandez-Perez, Frijns, Fuertes and Miffre – The Skewness of Commodity Futures Returns. Guys at AlphaArchitect have been really generous and they have provided a space for us to write a short article in which we 1) briefly discuss the lottery effect, 2) we discuss the research on this topic in the context of commodities, and 3) we conduct an independent replication effort of the commodity lottery effect identified in academic research.

Authors: Vojtko, Padysak

Title: Skewness Effect in Commodities

Link: https://alphaarchitect.com/2019/05/30/skewness-effect-in-commodities/

Shortly:

"Economies and markets have their seasonalities and cyclicality, where bull markets alternate with bear markets. Bull markets are connected with particularly good performance of the stocks and profiting investors. However on the other hand, during the bear markets, investors tend to lose in the falling equity market. Therefore, during these stressful times, it might be better for practitioners to invest in a portfolio that is negatively correlated with the equity market to gain profit instead of counting loses.

There is strong evidence that investors have a preference for lottery-like assets (the assets that have a relatively small probability of a large payoff or in other words, big skewness). Therefore, it should be profitable to not play the lottery, but rather be “the lottery ticket issuer“ by shorting the commodities with high skewness and going long commodities with low skewness. Additionally, commodities as an asset class are quite distinct from equities and therefore they can often be used as a diversifier to equities.

Lottery strategy in commodites

Clearly, the strategy is profitable, a dollar invested in 1991 would result in more than 9 dollars by 2019, which results in a yearly performance of nearly 8,5%. Moreover, the risk of the strategy is relatively low, with the maximal drawdown of around 16 %, which results in a return to a drawdown ratio of slightly more than 0,5.

Our research suggests that the performance of the equity market represented by the S&P500 index is negatively correlated with the performance of the skewness strategy. Therefore, if the equity market performs badly, our strategy should be still profitable.

What is more important, if we would look upon the worst months of S&P500 index (blue bars) and compare it with the performance of the strategy (orange bars), we would see the performance of the suggested strategy is at most times positive and therefore the investor would be able to hedge his equity portfolio.

Worst equity month performance vs. commodity strategy

To sum it up, the lottery anomaly in commodities is alive and performs in a desirable way also in the recent period. Moreover, the profitable strategy based on this anomaly could also serve as a hedge against equities and offer a profitable possibility to invest during times when equities are in bear markets.

Authors:
Radovan Vojtko, CEO, Quantpedia.com
Matus Padysak, Analyst, Quantpedia.com

"


Are you looking for more strategies to read about? Check http://quantpedia.com/Screener

Do you want to see the performance of trading systems we described? Check http://quantpedia.com/Chart/Performance

Do you want to know more about us? Check http://quantpedia.com/Home/About


Follow us on:

Facebook: https://www.facebook.com/quantpedia/

Twitter: https://twitter.com/quantpedia


Continue reading

Transaction Costs of Factor Strategies

25.May 2019

A very important research papers related to all equity factor strategies …

Authors: Li, Chow, Pickard, Garg

Title: Transaction Costs of Factor Investing Strategies

Link: https://papers.ssrn.com/sol3/papers.cfm?abstract_id=3359947

Abstract:

Although hidden, implicit market impact costs of factor investing strategies may substantially erode the strategies' expected excess returns. The authors explain these market impacts costs and model them using rebalancing data of a suite of large and longstanding factor investing indices. They introduce a framework to assess the costs of rebalancing activities, and attribute these costs to characteristics such as rate of turnover and the concentration of turnover, which intuitively describe the strategies' demands on liquidity. The authors evaluate a number of popular factor-investing strategy implementations and identify how index construction methods, when thoughtfully designed, can reduce market impact costs.

Notable quotations from the academic research paper:

"Factor investing strategies have become increasingly popular. According to data from Morningstar Direct, assets under management (AUM) in factor investing ETFs and mutual funds across global markets increased from just below US$75 billion in 2005 to more than US$800 billion by the end of 2016.

In practice, when a provider rebalances an index, most managers tracking it execute the necessary transactions near the close of the rebalancing day in order to minimize their portfolio’s tracking error. The fund managers may appear to be perfectly tracking the index; in another words, minimizing implementation shortfall, which is the aggregate difference between the average traded price and the closing price of each of the index's underlying securities on the rebalancing day. Thus, the total implementation cost of an index fund could be perceived as merely the sum of the explicit costs associated with trading, such as commissions, taxes, ticker charges, and so forth. This notion misses the propagating market impact that trading has on the index’s value. The large volume of buy and sell orders for the same securities, executed at the same time, can result in securities prices moving against the managers, producing losses for both the index and the fund investors. This implicit cost is often overlooked because it is not visible when comparing a fund’s net asset value (NAV) and the index’s value; it can, however, be overwhelmingly large relative to the explicit costs for strategies with massive AUM. This article focuses on unmasking the market impact costs that arise from synchronous buying and selling.

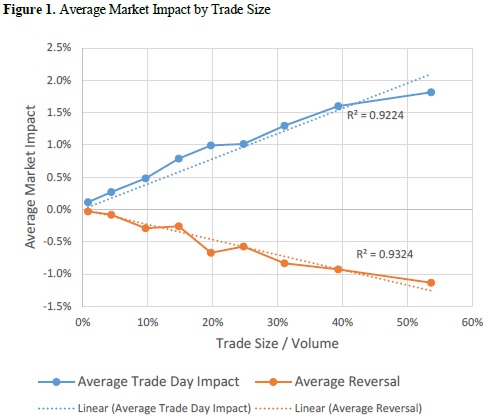
We analyze the behavior of stocks that were traded during the rebalancing of 49 FTSE RAFI™ Indices (henceforth, “the indices”). We find significant evidence of market impact on the rebalancing day and a subsequent price reversal over the next four days. We find that the magnitude of price impact is predictable, because it is directly related to the security’s liquidity and the size of the trade.

Specifically, we identify that a fund incurs approximately 30 basis points (bps) of trading costs due to market impact for every 10% of a stock’s average daily volume (ADV) traded in aggregate by the factor investing index–tracking funds.

Market Impact

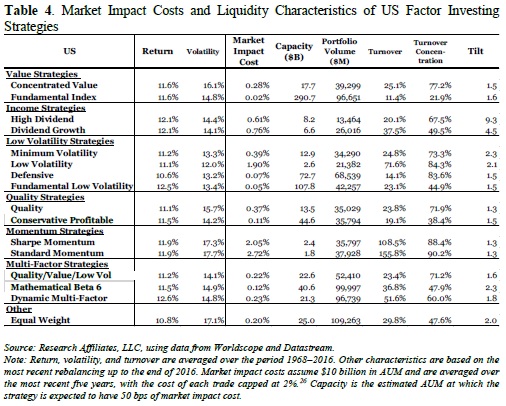
Our simple relationship of market impact versus the security’s liquidity and the size of the trade can be used to estimate the implicit transaction costs of rebalancing trades. We apply our model and evaluate the costs of an extended list of popular strategies with various turnover rates, trade sizes, levels of security liquidity, and number of rebalances. We find that, at a modest level of AUM, and assuming all rebalancing trades occur near the end of
the rebalancing date, the expected transaction costs can significantly erode the expected alpha as indicated by long-term historical backtests. Specifically, with as little as $10 billion in AUM, momentum indexing strategies can have trading costs of 200 bps or more. At the same level of assets, income strategies’ costs are in the 60–80 bps range, and quality strategies’ costs fall below 40 bps. We report the capacities, defined as AUM when expected costs reach a high and fixed level (50 bps a year), of these strategies. We also present an attribution model to relate costs to strategy characteristics and explain in detail how certain styles of investing—for instance, those that trade frequently and those that trade completely in and out of a few illiquid positions—require higher costs than others.

Liquidity characteristics

"


Are you looking for more strategies to read about? Check http://quantpedia.com/Screener

Do you want to see performance of trading systems we described? Check http://quantpedia.com/Chart/Performance

Do you want to know more about us? Check http://quantpedia.com/Home/About


Follow us on:

Facebook: https://www.facebook.com/quantpedia/

Twitter: https://twitter.com/quantpedia


Continue reading

The Impact of Crowding on Alternative Risk Premiums

17.May 2019

Related to all factor strategies …

Author: Baltas

Title: The Impact of Crowding in Alternative Risk Premia Investing

Link: https://papers.ssrn.com/sol3/papers.cfm?abstract_id=3360350

Abstract:

Crowding is a major concern for investors in the alternative risk premia space. By focusing on the distinct mechanics of various systematic strategies, we contribute to the discussion with a framework that provides insights on the implications of crowding on subsequent strategy performance. Understanding such implications is key for strategy design, portfolio construction, and performance assessment. Our analysis shows that divergence premia, like momentum, are more likely to underperform following crowded periods. Conversely, convergence premia, like value, show signs of outperformance as they transition into phases of larger investor flows.

Notable quotations from the academic research paper:

"Crowding risk is listed as one of the most important impediments for investing in alternative risk premia. We contribute to this industry debate by exploring the mechanics of the various ARP in the event of investor flows, and study the implications of crowdedness on subsequent performance.

The cornerstone of our methodology is the classification of the ARP strategies into divergence and convergence premia. Divergence premia, like momentum, lack a fundamental anchor and inherently embed a self-reinforcing mechanism (e.g. in momentum, buying outperforming assets, and selling underperforming ones). This lack of a fundamental anchor creates the coordination problem that Stein (2009) describes, which can ultimately have a destabilising effect.

Divergence factor

Conversely, convergence premia, like value, embed a natural anchor (e.g. the valuation spread between undervalued and overvalued assets) that acts as an self-correction mechanism (as undervalued assets are no longer undervalued if overbought). Extending Stein’s (2009) views, such dynamics suggest that investor flows are actually likely to have a stabilising effect for convergence premia.

Convergence premia

In order to test these hypotheses we use the pairwise correlation of factor-adjusted returns of assets in the same peer group (outperforming assets, undervalued assets and so on so forth) as a metric for crowding.

We provide empirical evidence in line with these hypotheses. Divergence premia within equity, commodity and currency markets are more likely to underperform following crowded periods.

All divergence premias

Whereas convergence premia show signs of outperformance as they transition into phases of higher investor flows.

All convergence premias"


Are you looking for more strategies to read about? Check http://quantpedia.com/Screener

Do you want to see performance of trading systems we described? Check http://quantpedia.com/Chart/Performance

Do you want to know more about us? Check http://quantpedia.com/Home/About


Follow us on:

Facebook: https://www.facebook.com/quantpedia/

Twitter: https://twitter.com/quantpedia


Continue reading

Quantpedia Update – 16th May 2019

16.May 2019

Two new strategies have been added:

#429 – CAPE Sector Picking Strategy
#430 – Volatility-Weighted Short-Term Reversal Strategy in Emerging Market Equities

Two new related research papers have been included into existing strategy reviews. And two additional related research papers have been included into existing free strategy reviews during last few weeks.

Continue reading

Subscribe for Newsletter

Be first to know, when we publish new content


    logo
    The Encyclopedia of Quantitative Trading Strategies

    Log in