Once again, our favorite type of study – an out of sample research study based on data from 19th and beginning of 20th century. Interesting research paper related to all equity momentum strategies …
Authors: Trigilia, Wang
Title: Momentum, Echo and Predictability: Evidence from the London Stock Exchange (1820-1930)
Link: https://papers.ssrn.com/sol3/papers.cfm?abstract_id=3373164
Abstract:
We study momentum and its predictability within equities listed at the London Stock Exchange (1820-1930). At the time, this was the largest and most liquid stock market and it was thinly regulated, making for a good laboratory to perform out-of-sample tests. Cross-sectionally, we find that the size and market factors are highly profitable, while long-term reversals are not. Momentum is the most profitable and volatile factor. Its returns resemble an echo: they are high in long-term formation portfolios, and vanish in short-term ones. We uncover momentum in dividends as well. When controlling for dividend momentum, price momentum loses significance and profitability. In the time-series, despite the presence of a few momentum crashes, dynamically hedged portfolios do not improve the performance of static momentum. We conclude that momentum returns are not predictable in our sample, which casts some doubt on the success of dynamic hedging strategies.
Notable quotations from the academic research paper:
"This paper studies momentum and its predictability in the context of the �rst modern stock market, the London Stock Exchange (LSE), from the 1820s to the 1920s.
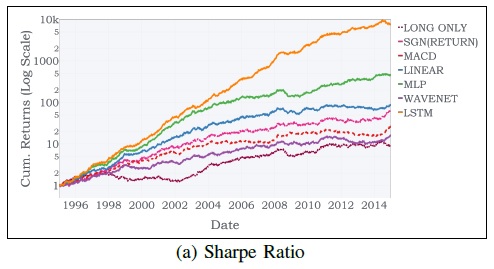
Factors' performance. Compared to the U.S. post-1926, we �find that the market has been less profi�table – averaging 5% annually (but also less volatile). Its Sharpe ratio has been 0.34, not too far from the 0.43 of CRSP. The Small-Minus-Big (SMB) factor delivered a 4.85% average annual return, much higher than that found in U.S. post-1926. The risk-free rate, as proxied by the interest on British Government's consols, has been close to 3.3% throughout the period, despite the many large changes in supply (i.e., in the outstanding stock of public debt). As for momentum (UMD), consistent with the existing evidence it has been the most profi�table factor – with an average annual return close to 9% – and the most volatile – with 20% annual standard deviation.
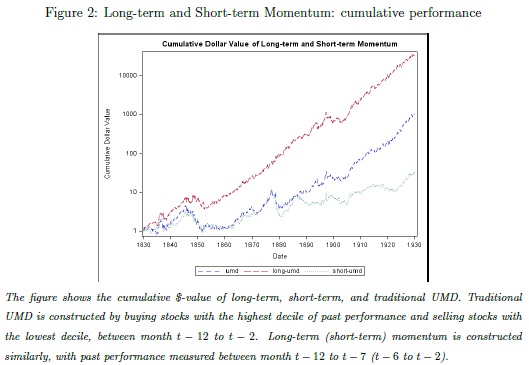
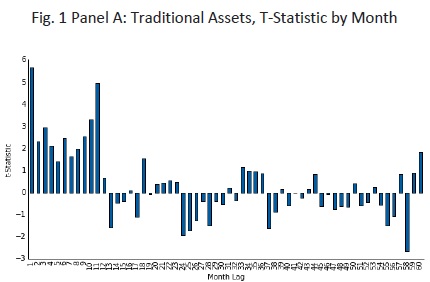
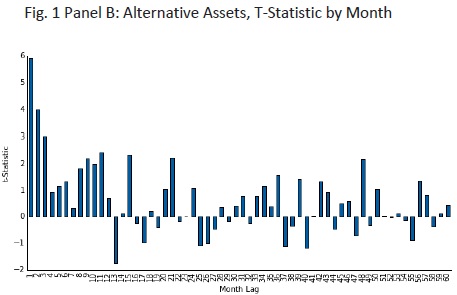
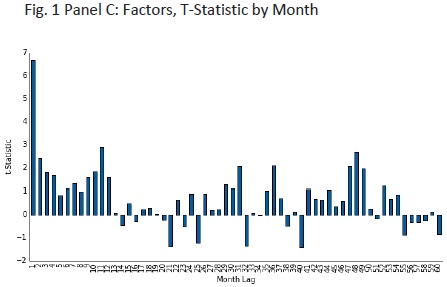
Dissecting momentum returns. Recent literature debates whether momentum is long or short term. In our sample, UMD profi�ts strongly depend on the formation period: they average at 10.6% annually for long-term formation (12 to 7 months) and 3.8% for short-term formation (6 to 2 months). So, our out-of-sample test confi�rms that momentum is better described as a within-year echo.
To investigate the role of fundamentals as drivers of price momentum, we construct two sets of earnings momentum portfolio. The �first earnings momentum portfolio is constructed based on the past dividend paid by the �firm relative to its market cap. The portfolio buys stocks of the highest dividend-paying �firms over a 12 to 2 months formation period, and shorts the stocks of the lowest ones. We �find strong evidence that our dividend momentum (DIV) strategy is pro�fitable across our sample: it yields a 5% average annual return with a standard deviation of 12%.
The second earnings momentum portfolio is constructed based on the dividend innovations. Speci�cally, we look at the change of dividend year to year, and construct the DIV portfolio. The portfolio buys stocks with the highest change in dividend paid and shorts the stocks with the lowest ones. The �DIV portfolio yield an over 24% return with a standard deviation of only 13.2%.
To discern whether price momentum seems driven by dividend momentum, we also test whether the alpha of the static UMD portfolio remains signi�ficant and positive after we control for the Fama-French three factors plus the dividend momentum portfolio. In the EW sample, price momentum delivers excess returns of about 8.8% after controlling for the Fama-French three factors, signifi�cant at the 1%. However, introducing DIV momentum reduces the alpha to 2.9%, and the alpha is insigni�ficantly di�fferent from zero. As for VW portfolios, they deliver higher alphas but are less precisely estimated. In this case, the annualized alpha of price momentum drops by half from 11.2% to 5.8% after controlling for �DIV momentum.
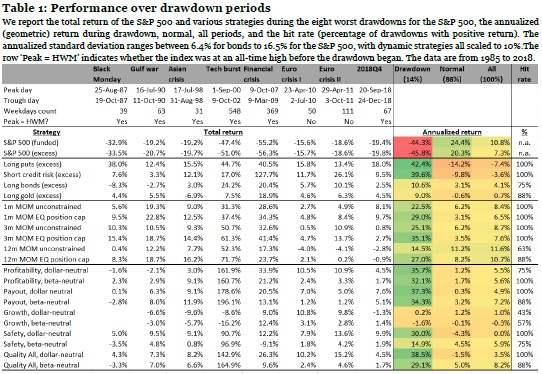
Momentum crashes. We �find that the distribution of monthly momentum returns is left skewed and displays excess kurtosis. Within the �five largest EW (VW) momentum crashes, investors lost 18% (26%) on average. The difference between the beta of the winners and that of the losers has been -2.4 (-3.5), on average, and the losses stemmed mostly from the performance of the losers, which averaged at 24% (21%) monthly return. We �find little action in the winners portfolio, which returned on average 2% (-6%).
Predictability and dynamic hedging. Dynamic hedging consists in levering the portfolio when its realized volatility has been low and/or the market has been under-performing, and de-levering otherwise. We begin our analysis by looking at whether set of variables helps predicting momentum returns in our sample, and we �find that it does not. Probably, this is because the crashes in our sample are more heterogeneous both in terms of origins and in terms of length. In particular, they do not necessarily occur when the market rebounds after a long downturn, and they tend to last for shorter periods of time. As a consequence, our out-of-sample test of the dynamic hedged UMD strategy shows that either it underperforms static momentum, or it does not improve its returns.
"
Are you looking for more strategies to read about? Check http://quantpedia.com/Screener
Do you want to see performance of trading systems we described? Check http://quantpedia.com/Chart/Performance
Do you want to know more about us? Check http://quantpedia.com/Home/About
Follow us on:
Facebook: https://www.facebook.com/quantpedia/
Twitter: https://twitter.com/quantpedia
Youtube: https://www.youtube.com/channel/UC_YubnldxzNjLkIkEoL-FXg