Every practitioner knows the pitch: a strategy with a Sharpe ratio of 1 and a t-stat above 2.0 must be a great business. But as Avramov, Bongaerts, Crego, and Kvaerner argue in their new paper, alpha tells you the return per dollar, not the size of the opportunity. The capacity of equity anomalies—the amount of capital a strategy can deploy before transaction costs eliminate its market-hedged return above cash—is a separate dimension that most of the literature ignores. Using stock-day estimates of spreads, price impact, and liquidity replenishment from NYSE TAQ data (2010–2023), the authors compute capacity for 35 characteristic-based anomalies and long–short factors and ask a simple question: are the anomalies that look biggest in return space also the biggest in deployable capital? For anyone allocating real money, the answer is no.
The headline finding is that alpha alone is an incomplete guide to scale. The two long legs with the highest gross alphas each support less than $2 billion of market-hedged capital, while lower-alpha profitability and cash-flow strategies support $20–33 billion; the profit-margin anomaly has roughly two-fifths the alpha of the highest-5-day-return strategy yet 97 times the capacity. Most of the cross-strategy dispersion comes from price impact, driven by two portfolio features: how much a strategy trades (turnover) and how liquid the underlying stocks are. Short-term reversal turns over 1.8 times per month and pays 1.6% per month in impact costs at $10 billion; the Amihud strategy barely trades (0.12 turns) but pays 1.2% because it holds illiquid names. Among factors with positive capacity, the median supports $1.53 billion—right around the median hedge fund’s $1.1 billion in net assets, a sobering benchmark for anyone running a factor book.
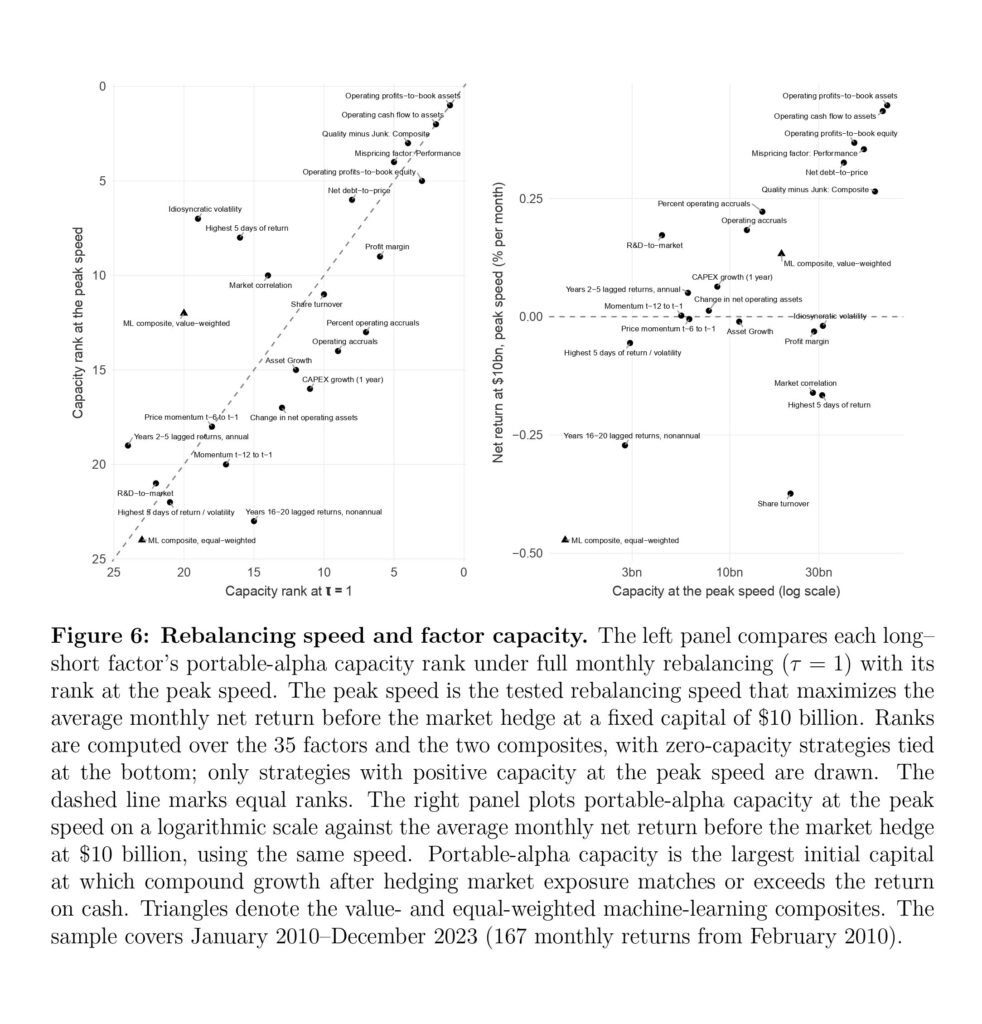
The actionable takeaway for portfolio managers is that execution and rebalancing design can dramatically change the economics. Slower rebalancing via partial adjustment raises median factor capacity thirteenfold, and the value-weighted machine-learning composite expands from $177 million to $19 billion through partial adjustment alone—without changing the signal itself. Capacity rankings are largely preserved (rank correlation of 0.93), with profitability and quality factors near the top, but idiosyncratic volatility and short-term reversal climb while accrual and investment factors fall. The practical lesson: before sizing any equity anomaly allocation, measure its trading capacity—not just its backtested return—because the difference between a $200 million niche and a $20 billion institutional strategy is written in the liquidity of what you trade and the speed at which you trade it.
Authors: Doron Avramov, Dion Bongaerts, Julio A. Crego, and Jens Soerlie Kvaerner
Title: The Capacity of Equity Anomalies
Link: https://ssrn.com/abstract=7524338
Abstract:
This paper measures the capacity of equity anomalies: how much capital investors can deploy before trading costs eliminate market-hedged returns above cash. Using stock-day estimates of spreads, price impact, and liquidity replenishment, we compute capacity for 35 anomalies. Alpha alone is an incomplete guide to scale. The highest-alpha long legs each support less than $2 billion, while lower-alpha profitability strategies support $ 20–33 billion. Price impact drives most cross-strategy dispersion through turnover and stock liquidity. Slower rebalancing changes the economics: median factor capacity rises thirteenfold, and the value-weighted machine-learning strategy expands from $177 million to $19 billion through partial adjustment alone.
As always, we present several interesting figures and tables:
Notable quotations from the academic research paper:
“Empirical asset pricing typically evaluates an investment signal by its return per dollar: alpha, Sharpe ratio, or statistical significance. Yet the economic magnitude of a return opportunity also depends on how much capital can earn that return. We estimate the capacity of equity anomalies—the amount of capital that can be deployed before trading costs eliminate market-hedged returns above cash—and ask whether the anomaly opportunities that look largest in return space are also the largest in deployable capital. Our main object, portable-alpha capacity, is the largest initial allocation for which a strategy, after trading costs and a market hedge, compounds at least as fast as cash.
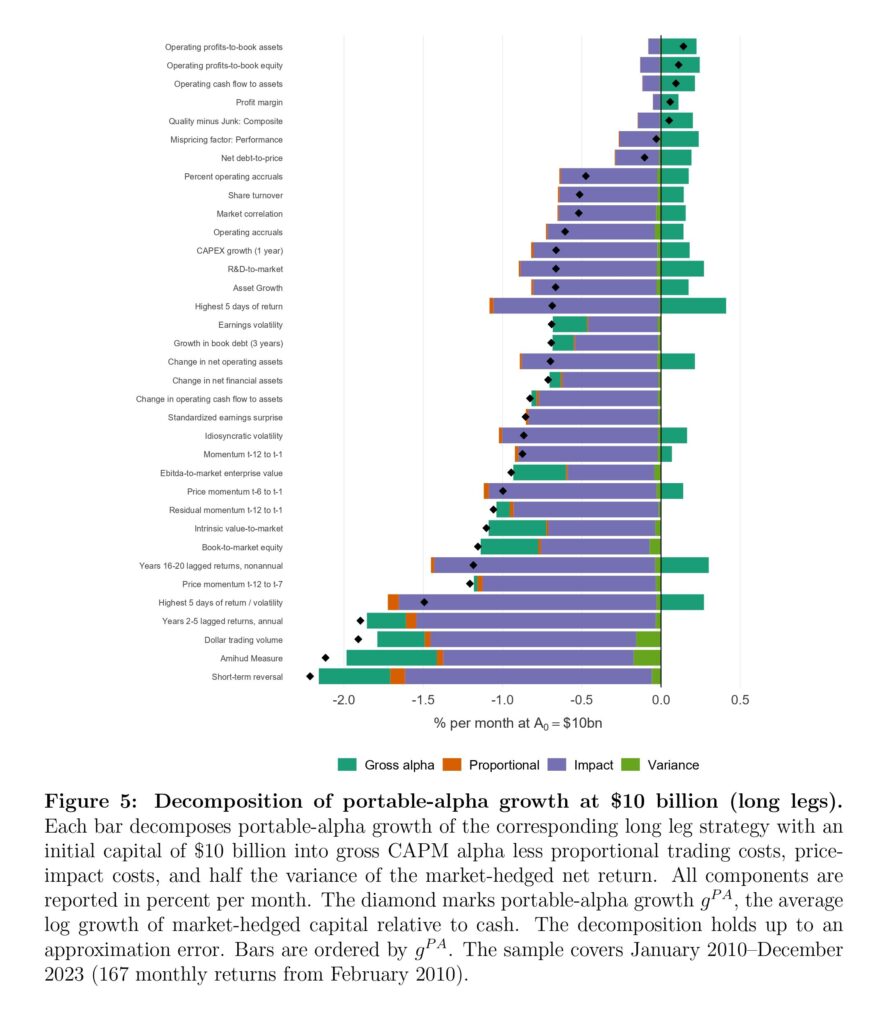
Price impact behaves differently: larger portfolios require larger trades, and those trades place greater demands on available liquidity. Alpha alone provides an incomplete picture of the economic magnitude of return predictability. The two long legs with the highest gross alphas each support less than $2 billion of market-hedged capital. Profitability and cash-flow strategies with substantially lower alphas, by contrast, support $20–33 billion. Among strategies with positive capacity, the ranking by deployable capital differs substantially from the ranking by alpha.
The cross-sectional differences in capacity come mainly from price impact. At institutional scale, two features of the portfolio matter: how much it trades and how costly the underlying stocks are to trade. The Amihud Measure strategy turns over only 0.12 times per month, but at $10 billion it incurs impact costs of 1.2% of capital per month because it trades illiquid stocks. Short-term reversal holds more liquid stocks, but turnover of 1.8 times per month produces impact costs of 1.6% per month. Among factors with positive capacity, the median supports $1.53 billion, compared with $1.32 billion for the median long leg with positive capacity.
Figure 5 shows the decomposition for all 35 long legs. Price impact accounts for most of the differences in trading costs across anomalies. At $10 billion, monthly impact costs are a few tenths of a percent or less for the most scalable strategies, but exceed 1.5% for the least scalable. Proportional costs and variance drag are considerably smaller for most anomalies.
When τ < 1, adjustment is gradual. Positions in stocks that leave the target quintile are reduced over subsequent months rather than closed immediately. Among factors with positive capacity, the median rises from $1.5 billion to $21 billion, and the median strategy-level increase is thirteenfold. The value-weighted machine-learning composite’s capacity rises from $177 million to $19 billion, while the equal-weighted composite’s rises approximately one hundredfold, from $13 million to $1.3 billion.”
Are you looking for more strategies to read about? Sign up for our newsletter or visit our Blog or Screener.
Do you want to learn more about Quantpedia Premium service? Check how Quantpedia works, our mission and Premium pricing offer.
Do you want to learn more about Quantpedia Pro service? Check its description, watch videos, review reporting capabilities and visit our pricing offer.
Do you want algorithmic access to the full Quantpedia database via the API? Subscribe to Quantpedia Pro, ask for an API key, and explore the in/out-of-sample statistics, source academic papers, and code snippets — ideal for quantitative research, systematic trading workflows, and AI model training.
Are you looking for historical data or backtesting platforms? Check our list of Algo Trading Discounts.
Or follow us on:
Facebook Group, Facebook Page, Telegram, Twitter, Linkedin, Medium or Youtube
Share onLinkedInTwitterFacebookRefer to a friend