Avoid Equity Bear Markets with a Market Timing Strategy – Revisiting Our Research
In March, we posted a series of three articles where our goal was to construct a market timing strategy that would reliably sidestep the equity market during bear markets. Each article focused on trading signals based on a specific group of indicators, namely, price-based indicators, macroeconomic indicators, and a leading indicator, a yield curve, that can predict recessions and bear markets in advance. After incorporating ideas from all three groups, we presented our final trading strategy that yields an annual return above that of the stock market while doubling its Sharpe ratio and reducing maximal drawdown by two-thirds. The strategy used signals from the Treasury spread, a 200-day SMA, and an alternative risk metric, the Rachev ratio, as trend indicators, while Real Retail Sales Growth, Industrial Production Growth, and S&P Composite dividends as macroeconomic indicators.
In this article, we revisit our research to address the forward-looking bias in our final market timing strategy, TrendYCMacro. We are grateful to Allocate Smartly for pointing out this limitation in our analysis. Upon careful examination, we identified a bias in our macroeconomic trading signal based on the U.S. S&P Composite dividends, which we also used in our final strategy. The bias arose from data sourced from Robert Shiller’s website, where the monthly dividend series was constructed by interpolating quarterly data. As we evaluated the signal on a monthly basis, we inadvertently made investment decisions based on future information without being aware of the interpolation.
To eliminate the issue, we have replaced the signal from U.S. S&P Composite dividends with Housing Starts Growth sourced from FRED, ensuring the strategy is no longer biased. The trading rule for the Housing Starts signal is as follows: HOUSE buys or stays long the MKT if Housing Starts Growth (YoY) in the prior month is positive.
| After incorporating this adjustment, the trading rule for our final strategy is as follows: TrendYCMacro stays long MKT if the Trend and YC trading signals are both positive or RSALES, INDPROD, and HOUSE signals are jointly positive. Otherwise, the strategy switches out of the stock market. |
Note that the purpose of macro signals (RSALES, INDPROD, and HOUSE) is to keep the strategy invested in the stock market when the economy is strong, regardless of the minor price fluctuations of the market. This means that the strategy switches off the stock market only if both trend (Trend and YC) and macro (RSALES, INDPROD, and HOUSE) signals turn negative. It’s important to note that a positive macro signal alone (RSALES, INDPROD, and HOUSE are jointly positive) is not enough to force the strategy to return to the market; it requires either a positive trend signal (Trend and YC are both positive) or jointly positive trend (Trend and YC are both positive) and macro (RSALES, INDPROD, and HOUSE are jointly positive) signals. From a practical standpoint, we evaluate macro signals in the trading only if we were invested in the market last month. This additional condition ensures that the macro signals will keep us in the market if the economy is doing great, and only a positive trend signal or jointly positive trend and macro signals can switch us back into the market.
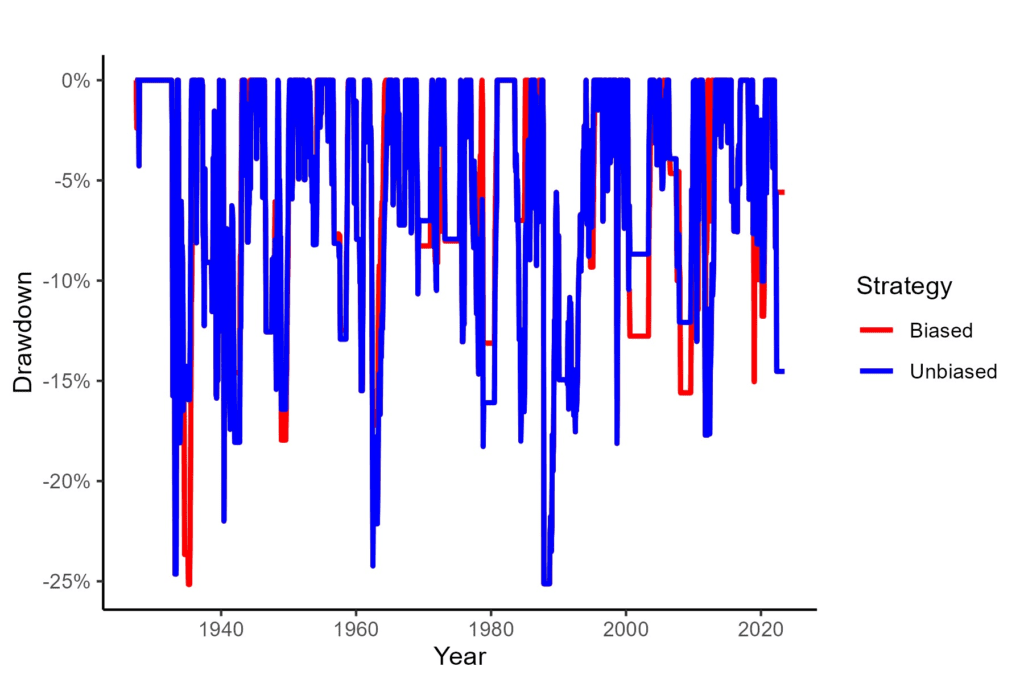
The unbiased version of our TrendYCMacro strategy, which uses the HOUSE signal, yields an annual excess return of 6.59%, slightly below the 7.10% of the biased version with the DIVIDEND signal. Interestingly, the unbiased version experiences slightly lower annualized volatility at 11.87% compared to the 11.89% of the biased version. Both versions have suffered the same maximal drawdown of -25.13% and exhibit comparable risk-adjusted returns, with the unbiased version having a Sharpe ratio of 0.56 and the biased version having a Sharpe ratio of 0.60.
| Strategy | Ann Return | Ann Volatility | Max DD | Sharpe Ratio | Calmar Ratio | Time In | Corr Naive |
| Unbiased | 6.59% | 11.87% | -25.13% | 0.56 | 0.26 | 66.67% | 0.845 |
| Biased | 7.10% | 11.89% | -25.13% | 0.60 | 0.28 | 64.50% | 0.838 |
The drawdown chart below clearly illustrates that both versions experienced major drawdowns similarly, highlighting that the HOUSE signal is a suitable replacement for the biased DIVIDEND signal.
For those interested in our full research, we provide a link to our revised paper, which includes an extended sample period ending in June 2023.
Authors: Ladislav Durian and Radovan Vojtko
Title: Avoid Equity Bear Markets with a Market Timing Strategy
Link: https://ssrn.com/abstract=4397638
Abstract:
In this paper, our goal is to construct a market timing strategy that would reliably sidestep the equity market during bear markets and thereby reduce market volatility and boost risk-adjusted returns. We build trading signals based on price-based indicators, macroeconomic indicators, and a leading indicator, a yield curve, that can predict recessions and bear markets in advance. Our best-performing strategy uses signals from the Treasury spread, a 200-day SMA, and an alternative risk metric, the Rachev ratio, as trend indicators, while Real Retail Sales Growth, Industrial Production Growth, and Housing Starts Growth as macroeconomic indicators. Based on the sample period from 1927 to 2023, it yields a market-beating annual excess return of 6.59% while nearly doubling the market Sharpe ratio to 0.56 and cutting the maximal drawdown by two-thirds to -25.13%.
Author:
Ladislav Durian, Quant Analyst, Quantpedia
Are you looking for more strategies to read about? Sign up for our newsletter or visit our Blog or Screener.
Do you want to learn more about Quantpedia Premium service? Check how Quantpedia works, our mission and Premium pricing offer.
Do you want to learn more about Quantpedia Pro service? Check its description, watch videos, review reporting capabilities and visit our pricing offer.
Are you looking for historical data or backtesting platforms? Check our list of Algo Trading Discounts.
Would you like free access to our services? Then, open an account with Lightspeed and enjoy one year of Quantpedia Premium at no cost.
Or follow us on:
Facebook Group, Facebook Page, Twitter, Linkedin, Medium or Youtube
Share onLinkedInTwitterFacebookRefer to a friend


