Avoid Equity Bear Markets with a Market Timing Strategy – Part 1
In this series of three articles, our goal is to construct a market timing strategy that would reliably sidestep the equity market during bear markets, thereby reducing market volatility and boosting risk-adjusted returns. We will build trading signals based on price-based indicators, macroeconomic indicators, and a leading indicator, a yield curve, that would try to predict recessions and bear markets in advance. All three articles would be published in a span of the next few days. We start with the first part – a short intro into the market timing strategies using price-based rules.
Introduction
Market timing is an act of moving in and out of a financial market based on some predictive methods. Its main objective is to reduce the risk associated with equity investments. Market timing does not attempt to beat the market on a performance basis. Given their lower volatility, market timing strategies aim to outperform the market on a risk-adjusted basis. Although by implementing leverage, it is also possible to beat the market on a performance basis. The only way market timing strategies can reduce market volatility is to avoid the large drawdowns that equities periodically produce. To reliably sidestep market downturns, it is necessary to know when they are likely to occur. The most straightforward approach would be to get out of the market whenever a negative trend arises.
The identification of the market trend can be realized through technical analysis, which is a methodology for analyzing and forecasting the direction of prices. A fundamental principle of technical analysis is that prices move in trends. Technical analysts believe that these trends can be identified in a timely manner to generate profits and limit losses. Trend following is an active trading strategy that implements this idea in practice. The most popular trend-following rules are the Momentum (MOM) rule and the Moving Average (MA) rule. In the MOM rule, a buy signal is generated when the current price is above its value n periods ago. In an MA rule, on the other hand, a buy signal is generated when the current price is higher than a moving average of prices over the past n periods. The most widely used MA strategy uses Simple MA (SMA), while others rely on Linear MA (LMA) and Exponential MA (EMA). A recent paper by Zakamulin and Giner (2018) compares these two most popular trend-following rules and finds that the MA rule has more robust forecast accuracy of the future direction of price trends compared to the MOM rule.
Market timing with moving averages has been the subject of substantial interest from academics and investors. In his book, Siegel (2008) investigates the use of the 200-day SMA in timing the Dow Jones Industrial Average (DJIA) from 1886 to 2006. His strategy bought the DJIA when it closed at least 1 percent above the 200-day moving average and sold the DJIA when it closed at least 1 percent below the 200-day moving average. He concludes that market timing improves the absolute and risk-adjusted returns over buying and holding the DJIA. In a similar manner, Faber (2013) introduces a market timing model called Global Tactical Asset Allocation (GTAA), consisting of five global asset classes, where he employs a 10-month SMA to evaluate whether to hold the assets on a monthly basis. In the 1973-2012 period, his model outperformed the S&P 500 index, achieving equity-like returns with bond-like volatility and drawdowns.
In this paper, we attempt to construct a market timing strategy that would reliably sidestep the equity market during bear markets and thereby reduce market volatility and boost risk-adjusted returns. Our investment universe consists of the market factor of Fama and French (MKT) and the risk-free rate (RF). MKT buys all CRSP firms incorporated in the US and listed on the NYSE, AMEX, or NASDAQ that have a CRSP share code of 10 or 11. RF is the one-month Treasury bill rate. At the end of each month, we evaluate whether the market will post a positive return over the next month, and we switch between the MKT and RF accordingly. Therefore, when we are not invested in MKT, we hold RF. Since Fama and French report MKT returns in excess of RF, we also report returns for all our strategies in excess of RF in the remainder of the paper. We sourced MKT excess returns from Kenneth French’s website for the period from July 1926 to June 2022, which is our sample period. Note that the first few months of the sample period are used to construct our strategies, and therefore the period for which we report results in our tables is slightly shorter than our initial sample period.
To gauge the relative performance of our model, we construct a Naive market timing strategy which would be our main benchmark for the rest of the paper. Naive buys or stays long the MKT if the MKT price is above its 200-day moving average. Otherwise, the strategy switches out of the stock market. Our first step would be to improve the Naive market timing using price-based indicators.
Market Timing Using Price-Based Indicators
One of the signals of an upcoming bear market in a stock is when the 50-day SMA crosses the 200-day SMA to the downside, an event referred to as the death cross. Similarly, the 50-day SMA crossing over 200-day SMA to the upside is an indication of an impending bull market in a stock, an event called a golden cross. In this manner, we construct the MA (50, 200) strategy that buys or stays long the MKT if its 50-day moving average is above the 200-day moving average. Otherwise, the strategy switches out of the stock market.
Another widely watched sign of an imminent market downturn is a spike in short-term volatility relative to long-term volatility. Therefore, we construct a trading strategy that buys equities only if the short-term volatility is below the long-term volatility. Specifically, VOL (50, 200) buys or stays long the MKT if the 50-day historical volatility, measured by the standard deviation of market returns is below the 200-day historical volatility. Otherwise, the strategy switches out of the stock market.
Volatility considers both extremely high and extremely low returns equally undesirable. Investors, however, want to limit only the downside risk and keep the upside unbounded. To this end, we decompose the market volatility into upside and downside volatility. In particular, we compute the upside (downside) volatility as the standard deviation of positive (negative) market returns over a given period. Thus, our strategy, VOL (200)+,- buys or stays long the MKT if the upside volatility over the past 200 days is greater than the downside volatility. Otherwise, the strategy switches out of the stock market.
The broad stock market is considered to have a negatively skewed distribution. The notion is that the market more often produces a small positive return relative to a large negative loss. However, during bear markets, the situation reverts and the market posts small losses more frequently than large gains. Several studies investigate the skewness effect and its implication for the cross-section of stock returns. Zaremba and Nowak (2015) found that country equity indices with the most negative historic skewness outperform those with the most positive skewness. Building upon their findings, we construct our SKEW (200) strategy that buys or stays long the MKT if the historic skewness measured by the skewness coefficient in the latest 200 days is below zero. Otherwise, the strategy switches out of the stock market.
Looking at the performance of our strategies so far, Table 1 shows that none of them exhibit better results than Naive, neither on a performance nor risk-adjusted basis. What’s more, some of them suffered drawdowns close to that of MKT. These weak results motivated us to dig deeper and look for more complex price indicators of the market trend, which led us to the Relative Strength Index.
The Relative Strength Index (RSI) is a momentum indicator used in technical analysis to measure the velocity and magnitude of price movements. As a momentum indicator, the RSI compares a security’s strength on days when prices go up to its strength on days when prices go down. Traders often use RSI to evaluate whether the security is overvalued or undervalued. Traditionally, RSI readings above the 70 level indicate that the security is overbought, and RSI readings below 30 imply that the security is oversold. However, RSI can also be used to identify a change in trend. A movement from below the centerline (50) to above indicates a bullish trend. A movement from above the centerline (50) to below indicates a bearish trend. Our RSI (200) strategy is based on the RSI crossovers the centerline as it buys or stays long the MKT when the 200-day Culter’s RSI is above 50. Cutler’s version of RSI uses SMAs for smoothing instead of EMAs. Otherwise, the strategy switches out of the stock market.
Another possibility to increase market risk-adjusted returns is to stay in the market only if, in the recent period market exhibited favorable risk-adjusted returns. We measure market risk-adjusted return using an alternative performance measure called the Rachev ratio (RR). RR, devised by Bulgarian mathematician Svetlozar Rachev measures the right-tail reward potential of a security relative to the left-tail risk. Stoyanov, Rachev, and Fabozzi (2005) defined the RR as a ratio of two Conditional Value at Risk (CVaR) values as follows:
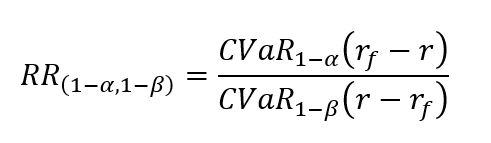
where r is a return on a portfolio or asset, rf is the risk-free rate and 𝛼, 𝛽 ∈ (0,1). Simply put, RR measures the ratio of 𝛼% best returns to 𝛽% worst returns. In our case, 𝛼 = 𝛽 = 0.5, and we compute the ratio using the latest 200 days. Our RR (0.5, 0.5) strategy buys MKT when the RR is greater than one. Otherwise, the strategy switches out of the stock market.
Table 1 displays that our two new strategies RSI (200) and RR (0.5, 0.5) did significantly better compared to our former strategies MA (50, 200), VOL (50, 200), VOL (200)+,- and SKEW (200). RSI (200) exhibits an annual excess return of 6.40%, which is greater than the 6.30% p.a. achieved by the Naive strategy. Besides, RSI (200) performed better against Naive in terms of the Calmar ratio, although it fell short in terms of the Sharpe ratio. RR (0.5, 0.5) did even better, achieving a return of 6.57% p.a., outperforming MKT on a performance basis. However, it still underperformed Naive on a risk-adjusted basis, as measured by the Sharpe ratio. Note that RSI (200) and RR (0.5, 0.5) are similar strategies displaying a correlation of 0.987.
Table 1: Performance summary of price-based market timing strategies for the period from April 1927 to June 2022. The best-performing strategies are shaded.
| Strategy | Ann Return | Ann Volatility | Max DD | Sharpe Ratio | Calmar Ratio | Time In | Corr Naive |
| MKT | 6.56% | 18.55% | -84.63% | 0.35 | 0.08 | 100.00% | 0.647 |
| Naive | 6.30% | 12.06% | -54.97% | 0.52 | 0.11 | 67.54% | 1.000 |
| MA (50, 200) | 5.01% | 12.22% | -64.63% | 0.41 | 0.08 | 67.37% | 0.877 |
| VOL (50, 200) | 3.27% | 13.40% | -76.88% | 0.24 | 0.04 | 60.72% | 0.571 |
| VOL (200)+,- | 2.01% | 12.70% | -66.71% | 0.16 | 0.03 | 28.08% | 0.314 |
| SKEW (200) | 4.04% | 13.53% | -58.46% | 0.30 | 0.07 | 71.74% | 0.725 |
| RSI (200) | 6.40% | 13.11% | -52.36% | 0.49 | 0.12 | 70.17% | 0.843 |
| RR (0.5, 0.5) | 6.57% | 13.27% | -50.63% | 0.50 | 0.13 | 71.74% | 0.841 |
| Trend | 5.91% | 11.63% | -42.87% | 0.51 | 0.14 | 63.25% | 0.963 |
Figure 1: Performance chart of price-based market timing strategies for the period from April 1927 to June 2022.
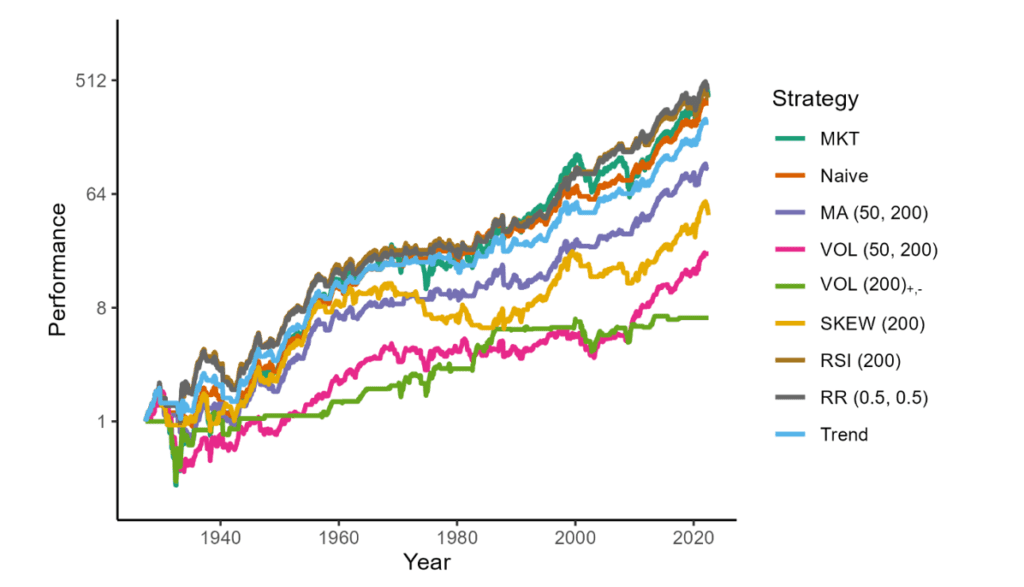
The superior performance of the RR (0.5, 0.5) and strong market timing results by Naive motivated us to combine these two strategies to obtain a more diversified trading signal. Trend buys or stays long the MKT if Naive and RR (0.5, 0.5) trading signals are unanimously positive. Otherwise, the strategy switches out of the stock market.
Trend yields an annual return of 5.91%, less than Naive or RR (0.5, 0.5), which is understandable as it spends less time invested in MKT. On the other hand, it suffers the most favorable maximal drawdown of -42.87%, exhibits the lowest volatility of 11.63% p.a., and displays one of the highest risk-adjusted returns.
However, at this point, we realized that in order to further improve our market timing model, we have to look beyond price indicators. Therefore, in our next step, we attempt to combine trading signals of our best-performing strategies in terms of risk-adjusted returns, Naive and Trend, with trading signals based on macroeconomic indicators. Continuation will be published in part 2 – Market Timing Using Trend and Macroeconomic Indicators.
Author:
Ladislav Durian, Quant Analyst, Quantpedia
Are you looking for more strategies to read about? Sign up for our newsletter or visit our Blog or Screener.
Do you want to learn more about Quantpedia Premium service? Check how Quantpedia works, our mission and Premium pricing offer.
Do you want to learn more about Quantpedia Pro service? Check its description, watch videos, review reporting capabilities and visit our pricing offer.
Do you want algorithmic access to the full Quantpedia database via the API? Subscribe to Quantpedia Pro, ask for an API key, and explore the in/out-of-sample statistics, source academic papers, and code snippets — ideal for quantitative research, systematic trading workflows, and AI model training.
Are you looking for historical data or backtesting platforms? Check our list of Algo Trading Discounts.
Or follow us on:
Facebook Group, Facebook Page, Telegram, Twitter, Linkedin, Medium or Youtube
Share onLinkedInTwitterFacebookRefer to a friend


