Better Small Cap Premium

14.November 2017

A new financial research paper related to:

#25 – Small Capitalization Stocks Premium

Authors: Stefano, Serie, Simon, Lemperiere, Bouchaud

Title: The 'Size Premium' in Equity Markets: Where Is the Risk?

Link: https://papers.ssrn.com/sol3/papers.cfm?abstract_id=3018454

Abstract:

We find that when measured in terms of dollar-turnover, and once beta-neutralised and Low-Vol neutralised, the Size Effect is alive and well. With a long term t-stat of 5.1, the “Cold-Minus-Hot” (CMH) anomaly is certainly not less significant than other well-known factors such as Value or Quality. As compared to market-cap based SMB, CMH portfolios are much less anti-correlated to the Low-Vol anomaly. In contrast with standard risk premia, size-based portfolios are found to be virtually unskewed. In fact, the extreme risk of these portfolios is dominated by the large cap leg; small caps actually have a positive (rather than negative) skewness. The only argument that favours a risk premium interpretation at the individual stock level is that the extreme drawdowns are more frequent for small cap/turnover stocks, even after accounting for volatility. This idiosyncratic risk is however clearly diversifiable.

Notable quotations from the academic research paper:

"One of the best known – and perhaps most controversial – effects in the market folklore is the so-called “size premium”, which states that small-cap stocks are on average undervalued and outperform large-caps. But while still highly popular among equity managers, strong doubts about the very existence of a size premium have been expressed in a number of scientific publications.

Here we want to advocate another, complementary picture. We argue that market capitalisation is not an optimal indicator of an otherwise genuine “size” effect. Indeed, the dependence of a stock “beta” on market capitalisation is non-monotonic, which induces spurious biases in a (market neutral) portfolio construction. The resulting SMB portfolios have a strong short Low-Vol exposure.

We propose instead the average daily volume (ADV) of transaction (in dollars) as an alternative indicator of size, and show that the above mentioned biases are substantially reduced. The choice of ADV is further motivated by two independent arguments, often put forth in the literature. One is that the size effect might in fact be a liquidity risk premium, i.e., “Cold” stocks, that are more difficult to liquidate, are traded at a discount. The other is that heavily traded, “Hot” stocks are scrutinized by a larger number of market participants, therefore reducing pricing errors.

Although these arguments sound reasonable, we will show below that they fail to capture the mechanism underlying the profitability of Cold-Minus-Hot (CMH) portfolios. Perhaps surprisingly, standard skewness measures do not conform to the idea of that the size effect is a risk premium. In fact, the single name skewness of small cap/small ADV stocks is positive, and declines to zero as the market cap/ADV increases. At the portfolio level, small cap/ADV stocks do not contribute to skewness either. In fact, the SMB portfolio is only weakly negatively skewed, whereas the CMH portfolio is not skewed at all; furthermore, large gains/losses at the portfolio level mostly come from the short leg (corresponding to large cap/ADV stocks). All these results suggest that “prudence” (i.e. aversion for negative skewness and appetite for positive skewness) should favour small cap/ADV stocks, in contradiction with the idea that SMB or CMH are risk premia strategies.

Interestingly, however, higher moments of the return distribution, such as the kurtosis or the downside tail probability, show a clear decreasing pattern as a function of market cap or ADV. In other words, extreme in both directions are more common for small stocks, even after factoring out volatility. Even if, quite unexpectedly, large upside events are more likely than large downside events for small stocks, “safety first” considerations might be enough to deter market participants from investing in these stocks. This scenario would allow one to think of the size anomaly as a risk premium – albeit a rather non conventional one."


Are you looking for more strategies to read about? Check http://quantpedia.com/Screener

Do you want to see performance of trading systems we described? Check http://quantpedia.com/Chart/Performance

Do you want to know more about us? Check http://quantpedia.com/Home/About

Continue reading

800 Years of Risk-Free Rate

7.November 2017

All of us at Quantpedia are history freaks, thefore we absolutely LOVE papers like this:

Authors: Schmelzing

Title: Eight Centuries of the Risk-Free Rate: Bond Market Reversals from the Venetians to the ‘VaR Shock’

Link: https://papers.ssrn.com/sol3/papers.cfm?abstract_id=3062498

Abstract:

This paper presents a new dataset for the annual risk-free rate in both nominal and real terms going back to the 13th century. On this basis, we establish for the first time a long-term comparative investigation of ‘bond bull markets’. It is shown that the global risk-free rate in July 2016 reached its lowest nominal level ever recorded. The current bond bull market in US Treasuries which originated in 1981 is currently the third longest on record, and the second most intense.

The second part of this paper presents three case studies for the 20th century, to typify modern forms of bond market reversals. It is found that fundamental, inflation-led bond market reversals have inflicted the longest and most intense losses upon investors, as exemplified by the 1960s market in US Treasuries. However, central bank (mis-) communication has played a key role in the 1994 ‘Bond massacre’. The 2003 Japanese ‘VaR shock’ demonstrates how curve steepening dynamics can create positive externalities for the banking system in periods of monetary policy and financial uncertainty.

The paper finally argues that the inflation dynamics underlying the 1965–70 bond market sell-off in US Treasuries could hold particular relevance for the current market environment.

Notable quotations from the academic research paper:

"The most interesting charts:

Nominal risk-free rate:

Risk Free Rate

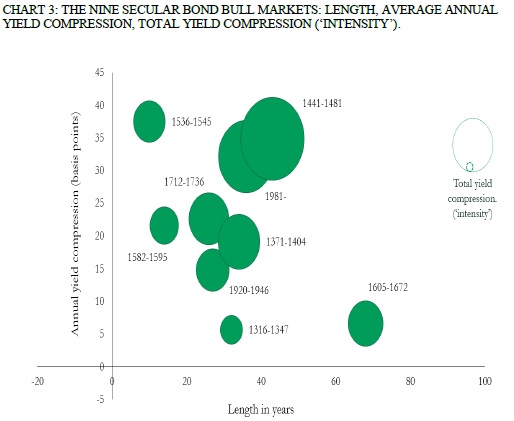
Bond bull markets comparison:

Bond Bull Markets

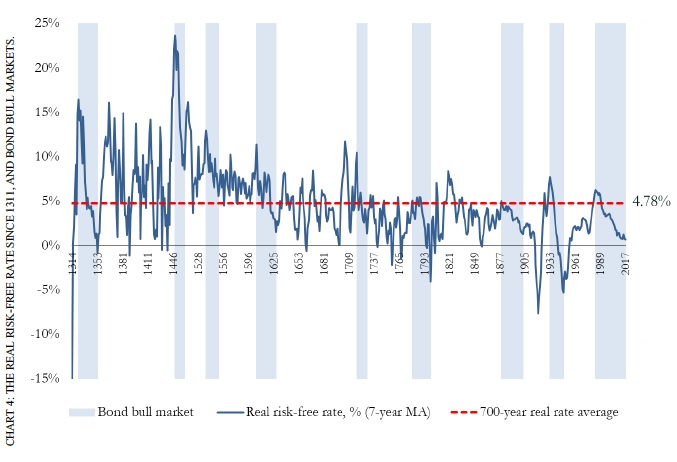
Real risk-free rate:

Real Risk Free Rate

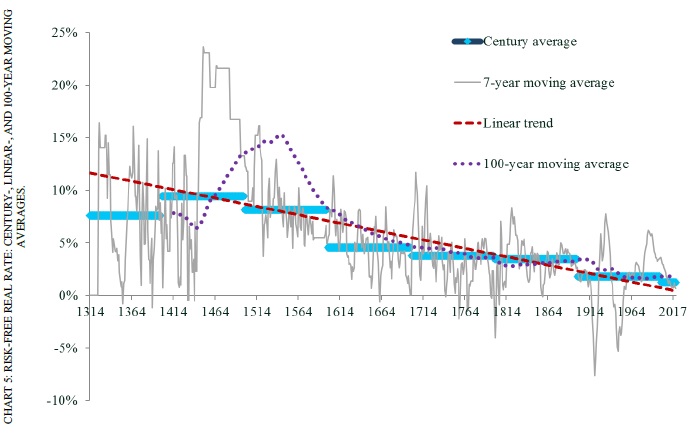
Regression and averages of real risk-free rate:

Averages

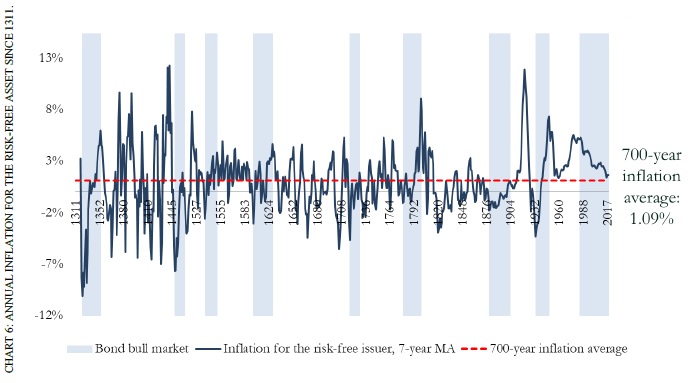
Inflation:

Inflation
"


Are you looking for more strategies to read about? Check http://quantpedia.com/Screener

Do you want to see performance of trading systems we described? Check http://quantpedia.com/Chart/Performance

Do you want to know more about us? Check http://quantpedia.com/Home/About

Continue reading

Autumn Readings about Factor Investing

28.October 2017

An interesting series about factor investing for a long autumn evenings, related to multiple factor strategies:


Authors: Arnott, Beck, Kalesnik, West

Title: How Can 'Smart Beta' Go Horribly Wrong?

Link: https://papers.ssrn.com/sol3/papers.cfm?abstract_id=3040949

Abstract:

Factor returns, net of changes in valuation levels, are much lower than recent performance suggests. Value-add can be structural, and thus reliably repeatable, or situational—a product of rising valuations—likely neither sustainable nor repeatable. Many investors are performance chasers who in pushing prices higher create valuation levels that inflate past performance, reduce potential future performance, and amplify the risk of mean reversion to historical valuation norms. We foresee the reasonable probability of a smart beta crash as a consequence of the soaring popularity of factor-tilt strategies.


Authors: Arnott, Beck, Kalesnik

Title: Timing 'Smart Beta' Strategies? Of Course! Buy Low, Sell High!

Link: https://papers.ssrn.com/sol3/papers.cfm?abstract_id=3040956

Abstract:

In our paper — “How Can ‘Smart Beta’ Go Horribly Wrong?” — we show that performance chasing can be as dangerous in smart beta as it is in stock selection, fund selection, or asset allocation. We differentiate between “revaluation alpha” and “structural alpha.” The former is the part of the past return that came from rising valuations. Revaluation alpha is nonrecurring, and is at least as likely to reverse as to persist. Rising valuations create an illusion of alpha and encourage performance chasing.

Structural alpha is the part of the past return that was delivered net of any impact from rising valuations. Why do we emphasize rising valuations? Because factors and strategies with tumbling valuations are rarely noticed in the data mining so pervasive throughout the finance community. For some factors, such as low beta, we show that most or all past performance was revaluation alpha, which could easily reverse from current valuation levels. For smart beta strategies, the picture is a bit better: most established products have respectable structural alpha.

In our paper “To Win with ‘Smart Beta’ Ask If the Price Is Right,” we show that valuations are predictive of future returns. We demonstrate that this result is robust across time, in international and emerging markets, and holds for various metrics used to measure valuations. We also point out that — for the moment, at least — many so-called smart beta strategies are trading in the top quartile, and even top decile, of historical valuations. We caution those who believe past is prologue and are tempted to extrapolate past “alpha” into expected future returns without regard to current valuation levels.

In this paper we explore whether active timing of smart beta strategies and/or factor tilts can benefit investors. We find that performance can easily be improved by emphasizing the factors or strategies that are trading cheap relative to their historical norms and by deemphasizing the more expensive factors or strategies. We also observe that aggressive bets (favoring only the cheapest factor or smart beta strategy) can severely erode Sharpe ratios, so that gentle or moderate tilts toward that factor or strategy would seem to be a sensible compromise. Finally, we note that both factor and smart beta strategies have typically been identified and accepted as potentially alpha generating by the finance and investing communities after a period of impressive success — indeed, many of our own tests include a span that predates their discovery. We show that out-of-sample tests, after a strategy or factor has been discovered, are often far less impressive.


Authors: Arnott, Beck, Kalesnik

Title: Forecasting Factor and Smart Beta Returns (Hint: History Is Worse than Useless)

Link: https://papers.ssrn.com/sol3/papers.cfm?abstract_id=3040953

Abstract:

In a series of papers we published in 2016, we show that relative valuations predict subsequent returns for both factors and smart beta strategies in exactly the same way price matters in stock selection and asset allocation. To many, one surprising revelation in that series is that a number of “smart beta” strategies are expensive today relative to their historical valuations. The fact they are expensive has two uncomfortable implications. The first is that the past success of a smart beta strategy—often only a simulated past performance—is partly a consequence of “revaluation alpha” arising because many of these strategies enjoy a tailwind as they become more expensive. We, as investors, extrapolate that part of the historical alpha at our peril. The second implication is that any mean reversion toward the smart beta strategy’s historical normal relative valuation could transform lofty historical alpha into negative future alpha. As with asset allocation and stock selection, relative valuations can predict the long-term future returns of strategies and factors—not precisely, nor with any meaningful short-term timing efficacy, but well enough to add material value. These findings are robust to variations in valuation metrics, geographies, and time periods used for estimation.


Authors: Arnott, Kalesnik, Wu

Title: The Incredible Shrinking Factor Return

Link: https://papers.ssrn.com/sol3/papers.cfm?abstract_id=3040964

Abstract:

This is the first in a series of papers we will publish in 2017 that demonstrate factor tilts generally deliver far less alpha in live portfolios than they do on paper, or put another way, investment managers generally fail to capture the returns that would be expected based on their factor tilts. We break our research into four parts. In this paper we show that the factor returns realized by fund managers differ starkly from the theoretical factor returns constructed from long–short paper portfolios. Notably, the market, value, and momentum factors are far less rewarding in live fund management than their theoretical long–short paper portfolio returns.

In the second paper of the series, we challenge the idea that factor tilts — portfolios combining several theoretical factor portfolios — are the same as smart beta strategies. We show, using Fundamental Index™, equal-weight, and low-volatility strategies as illustrative examples, that factor tilts cannot successfully replicate smart beta strategies. Although the factor tilts of these strategies are easy to replicate, the resulting portfolios look very different from the originals, with the replication portfolios having far higher turnover, lower performance, and smaller capacity.

In a third paper of the series, we show that the relative valuations of factor loadings can give us the courage to buy mutual funds when factor tilts are at their cheapest, hence, the most out of favor. Along with fees, turnover, and past performance — where low fees, low turnover, and low (yes, low!) past performance are predictive of better future returns — factor loadings can help us improve our forecasts of fund returns. We find the best predictor is prior three-year performance, but with the wrong sign: buying the losers is the winningest strategy.

Finally, a fourth paper will take a closer look at momentum, for which we find the realized alpha in live portfolios is essentially zero compared to a theoretical alpha of around 6% a year. We show why momentum doesn’t work in live portfolios, and also show how momentum can be saved as a useful source of alpha.


Authors: Arnott, Clements, Kalesnik

Title: Why Factor Tilts are Not Smart 'Smart Beta'

Link: https://papers.ssrn.com/sol3/papers.cfm?abstract_id=3040970

Abstract:

We challenge the common view that smart beta strategies and factor tilts are equivalent. Initially, the term “smart beta” referred to strategies that broke the link between the price of a stock and its weight in the portfolio or index. Capitalization weighting does not do that — neither does a portfolio that applies factor tilts to a cap-weighted starting portfolio.

Some have suggested that certain smart beta strategies are essentially factor tilt strategies in disguise, which can be replicated with factor tilts applied to a cap-weighted market portfolio. We test this assertion by replicating three first-generation smart beta strategies — Fundamental Index™, equal weight, and minimum variance — with factor tilts. Creating factor-replicated portfolios that match the factor loadings of these smart beta strategies is easy, but the factor-replicated portfolios are poor substitutes for their smart beta counterparts: performance is poor, turnover is high, and capacity is terrible. Why? The simple answer is that construction details matter in achieving both lower trading costs and higher performance.


Are you looking for more strategies to read about? Check http://quantpedia.com/Screener

Do you want to see performance of trading systems we described? Check http://quantpedia.com/Chart/Performance

Do you want to know more about us? Check http://quantpedia.com/Home/About
Continue reading

Tail Risk in Term Structure Based Strategies in Commodities

21.October 2017

A new financial research paper related to:

#22 – Term Structure Effect in Commodities

Authors: Bianchi

Title: Carry Trades and Tail Risk: Evidence from Commodity Markets

Link: https://papers.ssrn.com/sol3/papers.cfm?abstract_id=3035453

Abstract:

In this paper I document that carry trades in commodity markets are subject to potential large and infrequent losses, that is, tail risk. Also, I show that shocks to carry trades and volatility have persistent tail-specific effects which last from four to twelve weeks ahead. The main empirical results are consistent with existing theoretical models in which carry traders are subject to limited risk capacity and liquidity constraints. In this respect, I provide evidence that money managers, index traders, and more generally non-commercial traders, tend to unwind their net-long futures positions when exposed to deteriorating aggregate financial conditions and increasing market uncertainty. Methodologically, I make use of panel quantile regressions with non-additive fixed effects, which allow to identify the tail-specific effect of carry on the conditional distribution of commodity futures excess returns.

Notable quotations from the academic research paper:

"Carry can be defined as the component of a position’s returns that comes from something other than spot price changes. In the case of currencies, where the concept of carry is more familiar, carry trades arise from the differential of interest rates between foreign and domestic currencies. In equity and fixed income carry can be thought of as the dividend yield and the coupon payment which is earned regardless changes in the bond prices, respectively. Similarly, commodity investors can earn returns even with constant spot prices as the futures contract they are holding rolls down (or up) the futures price curve.

However, there are at least three reasons why carry is even more important for commodities compared with other asset classes.

First, while bond and equity carry are mostly positive, commodity carry, like currencies, can be either negative or positive depending on the shape of the futures curve. Backwardated (negative-sloping) curves imply positive carry because if the spot price do not change than the futures contract is expected to roll up the futures price curve over time. In this respect, the roll yield is expected to more than cancel out the effect of flat, or even slightly negative, spot returns.

Second, commodity carry can be highly volatile relative to other asset classes. Carry of energy commodities such as Crude oil and Copper, and agricultural, such as Wheat, has clusters of high volatility and frequently switches sign. Dividend yield for equity, coupon payments in bond markets, and interest rates differentials are arguably much less volatile.

Third, commodity carry can be extreme and be quite heterogeneous across sectors, especially on the long side of the trade. Carry trades, on average across commodities, has positive skewness, that is, carry tends to be extreme and trades are more likely to be net long than net short.

The high volatility and instability is possibly due to the fact that, unlike fixed income and currencies, commodity markets do not have a dependable “BearWhale” like a central bank that is prepared to buy commodity assets at any resort and in the process manipulate forward expectations. In this respect, unlike fixed income and currencies, carry in commodities can hardly be stabilized by regulators and policy makers alike.

In this paper, I investigate tail risk for funding-constrained speculators in commodity markets, in an attempt to shed new light on the importance of commodities as an asset class for investment decisions. The empirical analysis focuses on commodities spanning the energy, metals (industrial and precious) and agricultural sectors. For each of these commodities, I calculate excess returns using a rolling strategy on both first- and second-nearby contracts, which represent the most liquid maturities. To compute the carry, I consider the slope between the nearest-to-maturity contract and the next-to-nearest available futures contract on the same commodity, depending on the maturity of the excess returns.

The results show that carry trades are significantly negatively correlated with the left tail of the conditional distribution of one step ahead futures excess returns, that is carry trades are subject to a significant tail risk.

Although with a lower statistically significance, the net long futures positions of money managers and non-commercial traders more generally, are positively correlated with carry in the crosssection, consistent with the idea that futures positions by speculators might represent a proxy for their propensity on carry trades. These findings are consistent with existing theories of financing constraints and preferences for skewed returns.

These financing constraints are likely to be particularly important during downturns in financial conditions and aggregate liquidity when speculators, insurance providers and more generally non-commercial traders face capital losses and increasing margin calls.

I test the direct effect of global risk and financial dislocations by investigating the interaction between carry trades and the implied volatility of S&P500 options, i.e. the VIX, the Financial Stress Index maintained by the St. Louis Fed and the National Financial Conditions Index held by the Chicago Fed. The empirical evidence shows a significant negative correlation between deteriorating aggregate financial conditions and speculators’ positions, that is carry traders tend to unwind their net long positions when facing increasing global risk and possibly lower risk tolerance.

Finally, I make use of local projection methods as indicated by Jord`a (2005) to document the average longer-term effect of shocks to carry, futures positions and volatility, on tail risk by estimating aggregate impulse responses. I show that the effect of carry trades is highly significant in the left tails of the distribution of excess returns up to several weeks ahead. Similarly, I show that a one unit shock to speculators’ futures positions does not affect tail risk, while on the opposite shocks to contidional volatility have a persistent effect on tail risk up to three months ahead."


Are you looking for more strategies to read about? Check http://quantpedia.com/Screener

Do you want to see performance of trading systems we described? Check http://quantpedia.com/Chart/Performance

Do you want to know more about us? Check http://quantpedia.com/Home/About
Continue reading

How to Predict FX Carry Profitability

13.October 2017

A new financial research paper related to:

#5 – FX Carry Trade

Authors: Anatolyev, Gospodinov, Jamali, Liu

Title: Foreign Exchange Predictability During the Financial Crisis: Implications for Carry Trade Profitability

Link: https://papers.ssrn.com/sol3/papers.cfm?abstract_id=3029725

Abstract:

In this paper, we study the effectiveness of carry trade strategies during and after the financial crisis using a flexible approach to modeling currency returns. We decompose the currency returns into multiplicative sign and absolute return components, which exhibit much greater predictability than raw returns. We allow the two components to respond to currency-specific risk factors and use the joint conditional distribution of these components to obtain forecasts of future carry trade returns. Our results suggest that the decomposition model produces higher forecast and directional accuracy than any of the competing models. We show that the forecasting gains translate into economically and statistically significant (risk-adjusted) profitability when trading individual currencies or forming currency portfolios based on the predicted returns from the decomposition model.

Notable quotations from the academic research paper:

"The most signi…ficant departure from the lack of predictability of exchange rates has been documented in the carry trade literature. In a carry trade, an investor borrows in a low-interest currency and invests the borrowed funds in a high-yielding currency. A number of possible explanations have been advanced to account for the positive average returns of carry trade. In a classical asset pricing context, the positive average returns should refl‡ect compensation for bearing a (possibly time-varying) risk premium.

In this paper, we adopt a statistical approach to uncovering and exploiting potential predictability in carry trade returns during and after the recent U.S. Â…financial crisis. More specifically, we capitalize on the method proposed by Anatolyev and Gospodinov (2010) to decompose currency returns into two multiplicative components (sign and absolute returns) that individually exhibit much greater predictability than raw returns. We then model the joint conditional distribution of these components and use it to produce forecasts of future returns. We allow the two components to respond to currency-specifiÂ…c risk factors such as speculative pressure. This method of incorporating
any implicit nonlinearities in a ‡flexible, indirect fashion is motivated by:
(i) the limited success of linear asset pricing models in explaining carry trade returns
(ii) prior empirical evidence pointing to a statistically and economically signiÂ…ficant element of nonlinear out-of-sample predictability in foreign exchange markets especially at long horizons
(iii) the proÂ…tability of trading based on the decomposition model of Anatolyev and Gospodinov (2010) for equity returns.

Several interesting results emerge from our analysis.

– First, the decomposition model exhibits substantial directional accuracy in predicting carry trade returns during the recent Â…financial crisis.
– Second, the out-of-sample forecasting gains of the decomposition model (relative to the naïve historical mean and linear prediction models) translate into economically and statistically highly signiÂ…ficant profiÂ…tability.

We view the uncovered nonlinear predictability as a possible explanation of the limited success of linear asset pricing models in the context of currency markets. Note that the carry trade returns consist of two parts –future currency returns and interest rate differential –and while the pure carry trade strategies exploit only the differential in interest rates, both of which are near the zero lower bound over this period, we employ a model-based carry trade strategy that capitalizes on the predictability of currency returns. We allow the two components (multiplicative sign and absolute return components) to respond to currency-speci…c risk factors and use the joint conditional distribution of these components, modeled as a time-varying copula, to produce forecasts of future returns.

"


Are you looking for more strategies to read about? Check http://quantpedia.com/Screener

Do you want to see performance of trading systems we described? Check http://quantpedia.com/Chart/Performance

Do you want to know more about us? Check http://quantpedia.com/Home/About
Continue reading

Suggestion of a New Currency Factor Model

3.October 2017

A new research paper related to multiple currency strategies:

Authors: Aloosh, Bekaert

Title: Currency Factors

Link: https://papers.ssrn.com/sol3/papers.cfm?abstract_id=3022623

Abstract:

We examine the ability of existing and new factor models to explain the comovements of G10-currency changes. Extant currency factors include the carry, volatility, value, and momentum factors. Using a new clustering technique, we find a clear two-block structure in currency comovements with the first block containing mostly the dollar currencies, and the other the European currencies. A factor model incorporating this “clustering” factor and two additional factors, a commodity currency factor and a “world” factor based on trading volumes, fits all bilateral exchange rates well, whatever the currency perspective. In particular, it explains on average about 60% of currency variation and generates a root mean squared error relative to sample correlations of only 0.11. The model also explains a considerable fraction of the variation in emerging market currencies.

Notable quotations from the academic research paper:

"In this paper, we set out to examine various factor models to explain currency comovements and document their fit with the data from a global perspective. That is, we attempt to identify a factor model that works well whatever the currency perspective is. To facilitate a global perspective on currency comovements, we introduce the concept of a “currency basket.” The currency basket simply averages all bilateral currency changes relative to one particular currency. As we show formally, by analyzing 10 currency baskets for the G10 currencies, we span all possible bilateral currency movements. We then contrast the explanatory power of the extant risk factors mentioned previously with the explanatory power of various new factors.

Most importantly, we use a new clustering technique to introduce several new currency factors. When selecting two clusters, a very clear factor structure emerges, with the dollar currencies (Australian, Canadian, New Zealand and US) and the Japanese yen in one block and the European currencies in the other. When using three clusters, a commodity type currency factor also emerges. Combining these statistical factors with a “market” factor, based on currency trading volumes, and a commodity currency factor, we propose several parsimonious factor models and run a horse race versus models incorporating the existing factors.

Among the extant currency factors, the carry and value factors exhibit the highest explanatory power for currency variation. This is not surprising because both factors are relatively highly correlated with the first principal component in bilateral currency rates. However, a new parsimonious factor model incorporating the two-block clustering factor, a commodity factor and the market factor easily beats factor models created from extant risk factors, even models that feature double as many factors. The new factor model explains on average about 60% of the variation in changes in currency basket values. Moreover, the Root Mean Squared Error (RMSE) relative to sample correlations is only about 0.11, which is statistically significantly better than any model based on extant risk factors."


Are you looking for more strategies to read about? Check http://quantpedia.com/Screener

Do you want to see performance of trading systems we described? Check http://quantpedia.com/Chart/Performance

Do you want to know more about us? Check http://quantpedia.com/Home/About
Continue reading

Subscribe for Newsletter

Be first to know, when we publish new content


    logo
    The Encyclopedia of Quantitative Trading Strategies

    Log in

    MORE INFO
    We boasts a total prize pool of $15,000
    Gain a Share of a Total Prize Pool of $15.000
    MORE INFO
    $15.000
    Gain a Share of a Total Prize Pool