Calendar / Seasonal Trading and Momentum Factor
We are continuing in our short series of articles about calendar / seasonal trading. In our previous work, we have examined various calendar / seasonal equity trading strategies. In this study, we aim to take this composite calendar strategy as a building block and add another block to enhance the resulting performance. This article can be another example, how to work with anomalies that are included in our Screener. All of them can be taken as ideas and logically built together in search of better performance characteristics.
In our older blog post we have shown that Turn of the Month in Equity Indexes, FOMC Meeting Effect in Stocks, Option-Expiration Week Effect, and The Payday Effect are profitable anomalies also in the recent period. The idea for the composite trading strategy has been simple; each calendar anomaly signals whether to enter into a long position. Next, we have refined the strategy and added a filter in the form of a trend signal. Lastly, we have shown that the addition of 200 days moving average (MA200) can drastically reduce maximal drawdowns. The previous article also includes an explanation of why these additions work.
Strategies Based on Calendar Anomalies and Momentum
In this article, we ad another strategy to work with an already successful calendar strategy consisting of smaller blocks (each calendar anomaly). There is a vast amount of academic research about momentum strategies for a broad asset class universe (for example, Faber, Relative Strength Strategies for Investing, 2010). We believe that momentum strategies combined with calendar anomaly rebalancing would outperform a simpler approach of trading S&P500 during the given days. However, we are not using a broad asset universe, but only a diversified set of equity ETFs. There is no doubt about the profitability of momentum strategies, but we have examined only equity calendar strategies. Moreover, we also include analysis of transaction costs of such a strategy in the later section.
The idea of combining momentum strategies with the composite calendar strategy could be easily understood. During the given days, there is a price pressure upwards because a lot of market participants are rebalancing their position. Additionally, it seems to be natural to invest in assets that appear to be most profitable in recent times (in the belief that the assets would continue performing good). Such an idea leads to momentum strategies that are notoriously known among practitioners and also well-researched and generally accepted by academics. Momentum anomalies are based on a simple idea that assets that have performed well in the past (in some given period) are expected to continue with their performance in the near future. Academic literature also recognizes underperformance of assets that have performed badly, but for our purpose, we are interested only in the long-only momentum. If we are trying to find a profitable asset – the asset with large momentum to enhance our calendar strategy, it would certainly be beneficial to expand the set of assets we can invest in.
In our previous work, we have examined only the S&P500 index by using SPY ETF. In this paper, we are adding MSCI EAFE ETF (EFA) that tracks results of an index composed of large- and mid-capitalization developed market equities, but only for Europe, Australia, Asia, and the Far East (excluding the U.S. and Canada). We are also adding MSCI Emerging Markets ETF (EEM), which has exposure to both large and mid-sized companies in emerging markets. The increase of the investment universe is because of diversification and also to seek long term growth by identifying the most profitable ETF at a given rebalancing time of calendar strategy. Also, we still suggest to add the MA200 filter again to all of our ETFs, to reduce drawdowns, since the simple addition of the filter is able to protect investors from large and long-lasting market downturns.
Data and Strategy construction
Our backtesting period spans from 29.4.2004 to 21.9.2019 and the data of ETFs are available for free at Yahoo Finance.
Calendar block
The Turn of the Month – we would rebalance the Turn of the Month strategy on the first day of the month. Since the first day of the month is, on average, the best performing day of the whole month.
Federal Open Market Committee Meeting Effect in Stocks – dates of FED meetings are publicly known and available, the simple execution of this strategy could be made by buying ETF on a close day before the meeting and selling it on the close after the meeting.
Option-Expiration Week Effect – is connected with the Option-expiration week – a week before options expiration (Friday before each 3rd Saturday in each month). The investor buys the ETF on close each Friday before 3rd Saturday in the month and sells it on close again in the next week’s Thursday.
The Payday Effect – very similar to the Turn of-the Month (ToM) anomaly, a strategy that utilizes this effect consists of buying the ETF on close on the 15th day each month and selling it on close the next day.
We would like to point out that deeper insight into calendar strategies is in the previous article. When the dates of strategy ETFs rebalancing are known, we can move into the momentum block of the strategy.
Momentum block
As a first step, we have computed momentum for all ETFs with three lookback periods. To be more precise: 63, 126, and 262 days momentum, what is approximately 3 months, 6 months, and 12 months. For diversification purposes and robust strategy (naturally, the strategy would be profitable if we would use only one momentum indicator), it is favorable to use more momentum indicators. As a next step, we are ranking each ETF according to its momentum each day. The winner of each category receives a weight of 1/3 in the portfolio, but only if the price of ETF is above its 200 days moving average. Therefore, we might not trade the whole portfolio every time. Of course, there is a possibility to use a different time period for computation of moving average or even use more moving averages, but we did not want to make the strategy unnecessarily complex.
For example, imagine that SPY received ranks of 2,2,1 (63 days, 126 days and 262 days momentum), EEM received ranks of 3, 3, 3, and EFA received ranks 1,1,2. The price of the EFA is over the MA200, so the EFA receives the weight of 2/3 in the portfolio. EEM is ignored because it is underperforming. The SPY should have the weight of 1/3, but the SPY is under MA200; therefore, it is ignored, and we trade only a 2/3 of the portfolio.
Performance of the strategy
In the examination of the proposed strategy, we are directly comparing this approach to our previous simple calendar strategy (first paper in the references).
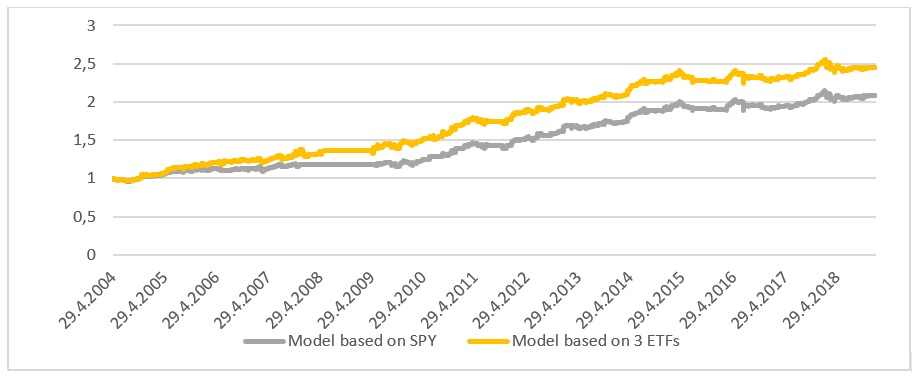
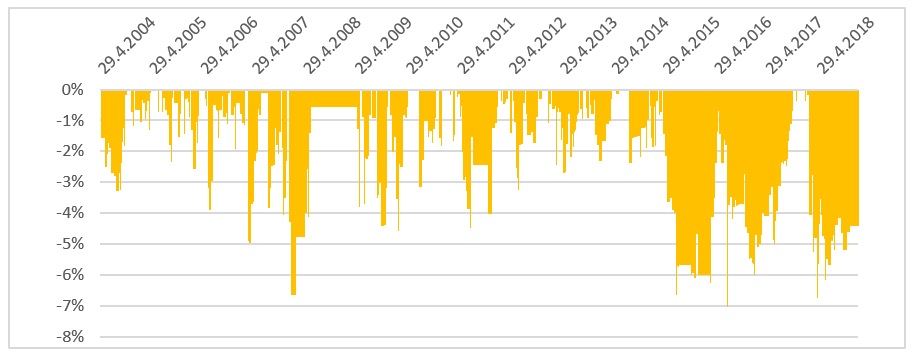
Obviously, the enhanced strategy is able to outperform a simpler strategy based only on the SPY without the momentum factor (the calendar strategy from the previous blog post). There could be easily seen a steeper ascent in the equity curve during various periods and also periods where the MA200 of SPY signaled to stop trading, and yet, our strategy was able to gain equity. This is possible by additional ETFs. An additional insight into the risk of the strategy could be easily gained from the drawdown chart.
We also provide a summary table of the key metrics of both strategies.
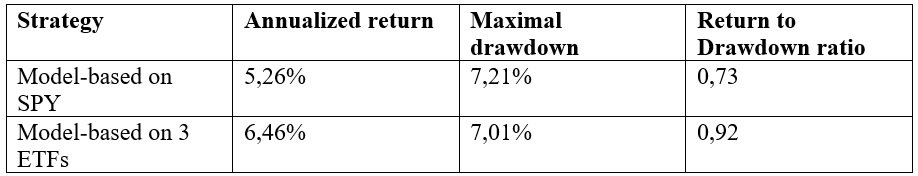
Such a result shows that another building block can be successfully added, resulting not only in better performance but also in slightly lower drawdown.
Performance of the strategy with transaction costs
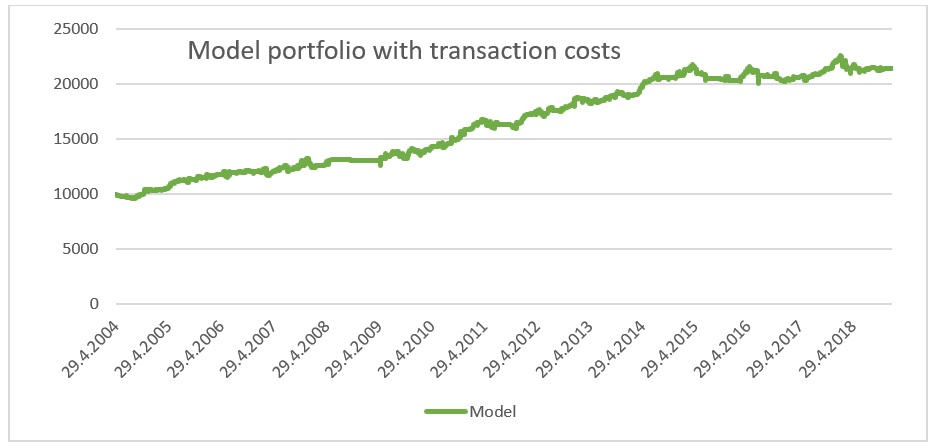
Intuitively, it should be clear that the usage of ETFs is connected with low transaction costs, and strategy with such return should easily survive costs. However, since we are considering the results from the practitioner’s point of view, we examine the strategy also with the costs included. There are some model assumptions: firstly we have a small portfolio of 10 000USD, the fee for a trade is 0,01% (buying 100 equities costs approximately 1 USD, therefore for a 10 000 USD portfolio, costs are 0,01%) and slippage is 0,005% (since the spread is 1 cent and the slippage is approximately a half of the spread).
The resulting annualized return is 5,47% what is slightly lower compared to strategy without costs, with the maximal drawdown of 7,99%, resulting in the return to drawdown ratio of 0,68. Naturally, the return is lower, but it is important to bear in my mind that the strategy is invested in the ETFs only during a small part of a year.
Conclusion
We have successfully shown that the calendar strategy presented in the previous paper can be even more refined and enhanced to obtain better performance. The approach is working because it is able to identify the most profitable ETFs from a diversified pool that together represents the global market: SPY includes the US market, EFA includes Europe, Australia, Asia, and the Far East, and finally, EEM tracks emerging markets. The three momentum strategies used are used for ranking, which ensures that the most profitable ETF in the recent period is chosen. According to the momentum theory, the aforementioned should translate into outperformance in the near future. Rebalancement during calendar anomaly days results in magnified momentum returns, and the risk is minimized by systematically trading only when the price of the ETF is larger than it’s own moving average.
Authors:
Radovan Vojtko, CEO, Quantpedia.com
Matus Padyšák, Analyst, Quantpedia.com
Are you looking for more strategies to read about? Sign up for our newsletter or visit our Blog or Screener.
Do you want to learn more about Quantpedia Premium service? Check how Quantpedia works, our mission and Premium pricing offer.
Do you want to learn more about Quantpedia Pro service? Check its description, watch videos, review reporting capabilities and visit our pricing offer.
Do you want algorithmic access to the full Quantpedia database via the API? Subscribe to Quantpedia Pro, ask for an API key, and explore the in/out-of-sample statistics, source academic papers, and code snippets — ideal for quantitative research, systematic trading workflows, and AI model training.
Are you looking for historical data or backtesting platforms? Check our list of Algo Trading Discounts.
Or follow us on:
Facebook Group, Facebook Page, Telegram, Twitter, Linkedin, Medium or Youtube
Share onLinkedInTwitterFacebookRefer to a friend


