Effect of Maturity Structure of Roll Yields in Commodity Futures Strategies

4.September 2016

Related to multiple commodity futures long/short strategies, mainly to term-structure based strategies (like #22 – Term Structure Effect in Commodities) …

Authors: Ghoddusi

Title: Maturity Structure of Commodity Roll Strategies: Evidence from the Energy Futures

Link: http://papers.ssrn.com/sol3/papers.cfm?abstract_id=2820228

Abstract:

We investigate the maturity-structure of roll strategy returns in the energy futures markets. Our innovation is to report and analyze the risk/return profile, the Sharpe ratio, and the asset pricing loadings of rollover strategies based on futures contracts of the same underlying commodity but with maturities between two and 12 months. We find that a conditional rollover strategy, which takes a long position in backwardation and a short position in contango, delivers the highest Sharpe ratio for all commodities. While we don't observe a significant difference in terms of asset pricing beta for different roll positions, the Sharpe ratio tends to be higher for contracts with a shorter time to maturity. We also report some distinct patterns of maturity-structure across energy commodities. Findings of the paper have implications for managing commodity-based investments.

Notable quotations from the academic research paper:

"The rollover (or roll) strategy includes entering a futures contract with a given time-to-maturity, holding the futures contracts for a certain time period (typically for one month), and then closing the position to realize the return generated by changes in the price of the underlying futures contract. The investor then opens a new futures contract position (with the same time-to-maturity as before) and repeats the strategy.

The main contribution of the current paper is to examine the performance of rollover strategies de ned on futures contracts with di fferent time-to-maturity or what we call maturity structure of roll yields. By allowing the investment strategy to enter and exit futures contracts beyond the front month and to hold the contract for a time shorter than its maturity, we construct the maturity structure and discuss its properties for the ve selected commodities.

We document a monotonic relationship between the length of futures contracts and three key measures: the average return, the volatility of returns, and the Sharpe ratio. The results are robust for all commodities. The average return and volatility curves all decline with the length of the futures contract. However, the slope of the Sharpe ratio curve depends on the investment strategy chosen. For unconditional investment strategies the slope is positive, meaning that the further into the future the maturity date of the futures contracts, the higher is the Sharpe ratio. The relationship gets reversed when the investment position is conditioned on the slope of the forward curve."


Are you looking for more strategies to read about? Check /Screener

Do you want to see performance of trading systems we described? Check /Chart/Performance

Do you want to know more about us? Check /Home/About

Continue reading

Equity Anomalies Persist in International Markets

22.August 2016

A very important academic paper suggests that investors should trade global equity markets if they want to pursue equity long-short strategy … Related to multiple equity long/short strategies…

Authors: Jacobs, Muller

Title: Anomalies Across the Globe: Once Public, No Longer Existent?

Link: http://papers.ssrn.com/sol3/papers.cfm?abstract_id=2816490

Abstract:

Motivated by McLean and Pontiff (2016), we study the pre- and post-publication return predictability of 138 anomalies in 39 stock markets. Based on more than a million anomaly country-months, we find that the United States is the only country with a statistically significant and economically meaningful post-publication decline in long/short returns. The surprisingly large differences between the U.S. and international markets cannot be fully explained with general time effects or differences in limits to arbitrage, in-sample anomaly profitability, data availability, or local risk factor exposure. Our results have implications for the recent literature on arbitrage trading, data mining, and market segmentation.

Notable quotations from the academic research paper:

"In this study, we explore post-publication effects of 138 anomalies in the U.S. and 38 international stock markets.

International stock markets are economically important. During our sample period from January 1981 to December 2013, non-U.S. countries account on average for about 59% of the world market capitalization and for 72% of global GDP. Existing asset pricing tests in general tend to focus on the U.S. stock market. International out-of-sample tests may help to provide novel insights into the price discovery process and to enrich or challenge our understanding of price formation.

Indeed, we fi nd surprisingly large differences between post-publication effects in the U.S. stock market and international markets. Among the 39 stock markets that we study, only the U.S. market shows a signifi cant post-publication decline in long/short returns. In contrast, the same econometric framework suggests that none of the 38 international markets yields a signi ficant post-publication decline in anomaly returns. Overall, we do not find reliable evidence for an arbitrage-driven decrease in anomaly pro tability in international markets.

We explore several possible mechanisms behind the surprisingly large differences between the return dynamics in the U.S. and international markets, but are unable to fully explain the results. Our findings are consistent with the idea that sophisticated investors learn about mispricing from academic studies, but then focus mainly on the U.S. market. In addition to these event-time publication effects, there is a general negative calendar-time trend in anomaly returns in the U.S. stock market, but not in other major stock markets.

Averaged over our whole sample period, long/short anomaly returns in (various subsets of) international markets turn out to be similar in magnitude as the estimates for the U.S. market. This unconditional view suggests that many anomalies tend to be a global phenomenon and thus are unlikely to be mainly driven by data mining.

Our findings add to the large literature on international stock market segmentation. We contribute to this debate by providing evidence for seemingly strong geographic stock market segmentation which appears to have significant effects on the formation of prices. From a practical point of view, these findings may offer quantitative arbitrageurs insights into ways to optimize their investment process. A thorough analysis of geographic differences in capital invested in quantitative arbitrage strategies is needed.

"


Are you looking for more strategies to read about? Check /Screener

Do you want to see performance of trading systems we described? Check /Chart/Performance

Do you want to know more about us? Check /Home/About
 

Continue reading

Two Recent Papers Related to FX Carry Strategy

15.August 2016

Two academic papers related to:

#5 – FX Carry Trade


1. Volatility and liquidity risk factors explain Carry strategy:

Authors: Shehadeh, Li, Moore

Title: The Forward Premium Bias, Carry Trade Return and the Risks of Volatility and Liquidity

Link: http://papers.ssrn.com/sol3/papers.cfm?abstract_id=2789141

Abstract:

In this paper, we analyse the relationship between the currency carry return and volatility and liquidity risk factors. We find that both categories of risk factors are relevant to understanding and explaining carry return, with an outperformance for volatility ones especially the global FX volatility risk factor. Consistent with the poor performance of currency carry trades during high FX volatility regime, we also show that the well-established negative slope coefficient in the Fama regression tends to be more positive and even above unity in times of high FX volatility. The paper, overall, contributes to the risk-based solution of the forward premium bias puzzle.


2. FX variance and negative skewness risk factors explain Carry strategy:

Authors: Broll

Title: The Carry Trade and Implied Moment Risk

Link: http://papers.ssrn.com/sol3/papers.cfm?abstract_id=2775663

Abstract:

The carry trade is a zero net investment strategy that borrows in low yielding currencies and subsequently invests in high yielding currencies. It has been identified as highly profitable FX strategy delivering significantly excess returns with high Sharpe ratios. This paper shows that these excess returns are especially compensation for bearing FX variance and negative skewness risk. Additionally, factor risks that affect foreign money changes, foreign inflation changes, as well as changes to a newly developed Carry Trade Activity Index and the VIX index, as a proxy for global risk aversion, make up the carry trade risk anatomy. These findings are not exclusively important for carry traders, but also contribute to the understanding of currency risk in the cross-section. This is directly linked to asset pricing tests from Lustig et al. (2011), which have shown that currency baskets sorted on their interest rate differentials are all exposed to carry trade returns as a risk factor. Furthermore, this paper finds evidence that a decreased level of funding liquidity potentially leads to carry trade unwindings, controlling for equity and FX implied variance and skewness effects, which supports the theoretical model of liquidity spirals developed by Brunnermeier and Pedersen (2009).


Are you looking for more strategies to read about? Check /Screener

Do you want to see performance of trading systems we described? Check /Chart/Performance

Do you want to know more about us? Check /Home/About
Continue reading

Using Fundamentals to Improve Pairs Trading Strategy

6.August 2016

A related paper has been added to:

#12 – Pairs Trading with Stocks

Authors: Mazo, Lafuente, Gimeno

Title: Pairs Trading Strategy and Idiosyncratic Risk. Evidence in Spain and Europe.

Link: http://papers.ssrn.com/sol3/papers.cfm?abstract_id=2807956

Abstract:

Pairs trading strategy’s return depends on the divergence/convergence movements of a selected pair of stocks’ prices. However, if the stable long term relationship of the stocks changes, price will not converge and the trade opened after divergence will close with losses. We propose a new model that, including companies’ fundamental variables that measure idiosyncratic factors, anticipates the changes in this relationship and rejects those trades triggered by a divergence produced by fundamental changes in one of the companies. The model is tested on European stocks and the results obtained outperform those of the base distance model.

Notable quotations from the academic research paper:

"The purpose of this research is to propose a pairs trading model that increases return compared to the model of distance (Gatev et al., 2006). We will introduce some rules in the model, based on fundamental variables, so that persistent divergence in the relationship of the prices of the two selected stocks could be foreseen. When we analyze the results of the distance method in previous works, we found that the number of trades with losses was high and the increase of such trades was one of the reasons of the decline of pairs trading strategy return.

Depending on the reason why a divergence on a stock price pair leads to execute the trade, it will be more or less likely that the stock price pair will convergence again. Thus, if the stock price pair divergence is due to irrational investors that leads to liquidity tensions, later convergence is likely to happen. However, if the reason of such divergence is new information about the companies’ fundamentals, divergence is likely to remain and there will be another equivalence relation between both stocks (Andrade et al., 2005). This is the starting point of this paper: beginning from the basic model of distance, we test which variables related to companies’ performance could anticipated if divergence is temporal or permanent.

The variables we use in the model are selected from analysts’ consensus. The data are obtained from FactSet, a financial information provider. The reason to choose the values provided by analysts’ consensus is that they consider the implicit information in analysts’ recommendations that follow a certain stock.
The variables considered in the model are:
a) Earnings per Share in the next 12 months. (EPS).
b) Book Value per Share (BVPS).
c) Target Price (TP).
d) Recommendation.
e) Knowledge of the firm, measured as the number of estimations of each stock.

Empirical analysis of the proposed model confirms the hypothesis of the paper: including in the model variables that represent idiosyncratic risk of a firm outperforms basic pairs trading strategy (distance model). In fact, adding ES, BVPS and TP variables leads to better returns in the analyzed portfolios of IBEX 35 index, Euro Stoxx 50 index and Stoxx Europe 50 Index."


Are you looking for more strategies to read about? Check /Screener

Do you want to see performance of trading systems we described? Check /Chart/Performance

Do you want to know more about us? Check /Home/About
Continue reading

Asset Class Risk Premiums Explained by Skewness

28.July 2016

The most of the risk premiums are better explained by tail-risk skewness (compared to volatility)… Related to multiple strategies.

Authors: Lemperiere, Deremble, Nguyen, Seager, Potters, Bouchaud

Title: Risk Premia: Asymmetric Tail Risks and Excess Returns

Link: http://arxiv.org/pdf/1409.7720v3.pdf

Abstract:

We present extensive evidence that “risk premium'' is strongly correlated with tail-risk skewness but very little with volatility. We introduce a new, intuitive definition of skewness and elicit an approximately linear relation between the Sharpe ratio of various risk premium strategies (Equity, Fama-French, FX Carry, Short Vol, Bonds, Credit) and their negative skewness. We find a clear exception to this rule: trend following has both positive skewness and positive excess returns. This is also true, albeit less markedly, of the Fama-French “Value'' factor and of the “Low Volatility'' strategy. This suggests that some strategies are not risk premia but genuine market anomalies. Based on our results, we propose an objective criterion to assess the quality of a risk-premium portfolio.

Notable quotations from the academic research paper:

"Classical theories identify risk with volatility σ. This (partly) comes from the standard assumption of a Gaussian distribution for asset returns, which is entirely characterised by its first two moments: mean μ and variance σ^2. But in fact fluctuations are known to be strongly non Gaussian, and investors are arguably not much concerned by small fluctuations around the mean. Rather, they fear large negative drops of their wealth, induced by rare, but plausible crashes. These negative events are not captured by the r.m.s. σ but rather contribute to the negative skewness of the distribution. Therefore, an alternative idea that has progressively emerged in the literature is that a large contribution to the “risk premium” is in fact a compensation for holding an asset that provides positive average returns but may occasionally erase a large fraction of the accumulated gains.

Our work is clearly in the wake of the above mentioned literature on skewness preferences and tail-risk aversion. We will present extensive evidence that “risk premium” is indeed strongly correlated with the skewness of a strategy but very little with its volatility, not only in the equity world – as was emphasised by previous authors – but in other sectors as well. We will investigate in detail many classical so-called “risk premium” strategies (in equities, bonds, currencies, options and credit) and elicit a linear relation between the Sharpe ratio of these strategies and their negative skewness. We will find however that some well-known strategies, such as trend following and to a lesser extent the Fama-French “High minus Low” factor and the “Low Vol” strategy, are clearly not following this rule, suggesting that these strategies are not risk premia but genuine market anomalies.

Compared to the previous abundant literature, the present results are new in different respects. First, at variance with most previous investigations (that mostly focusses on stock markets), we do not attempt to frame our empirical analysis within the constraining framework of asset pricing and portfolio theory, but rather let the data speak for itself. This is specially important when studying, as we do here, risk premia across a much larger universe of assets, where the notion of a global “risk factor” (generalizing the market factor in the equity space) is far from clear. Second, we introduce a simple way to plot the returns of a portfolio that reveals its skewness to the “naked eye” and suggests an intuitive and robust definition of skewness that is much less sensitive to extreme events. Third, our empirical conclusion that for a wide spectrum of “risk premia” strategies, skewness rather than volatility is a determinant of returns is, to the best of our knowledge, new, as is the finding that some investment strategies – like trend following – seem to behave quite differently.

We first start in Sect. 2 with the equity market as a whole and revisit the equity risk premium world-wide, and its (negative) correlation with the volatility. We then introduce our new, intuitive definition of skewness that we use throughout the paper and that we justify in the Appendix. We focus on the Fama-French factors in Sect. 3 and study the statistics of market neutral portfolios, including a “Low Volatility” portfolio. We move on to the fixed income world (Sect. 4), where we again build neutral portfolios. Sect. 5 is devoted to an account of risk premia on currencies (the so-called “Carry Trade”), and finally, in Sect. 6, to the paradigmatic case of selling options. We summarise our findings in Sect. 7 with a suggestive linear relation between the Sharpe ratio and the skewness of all the Risk Premium strategies investigated in the paper, and discuss some exceptions to the rule – i.e. positive Sharpe strategies with zero or positive skewness – that we define as “pure α strategies". "


Are you looking for more strategies to read about? Check /Screener

Do you want to see performance of trading systems we described? Check /Chart/Performance

Do you want to know more about us? Check /Home/About
 

Continue reading

Impact of 1987 Black Monday on Trading Behavior of Stock Investors

20.July 2016

Explanatory research paper for all short term contrarian strategies:

Title: Black Monday, Globalization and Trading Behavior of Stock Investors

Author: Kim

Link: http://papers.ssrn.com/sol3/papers.cfm?abstract_id=2798536

Abstract:

Using a simple sign test, we report new empirical evidence, taken from both the US and the German stock markets, showing that trading behavior substantially changed around Black Monday in 1987. It turned out that before Black Monday investors behaved more as in the momentum strategy; and after Black Monday more as in the contrarian strategy. We argue that crashes, in general, themselves are merely a manifestation of uncertainty on stock markets and the high uncertainty due to globalization is mainly responsible for this change.

Notable quotations from the academic research paper:

"Research question:
The paper tests whether systematic trading behaviors on stock markets have changed over the long-term. In doing so, the two different trading strategies, momentum and contrarian, serve as the systematic trading strategies. For the empirical part, the daily returns of two sets of stock market data (Deutscher Aktienindex and Dow Jones Index) since 1959 are used. The focus of the analysis is on the distributional property of increases and decreases in returns, especially sequences of the sign. The empirical probability of sequences of the sign is tested by the theoretical distribution resulting from the assumption of the martingale process of return series implying absence of systematic trading strategies.

Results:
The empirical results show that the probabilities of sequences of the same sign (both positive and negative) before Black Monday are significantly higher than those of the theoretical distribution. This means that the investors preferred the momentum strategy. After Black Monday, however, the probabilities of sequences of the same sign are significantly lower than those of theoretical distribution. This means that the investors are tending to trade according to the contrarian strategy.

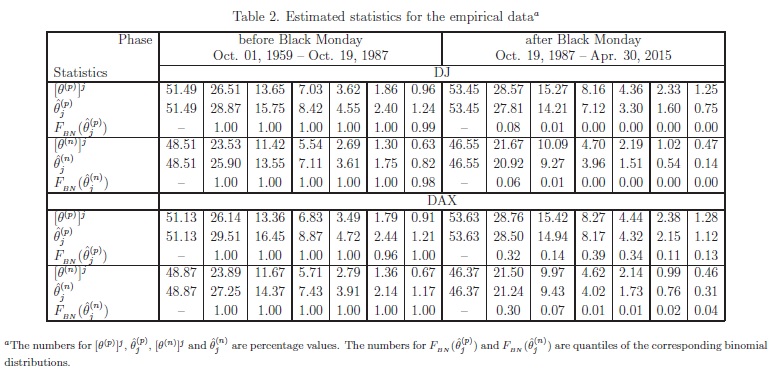
Table 2 shows the following:

• Results for the DJ
– Before Black Monday, the empirical probabilities of sequences of the same sign for both the positive and negative signs (as given in the second and fifth rows of the first block in the upper panel) are significantly higher than those of the theoretical values (as given in the first and fourth rows of the first block in the upper panel) for all six cases (i.e. two-day to seven-day sequences) for both the DJ and the DAX. The percentage values of the cumulative binomial distribution, evaluated at the number of the corresponding sequences, are equal to or higher than 99% except in one case, namely the seven-day negative sequence (98%).
– After Black Monday, the empirical probabilities of sequences of the same sign for both the positive and negative signs (as given in the second and fifth rows of the second block in the upper panel) are significantly lower than those of the theoretical values (as given in the first and fourth rows of the first block in the upper panel) for all six cases (i.e. two-day to seven-day sequences). The percentage values of the cumulative binomial distribution, evaluated at the number of the corresponding sequences, are equal to or lower than 1% except in two cases, namely the one-day positive sequence (8%) and the oneday negative sequence (6%).

• Results for the DAX
– Before Black Monday, the results for the DAX are almost the same as those of the DJ up to a small difference (no meaning to the main results) in the six-day positive sequence and seven-day negative sequence.
– After Black Monday, the empirical numbers of sequences of the same sign for both the positive and negative signs (as given in the second and fifth rows of the second block in the lower panel) are smaller than those of the theoretical values (as given in the first and fourth rows of the first block in the lower panel). The empirical probabilities in terms of the p-values for the positive sign sequences are weaker than the DJ with a range of significance level from 11% to 39%. The negative sign sequences are still highly significant up to the one-day negative sequence (30%).

From these empirical results, we could draw the conclusion that Black Monday has changed trading behavior on stock markets. Before Black Monday, investors tended to buy when the stock return was positive and to sell when the stock return was negative (a day-to-day momentum strategy) while after Black Monday they tended to buy when the stock return was negative and to sell when the stock return was positive (a day-to-day contrarian strategy)."


Are you looking for more strategies to read about? Check /Screener

Do you want to see performance of trading systems we described? Check /Chart/Performance

Do you want to know more about us? Check /Home/About


Continue reading

Has Momentum Lost Its Momentum?

11.July 2016

A related paper has been added to:

#14 – Momentum Effect in Stocks

Authors: Bhattacharya, Li, Sonaer

Title: Has Momentum Lost Its Momentum?

Link: http://papers.ssrn.com/sol3/papers.cfm?abstract_id=2791138

Abstract:

We evaluate the robustness of momentum returns in the US stock market over the period 1965 to 2012. We find that momentum profits have become insignificant since the late 1990s partially driven by pronounced increase in the volatility of momentum profits in the last 14 years. Investigations of momentum profits in high and low volatility months address the concerns about unprecedented levels of market volatility in this period rendering momentum strategy unprofitable. Past returns, can no longer explain the cross-sectional variation in stock returns, even following up markets. Investigation of post holding period returns of momentum portfolios and risk adjusted buy and hold returns of stocks in momentum suggests that investors possibly recognize that momentum strategy is profitable and trade in ways that arbitrage away such profits. These findings are partially consistent with Schwert (2003) that documents two primary reasons for the disappearance of an anomaly in the behavior of asset prices, first, sample selection bias, and second, uncovering of anomaly by investors who trade in the assets to arbitrage it away. In further analyses we find evidence that suggest three possible explanations for the declining momentum profits that involve uncovering of the anomaly by investors, decline in the risk premium on a macroeconomic factor, growth rate in industrial production in particular and relative improvement in market efficiency.

Notable quotations from the academic research paper:

"In this paper, we investigate whether momentum profits have been driven away or at the very least its pattern altered in the wake of growing knowledge about momentum strategy and competition amongst arbitrageurs who trade on it, if we were to believe momentum profits were caused in the first place due to delayed price reactions to firm-specific information as suggested by Jegadeesh and Titman (1993, 2001).

Our analyses span over the period between 1965 and 2012. We divide the entire time period into three subperiods. The first subperiod corresponds to the Jegadeesh and Titman (1993) sample period, 1965 to 1989, the second subperiod covers the Jegadeesh and Titman (2001) “out of sample period”, 1990 to 1998, the third subperiod corresponds to the period 1999 to 2012. In our study, we choose to examine the persistence of momentum profits while avoiding concerns of data dredging by conducting tests in our out-of-sample period that starts at the beginning of 1999 immediately after Jegadeesh and Titman’s (2001) “out of sample period” ends. Using the data over the 1999 to 2012 sample period, we find that Jegadeesh and Titman (1993) momentum strategies fail to yield profits in the more recent times. This period is particularly interesting as it witnessed the dot-com bust after catching the boom by its tail and also the financial crisis followed by the greatest stock market meltdown since the great depression. One of our concerns in dealing with this unique period is what if the recent turbulence in the economy with a series of high-loss episodes in the US stock market and unprecedented levels of market volatility has rendered momentum strategy unprofitable?

We employ alternate methodologies to scrutinize whether the rapid decline of momentum profits to insignificant levels in this 14 year period is indeed an outcome of the marked rise in market volatility. For instance, we use controls for the periods of unusual volatilities in the capital market, 2007 to 2009 in particular and yet fail to reject the hypothesis that momentum profits have not declined to insignificant levels. Excluding the last financial crisis, 2007 to 2009 serves the additional purpose of excluding spring of 2009 that witnessed the biggest momentum crash in the history of stock market since the summer of 1932 as alluded to by Daniel and Moskowitz (2012). Next, we employ the daily median volatility index, VXO for the period 1986 to 1998 to classify months in the latest subperiod into high and low expected volatility months.5 If momentum profits have declined because of increased volatility of the market, momentum strategy should be profitable at least in months when the implied volatility is as low as in low volatility months in the period 1986 to1998, a period when momentum is profitable. However, what we document is that while momentum strategy is profitable in the period 1986 to 1998 no matter the implied volatility, it fails to generate profit for the period 1999 to 2012 even in the 60 months classified as low volatility months primarily clustered between November 2003 and July 2007.

We also investigate whether momentum profits resurface in this period following up markets as documented by Cooper, Gutierezz and Hameed (2004). Not only are these momentum profits insignificant on average following up markets, their distribution also reveal visible and statistical difference from those in the periods 1965 to 1989 and 1990 to 1998, indicating a deeper and more fundamental change in the underlying process of generation of momentum profits, beyond huge market crashes. The distribution of up market momentum profits in this period is extremely volatile interspersed with huge negative returns that suggest that momentum as a strategy has become riskier in the latest subperiod compared to the two earlier subperiods. Further analysis indicates that the idiosyncratic volatility of momentum portfolio returns has increased compared to the previous periods. We also examine whether cumulative past returns can explain the cross-sectional variation in stock returns. In the presence of return continuation, we expect past stock returns to be positively related to current stock returns, especially following up markets since momentum profits are essentially up market phenomena. As expected in the periods 1965 to 1989 and 1990 to 1998, current stocks returns are positively related to past returns exclusively following up markets. However, in the current subperiod, with decline in momentum profits past returns fail to explain current returns following up markets and show a reliably negative relation following down market.

We suggest three possible explanations for the declining momentum profits that involve uncovering of the anomaly by investors, decline in the risk premium on a macroeconomic factor, growth rate in industrial production in particular, and relative improvement in market efficiency.

The first explanation proposes that momentum profits decline post 1998 because investors become increasingly aware about the profitability of implementing a relatively simple momentum trading strategy, wherein they identify winner (loser) stocks and buy (sell) them. The growing awareness and competition amongst these investors would lead to an increasingly earlier identification and trading of momentum stocks. This explanation predicts intensified reaction to both winner and loser stocks in the identification period itself, which would result in either exhaustion or, at the least, a substantial reduction in return continuation in the holding period.6 We find evidence consistent with this prediction.

The second explanation is based on the findings of Liu and Zhang (2008) who document that growth rate of industrial production, in various specifications, explains over half of the momentum profits. We find that in the latest subperiod although the momentum portfolio’s returns continue to load on this industrial production factor, this particular risk factor is no longer priced.

The third explanation explores the possibility of relative improvement in market efficiency. Following Griffin, Kelley, and Nardari (2010), we compute their DELAY measure, that reflects the degree of response of stock returns to past market returns, and we record a fairly significant reduction in delay in all size portfolios but for the largest one."


Are you looking for more strategies to read about? Check /Screener

Do you want to see performance of trading systems we described? Check /Chart/Performance

Do you want to know more about us? Check /Home/About

Continue reading

Taxonomy of CTAs

1.July 2016

Related to all CTA strategies:

Title: Just a One Trick Pony? An Analysis of CTA Risk and Return

Link: http://papers.ssrn.com/sol3/papers.cfm?abstract_id=2791960

Abstract:

Recently a range of alternative risk premia products have been developed promising investors hedge fund/CTA like returns with higher liquidity, transparency and relatively low fees. The attractiveness of these products rests on the assumption that they can deliver similar returns. Using a novel reporting bias free sample of 3,419 CTA funds as a testing ground, our results suggest this assumption is questionable. We find that CTAs are not a homogenous group. We identify eight different CTA sub-strategies, each with very different sources of return and low correlation between sub-strategies. When we specify recently identified alternative risk premia as factors to examine the sources of return of CTAs, we find that these premia fail to explain between 56% and 86% of returns. Our results for CTAs suggest that while these new products may deliver on liquidity, transparency and fees, investors expecting hedge fund CTA – like returns may be disappointed.

Notable quotations from the academic research paper:

"Our first finding is that CTAs are in fact very different from each other. We utilise statistical clustering techniques to identify different types of CTA and classify them into eight sub-strategies. The different sub-strategies generally have low cross correlation and generate their returns from very different sources. Our second key finding is that alternative risk premia do not explain a large proportion of CTA returns.

We use the BarclayHedge CTA database as our source of CTA returns data due to its depth of coverage.

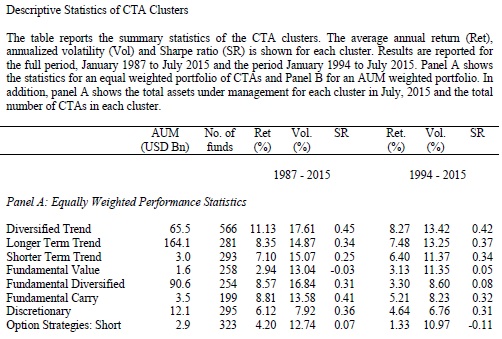
Our sample is divided into eight clusters following Brown and Goetzmann (1997). We carry out clustering as an iterative process. Funds are first assigned to initial clusters. Next we calculate the time series of the average cross sectional returns of each cluster. The next step is to estimate the correlation between each fund’s return and each cluster’s return. Using these correlations we reassign funds to the cluster with which they have the highest correlation. The process is repeated until no funds change cluster.

The largest category, by number of funds, is Diversified Trend which is comprised mainly of the BarclayHedge “Technical-Diversified” category, while the smallest grouping is Fundamental Carry, which has quite a large spread of BarclayHedge categories but is positively correlated to the carry alternative risk premium. Longer Term Trend is comprised principally of BarclayHedge “Technical-Diversified” category but is correlated with the time series momentum alternative risk premium which is a relatively longer duration signal, whereas Shorter Term Trend is correlated with the option risk premium which captures shorter term trend following effects. Fundamental Value is correlated with the Value risk premium, with a negative Carry relationship, whereas Fundamental Diversified is comprised principally of BarclayHedge “Fundamental – Diversified” category funds. Option Strategies: Short is made up predominantly of BarclayHedge “Option Strategies” funds. Finally, Discretionary funds are comprised of a mixture of technical and fundamental funds, with no obvious match to the BarclayHedge categories or the alternative risk premia.

In this paper we use four alternative risk premia to capture the sources of CTA returns – Value, Carry, Time-Series Momentum and Option Strategies.

We present an analysis dividing the returns of CTA clusters into alternative risk premia exposure and alpha. Looking first at the equal weighted clusters, the explanatory power of the models is modest with adjusted R2 range from 14% to 44%. All of the clusters have a statistically significant relationship with at least one of the alternative risk premia. Longer Term Trend, Fundamental Value, Fundamental Carry and Option Strategies all have positive value exposure, while only Fundamental Diversified is negatively related to value. Fundamental Diversified, Fundamental Carry and Option Strategies are all positively related to carry, whereas Fundamental Value has a negative carry coefficient. The third alternative risk premium, time series momentum, is positively related to Diversified Trend, Longer Term Trend and Option Strategies"


Are you looking for more strategies to read about? Check /Screener

Do you want to see performance of trading systems we described? Check /Chart/Performance

Do you want to know more about us? Check /Home/About


Continue reading

Momentum Anomaly and Baseball Cards

24.June 2016

A very interesting paper related to fundamentals of momentum anomaly:

Title: Stock Market Anomalies and Baseball Cards

Link: http://papers.ssrn.com/sol3/papers.cfm?abstract_id=2798951

Abstract:

We show that the market for baseball cards exhibits anomalies that are analogous to those that have been documented in financial markets, namely, momentum, price drift in the direction of past fundamental performance, and IPO under performance. Momentum profits are higher among active players than retired players, and among newer sets than older sets. Regarding IPO under performance, we find that newly issued rookie cards under perform newly issued cards of veteran players, and that newly issued sets under perform older sets. Our evidence is consistent with the predictions of Hong and Stein (1999) and Miller (1977).

Notable quotations from the academic research paper:

"Financial economists have documented the existence of simple strategies that earn unusually high or low returns despite the fact that the strategies do not load heavily on common risk factors. For example, Jegadeesh and Titman (1993) document that during holding periods of 3-12 months, stocks that have performed well in the past 3-12 months continue to outperform stocks that have performed poorly in the past 3-12 months. In addition, Ritter (1991) documents that firms that have recently gone public underperform their peers over their first three years of public trading.

The point of this study is to use a non-financial laboratory in which some, but not all, of theories trying to explain momentum should apply. If we find momentum, this would be evidence that momentum can exist naturally in markets without the bells and whistles of dynamic growth rates, dividends or mutual funds.

Our laboratory is the market for baseball cards. Baseball cards have a long history, dating all the way back to the late 1860’s. By 1991, sales of baseball cards reached $1.2 billion annually. Although baseball cards produce no cash flows, their market values can be substantial. For example, the T206 Honus Wagner, which was produced from 1909-1911, has been sold for as much as $2.8 million. Because there have been long periods of time over which their values have appreciated, baseball cards have often been perceived as investment vehicles.

Most theories of momentum do not apply to this market. There are no growth options, dividends, or mutual funds.

Among the behavioral theories, Hong and Stein (1999) is the one that should most apply to the market for baseball cards. In their model, momentum arises because information gradually diffuses across the investor population. If Hong and Stein theory is valid, then we should find momentum not only in financial markets, but in any market with gradual information diffusion such as the market for baseball cards. Obviously, there are many significant differences between the market for baseball cards and the stock market. One difference is the level of investor sophistication. In the stock market, there are many hedge funds that can arbitrage away inefficiencies and keep prices in line with fundamentals. In the baseball card market, there are dealers who are relatively sophisticated, but much of the activity in this market is driven by children. Moreover, whereas it is common to short stocks, there is little (if any) short selling of baseball cards. Hence, the opportunity for arbitrage is severely limited in the baseball card market. Because of these differences, if gradual information diffusion is truly a source of momentum profits, we should expect momentum to be significantly stronger in the market for baseball cards because the participants are generally less sophisticated and there are fewer opportunities for arbitrage. Consistent with this prediction, we find that short run (3 month) momentum strategies earn 5.6% per month, whereas momentum strategies in the stock market earn less than 1% per month.

Hong and Stein provide additional testable predictions in this market. Active players play up to 162 regular season games per year in addition to the postseason, whereas retired players do not play any games. If gradual information diffusion causes momentum, then momentum should be stronger among the cards of active players than retired players, because there is little to no new information released about the ability (or performance) of retired players. Consistent with this prediction, we find that when the 3 month momentum strategy is restricted to retired players, the strategy earns only 1.63% per month, but when the 3 month momentum strategy is restricted to active players, the strategy earns 9.42% per month.

We test also IPO effect (as in Miller (1977))by analyzing the performance of rookie cards and new sets. A card is a considered a “rookie card” if it is the player’s first appearance on a regular issue card from a major card company. Players often have rookie cards before they play in the major leagues, and some players with rookie cards never make it to the major leagues. Like young firms, there is less information about rookies so it is more difficult to determine their quality/ability. Moreover, when sets are first released, there is a lot of uncertainty over the number of sets produced and how other collectors will value the sets. Hence, according to Miller (1977), we should expect rookie cards and new sets to underperform. Consistent with this prediction, we find that rookie cards and new sets have cumulative abnormal returns of –6.6% and –5.7% (respectively) over the 12 months following their release, both of which are statistically significant (t = 2.8 and 2.8 respectively)."


Are you looking for more strategies to read about? Check /Screener

Do you want to see performance of trading systems we described? Check /Chart/Performance

Do you want to know more about us? Check /Home/About


Continue reading

Information Ratio Analysis of Time-Series Momentum Strategy

16.June 2016

A related paper has been added to:

#118 – Time Series Momentum Effect

Authors: Ferreira, Silva, Yen

Title: Information ratio analysis of momentum strategies

Link: http://arxiv.org/abs/1402.3030

Abstract:

In the past 20 years, momentum or trend following strategies have become an established part of the investor toolbox. We introduce a new way of analyzing momentum strategies by looking at the information ratio (IR, average return divided by standard deviation). We calculate the theoretical IR of a momentum strategy, and show that if momentum is mainly due to the positive autocorrelation in returns, IR as a function of the portfolio formation period (look-back) is very different from momentum due to the drift (average return). The IR shows that for look-back periods of a few months, the investor is more likely to tap into autocorrelation. However, for look-back periods closer to 1 year, the investor is more likely to tap into the drift. We compare the historical data to the theoretical IR by constructing stationary periods. The empirical study finds that there are periods/regimes where the autocorrelation is more important than the drift in explaining the IR (particularly pre-1975) and others where the drift is more important (mostly after 1975). We conclude our study by applying our momentum strategy to 100 plus years of the Dow-Jones Industrial Average. We report damped oscillations on the IR for look-back periods of several years and model such oscilations as a reversal to the mean growth rate.

Notable quotations from the academic research paper:

"Similar to Moskowitz, Ooi and Pedersen, we focus on the momentum of individual assets.  We study the technical rule (moving average of past returns) for one asset, therefore avoiding the portfolio effect that is important for cross-section momentum. This work adds to the paper of [ Moskowitz, T. J., Ooi, Y. H., Pedersen, L. H.. Time series momentum.] by looking at the information ratio of the time series momentum strategy.  Our work also contributes to the literature of linking momentum to cycles/regimes.  However, contrary to the previous studies, we do not associate economical episodes to the regimes.  Our approach is to divide and transform the data in a way such that the final asset returns are as close as possible to stationary.  We believe that our work is new in this respect.

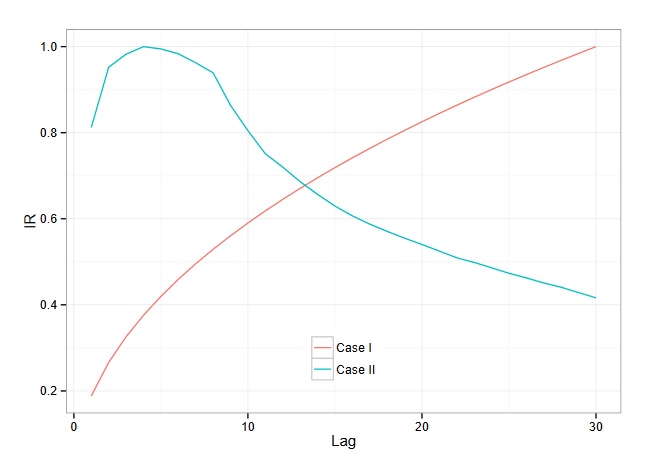
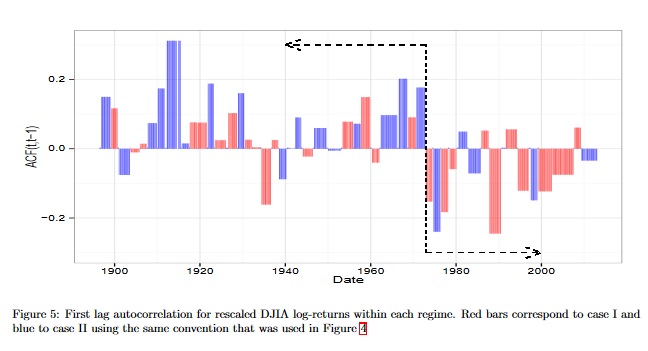
We study momentum by looking at the risk adjusted performance measured by the information ratio (IR) as a function of the look-back lag used to construct the portfolio. Our main new contribution from a mathematical point of view, is to present in close form the risk associated with the momentum strategy. Previous works calculate the same expression for the average return as given here, however they do not calculate the standard deviation of the strategy.  Furthermore, we analyze the stability of  the results across time as non-stationary effects become important in explaining the results.  We find that both autocorrelation and mean drift of the random process are important in the final performance of the strategy. In particular, for look-back periods up to 4 months, the most important effect is the autocorrelation; and for look-back periods larger than 4 months to 1 year, the drift.  However, in contrast with previous studies, we find that the mean drift is the most important factor after 1975.

In case I, all the autocorrelations are zero, performance comes from the drift. In case II all performance comes from autocorrelation. Lag is in weeks.

"


Are you looking for more strategies to read about? Check /Screener

Do you want to see performance of trading systems we described? Check /Chart/Performance

Do you want to know more about us? Check /Home/About

Continue reading
Subscription Form

Subscribe for Newsletter

 Be first to know, when we publish new content
logo

Log in