Cultural Calendars and the Gold Drift: Are Holidays Moving GLD ETF?
Introduction
Financial markets exhibit persistent calendar anomalies, which often defy the efficient‐market hypothesis by generating predictable return patterns tied to institutional or cultural events. In this paper, we document a novel, globally pervasive drift in gold prices surrounding major wealth-oriented festivals across the four principal cultural and religious domains: Christianity, Islam, Hinduism, and East Asian syncretic traditions. While each community endows its principal holidays with gift‐giving rituals and conspicuous displays of wealth, the sole differentiator among regions is the precise timing of these festivities on the Gregorian calendar.
Our central thesis is that gold, owing to its dual role as a universal wealth reservoir and socio-cultural status symbol, experiences concentrated, holiday-induced buying pressure that yields persistent and economically material drift in the GLD ETF. By quantifying this effect across four distinct cultural calendars, we introduce a previously undocumented demand-side factor into commodity-pricing models.
By demonstrating that the ‘holiday effect’ is a globally pervasive phenomenon, transcending regional market microstructures, trading hours, and local currency fluctuations, we highlight gold’s unique role as a universal medium of exchange for wealth transfers. This finding has profound implications for global investors and policymakers, suggesting that cultural factors should be considered in international asset allocation strategies. This calendar-linked price drift challenges existing theories of asset pricing by revealing that socio-cultural consumption patterns can impose systematic biases on an ostensibly global and continuously traded commodity. Our findings advance the behavioral finance literature by illustrating how cultural calendars, as determinants of consumer behavior, can systematically influence asset pricing. This underscores the necessity for integrating socio-cultural factors into multi‐factor models of commodity returns and risk management strategies, thereby enhancing predictive accuracy and investment decision-making.
Background
The theoretical foundation for our study rests on the premise that gold functions universally as a store of wealth and a means of conveying socio-economic status. Whereas earlier studies of festival-driven anomalies concentrate on idiosyncratic, local-currency, or equity markets, we redirect attention to gold, an internationally traded, low-correlation safe-haven. This pivot reveals that socio-cultural rituals exert a demand effect so pervasive that it transcends national boundaries and standard risk factors.
Given gold’s low correlation with equities and its historical role in gift-giving rituals—ranging from wedding dowries in South Asia, to Eid al-Adha presents in the Muslim world—it stands to reason that aggregate festival-driven purchases will generate abnormal returns around key dates. We identify four major cultural clusters:
- the Gregorian-calendar Christians,
- the Islamic Hijri-calendar adherents,
- the Hindu lunisolar calendar participants, and
- the East Asian lunar-solar festival operators.
Choice of Included Holidays
Each cluster observes signature wealth-oriented celebrations: Christmas and Easter for Christians, Eid al-Fitr and Eid al-Adha for Muslims, Diwali and Akshaya Tritiya for Hindus, and the Lunar New Year and Mid-Autumn Festival for East Asian communities. Bolded ones are our points of attention included in strategy creation, and presented with data sources in the following section.
Although the timing of these observances varies—shifting annually for lunar events and fixed for solar events—their economic effect on gold demand is hypothesized to be temporally localized yet globally detectable. By mapping these festival dates onto a unified Gregorian calendar framework, we can conduct cross-regional comparative analyses of pre- and post-event price behavior in a single traded instrument.
Methods and Data
Primary Data Sources
GLD ETF was chosen because of its ease of trading access to both institutional clients and individual retail investors, due to its very good liquidity.
We source daily GLD ETF price data from EODHD.com – the sponsor of our blog. EODHD offers seamless access to +30 years of historical prices and fundamental data for stocks, ETFs, forex, and cryptocurrencies across 60+ exchanges, available via API or no-code add-ons for Excel and Google Sheets. As a special offer, our blog readers can enjoy an exclusive 30% discount on premium EODHD plans. Our data sample is covering the period January 2005 through July 2025.
Festival dates of earlier-mentioned cultures and their schedules are obtained from Time and Date and validated against Wikipedia, when needed (for example, Eid al-Fitr in the Gregorian calendar):
- Western: Christmas
- Islamic: Eid al-Fitr
- Hindu: Diwali/Deepavali
- Confucian: Chinese New Year
Sample Effect Window Choice
We define each event window from three/five trading days before (D–3/D-5) to three/five trading days after (D+3/D+5) the festival date, with D0 representing the Gregorian calendar date of the observance.
Given that some local exchanges close for multi-day holidays, potentially postponing futures and spot trading, our analysis relies exclusively on the American trading calendar to capture continuous gold-price dynamics.
For example, HKEX is closed on Lunar New Year’s Day D0, the second day of Lunar New Year D+1, and the third day of Lunar New Year D+2. At the same time, the Saudi Exchange Holiday Calendar varies with no predetermined closing schedule (being closed always at least 2 days before and after the actual holiday).
Initial Analysis
Our first, and preliminary, empirical approach combines histogram analysis of raw return distributions with calendar‐time cumulative abnormal return (CAR) measures. We segment the sample into four regional cohorts and construct four event-window charts to inspect drift patterns visually:

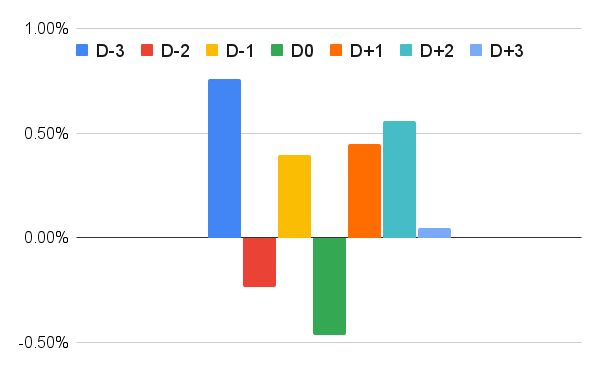
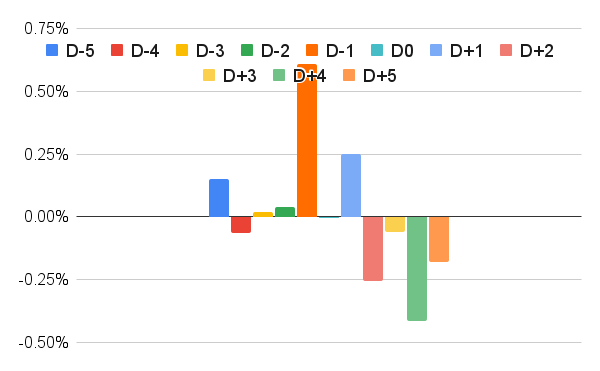
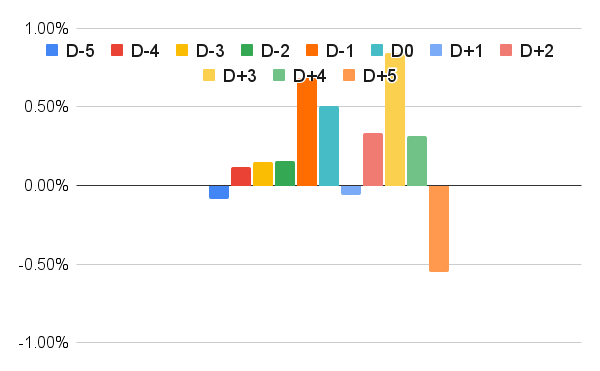
Statistical inference is asserted using austere linear observance to assess the significance of mean returns over the joint interval D–3/D-5 through D+3/D+5. Despite variations in the precise timing of peak drift across regions, we document a robust, positive gold‐price drift surrounding all major wealth‐oriented holidays, thereby affirming our hypothesis that cultural ritual demand induces a predictable calendar anomaly in gold markets. We will get back to these seemingly random fluctuations and address them with our sensitivity analysis and robustness test of the alternative trading window while discussing possible implications later in the article.
These preliminary findings give us a good starting point to develop simple strategies that can be performed to capture this idiosyncratic premium.
Results
Simple Strategy
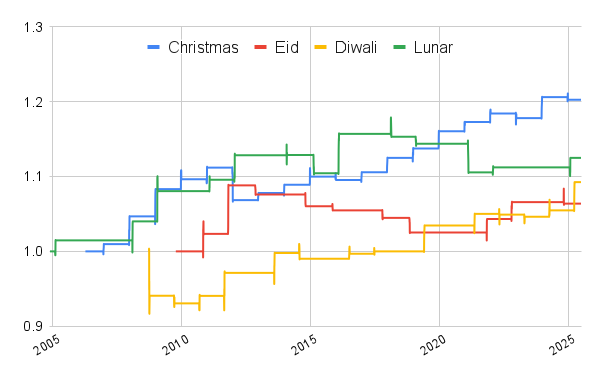
After several attempts at educated guessing to find a typical pattern and set a unified trading window, we assess the performance of simple event-driven strategies that buy GLD at the close of day D–2, holds during D-1, D0, D+1, and liquidate at the close of day D+2, separately for each of the four cultural regions.
Cumulative equity curves for the Western (Christian), Islamic, Hindu, and Confucian event windows are plotted in Figure 1.
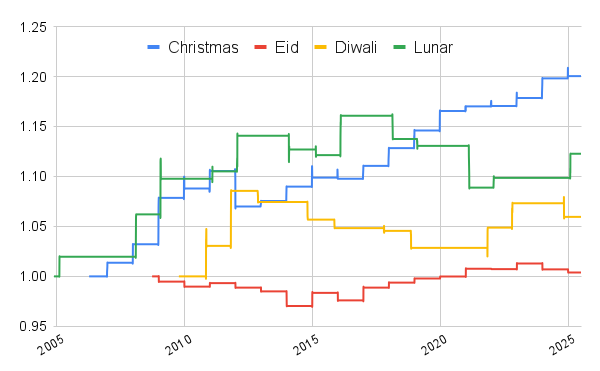
Summary performance metrics are reported in Table 1 in the fashion of our standard reporting in Basic Overview of Portfolio Analysis with annualized return, annualized volatility, Sharpe Ratio, maximum drawdown, and Calmar Ratio:
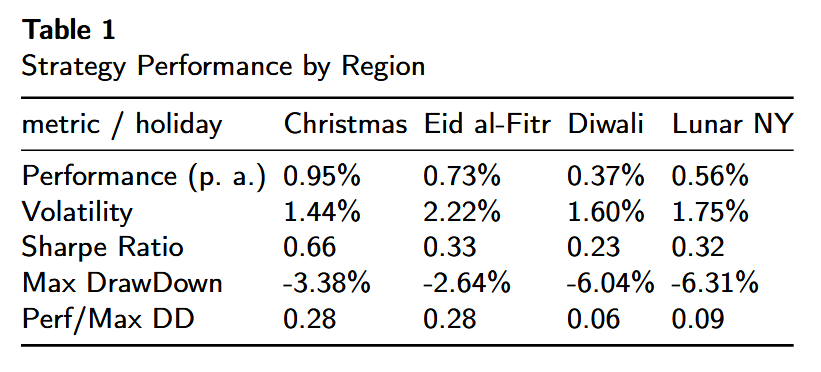
All four regional strategies generate positive average returns over the D–1 to D+2 window, with the Sharpe ratio outstanding for Christmas, the most famous holiday worldwide in Western culture. Maximum drawdowns remain modest (spinning for traditional Eastern regions) given the short holding period, and volatility is comparable across regions.
Alternative Strategy
In exploring an alternative trading strategy that extends the event window to encompass two days before the holiday (D–2) and two days following (D+2), we anticipate a potential deterioration in performance metrics compared to the more focused D–1 to D+2 approach. This broader window may introduce increased market noise and volatility, as it captures additional trading days that could be influenced by external factors unrelated to the holiday effect.
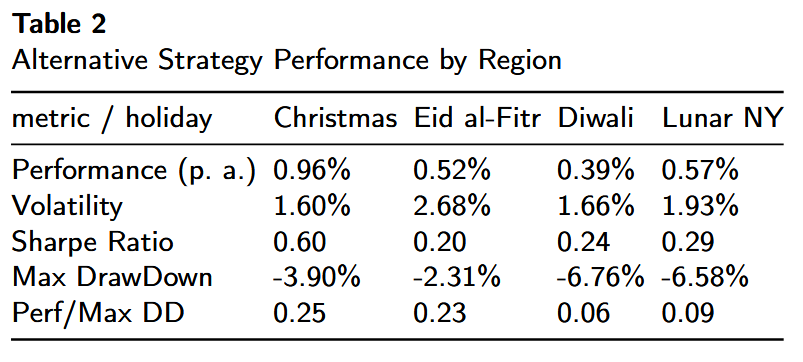
Preliminary analysis suggests that the cumulative return curves for this extended strategy still exhibit almost the same positive returns across the three cultural regions. Still, the Muslim counterpart lags significantly behind the first strategy version. The average volatility is higher, and the Sharpe ratios reflect diminished risk-adjusted performance. Furthermore, the maximum drawdowns could be more pronounced, indicating a higher susceptibility to adverse market movements during the extended holding period.
This underscores the importance of precision in timing when capitalizing on calendar-induced price drifts in the GLD ETF, as the inclusion of extraneous trading days may dilute the efficacy of the strategy. This all boils down to the preparation of a suitable and optimal final, aggregated strategy based on those findings.
Final Strategy
We next construct an aggregated “Global Holiday Drift” strategy that simultaneously enters all four regional event windows when they occur. Specifically, on each trading day, we go long GLD if it falls within any D–1 (D-2 for alternative strategy) to D+2 interval of a major festival in any region, and we close all positions at the end of that day’s aggregated window if no other open event window remains. Figure 3 displays the cumulative equity curve of this unified strategy, and Table 3 reports its performance.
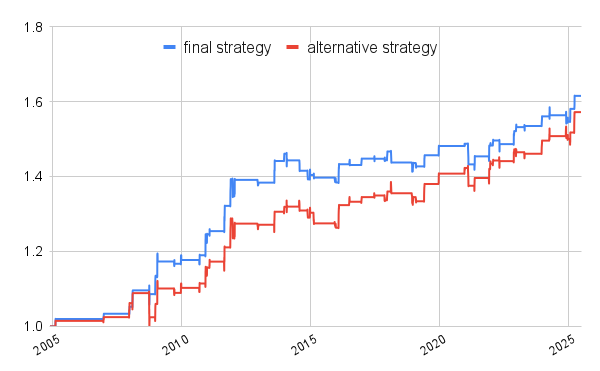
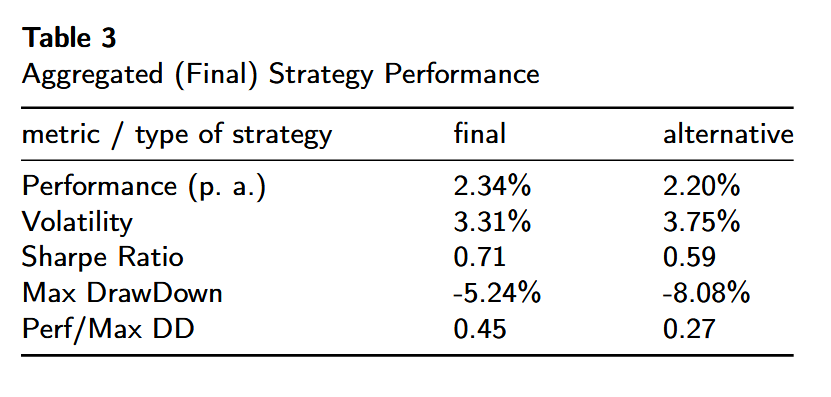
The unified strategy improves risk‐adjusted performance over any single‐region implementation, achieving a Sharpe ratio of 0.71 and a slightly higher annualized return than the regional averages. Diversification across cultural calendars reduces drawdown risk and dampens volatility.
Lag of the Muslim world during the alternative trading window had an impact on the performance and risk of the alternative strategy, which confirms our hypothesis, that fine-tuning might be needed.
Discussion & Conclusion
Our empirical findings confirm the existence of a robust gold‐price drift around major wealth‐oriented holidays across all principal cultural zones. The aggregated Global Holiday Drift strategy not only yields economically meaningful returns with modest risk but also provides actionable insights for investors seeking to capitalize on calendar effects rooted in socio-cultural consumer behavior. This practical application of our findings can inform tactical asset allocation and risk management strategies, making it a valuable resource for both institutional and retail investors aiming to enhance portfolio performance.
Several avenues remain for refinement. The precise choice of entry and exit days may be fine‐tuned by partial scaling in and out, dynamic sizing based on realized volatility, or adjusting for event clustering when multiple festivals overlap. Incorporating transaction costs and liquidity constraints in less liquid environments could further calibrate the practical implementation.
In sum, cultural calendars emerge as a robust new driver in commodity returns—one that can be integrated alongside momentum, carry, and volatility factors in multi-factor models. Beyond model specification, our findings carry strategic implications for both risk managers (tailoring hedges around holiday spikes) and portfolio managers (optimizing tactical allocation to gold during known cultural demand windows).
Author: Cyril Dujava, Quant Analyst, Quantpedia
Are you looking for more strategies to read about? Sign up for our newsletter or visit our Blog or Screener.
Do you want to learn more about Quantpedia Premium service? Check how Quantpedia works, our mission and Premium pricing offer.
Do you want to learn more about Quantpedia Pro service? Check its description, watch videos, review reporting capabilities and visit our pricing offer.
Are you looking for historical data or backtesting platforms? Check our list of Algo Trading Discounts.
Would you like free access to our services? Then, open an account with Lightspeed and enjoy one year of Quantpedia Premium at no cost.
Or follow us on:
Facebook Group, Facebook Page, Twitter, Linkedin, Medium or Youtube
Share onLinkedInTwitterFacebookRefer to a friend


