Sunspots as a Natural Signal for Trading Wheat Futures?
Sunspots are temporary phenomena on the Sun’s surface that appear as dark spots due to lower temperatures compared to surrounding areas. They are associated with solar magnetic activity and follow an approximately 11-year cycle. While sunspots themselves may seem distant from everyday concerns, their influence on Earth’s climate – particularly through solar irradiance – has long been studied.
This led us to explore whether solar activity could serve as a predictive indicator for agricultural commodity prices, such as wheat or corn. Periods of high sunspot activity are often associated with warmer and more variable weather patterns in the upper atmosphere, with limited but potentially relevant effects on Earth’s climate. Slight increases in air temperature may enhance crop yields, which could, in turn, place downward pressure on prices. However, we assume that the effect of sunspot counts is more likely to manifest over the coming years rather than in the short term.
We propose to explore whether a structured investment strategy, such as tranche-based entry timing, could take advantage of this relationship. By monitoring sunspot activity and anticipating its potential impact on agricultural output, we aim to assess whether sunspot data can improve the timing and performance of commodity investments.
Introduction
According to Space Weather Prediction Center, sunspots are temporary dark areas on the Sun’s surface caused by intense magnetic activity. They typically appear in pairs or groups, vary significantly in size and can persist for weeks. Sunspots follow an approximately 11-year cycle, known as the solar cycle, alternating between periods of high and low solar activity, which influences the amount of solar radiation reaching Earth. During periods of heightened sunspot activity, the Sun emits slightly more energy. Historically, extended periods of low sunspot activity have coincided with colder climates, such as during the so-called “Little Ice Age.”
This led us to consider whether sunspot counts could serve as a practical indicator for agricultural commodity prices, particularly for wheat or corn. Our hypothesis is that elevated sunspot activity might signal more favorable growing conditions due to warmer weather, potentially bountiful harvest and driving prices down. We propose to investigate whether this relationship can be leveraged through a simple yet effective strategy, such as tranche-based investment timing to better navigate commodity markets using publicly available sunspot data, both in futures and spot prices.
Methodology
Since futures data doesn’t extend far enough into past, we decided to also explore spot prices. However, it’s necessary to combine data from multiple sources in order to obtain a continuous price series for each commodity, as availability varies over time.
Regarding sunspot data, this research uses the dataset of monthly mean total sunspot numbers from 1749 to May 2025, available from the Solar Influences Data Analysis Center. For consistency with our strategy, we transform this data into quarterly frequency, as we aim to rebalance on a quarterly basis using a tranching approach. We apply three variants of this method:
- 4 tranches: 12-month holding period with quarterly rebalancing,
- 8 tranches: 24-month holding period with quarterly rebalancing,
- 12 tranches: 36-month holding period with quarterly rebalancing.
In our previous article Analysis of Price-Based Quantitative Strategies for Country Valuation, we described this tranching strategy as follows: Consider regular quarterly rebalancing, for example on March 31, June 30, September 30 and December 31 of each year. Only a pre-selected part of the portfolio is rebalanced at each date. This is known as industry-standard tranching. Focusing on a 36-month holding period (12 tranches), the portfolio is divided into 12 sub-portfolios. Each tranche is rebalanced once every 3 years (36 months) and contributes 1/12 of the total portfolio weight. To illustrate this approach, we present a modified example adapted from the aforementioned article to better reflect the current context:
On December 31, 1997, the first tranche is invested; we go short on underlying asset if the number of sunspots of previous month exceeds the specified threshold, otherwise, we do not invest. These positions are held until December 31, 2000. A second tranche is initiated on March 31, 1998, and held until March 31, 2001. This process continues each quarter, resulting in 12 staggered sub-strategies with overlapping three-year holding periods. The final portfolio is the equally weighted average of these 12 tranches.
The same principle is applied for the 12-month (4 tranches) and 24-month (8 tranches) holding periods, with adjustments in the number of tranches and corresponding holding durations.
Now, knowing the principle of tranching, we can incorporate it into our strategy. Suppose both the quarterly commodity prices and sunspot numbers are prepared. The only remaining step is to define a threshold. If the number of sunspots in a given quarter is higher (or alternatively lower) than the chosen threshold, it generates a signal to invest, either by entering a long or short position using a tranche-based approach. This is based on the assumption that the effects of solar activity may only manifest over the coming years, rather than immediately. Moreover, it’s important to account for the fact that sunspot data is available with a one-month lag.
In our research, we examine how the investment performs under two scenarios: short positions are initiated when the number of sunspots exceeds a predefined threshold (based on the assumption that higher solar activity signals more favorable growing conditions and thus lower commodity prices). Conversely, long positions are taken when sunspot counts fall below the threshold. Consider that the starting portfolio value is set to 1.
Basic performance characteristics in tables are presented as follows: the notation perf represents the annual return of the strategy, st dev stands for the annual standard deviation, max dd is the maximum drawdown, adjusted Sharpe r is calculated as the ratio of perf to st dev and adjusted Calmar r as the ratio of perf to max dd.
Firstly, let’s explore whether the number of sunspots potentially influences the price of wheat futures, followed by an analysis of the spot price.
Futures
For the backtest, we utilize a dataset of continuously rolled wheat futures consisting of back-adjusted daily data from November 23, 1979, to April 30, 2025 sourced from Premium Data. Before the main analysis, let’s take a look at the futures prices themselves.

As we can see in the graph, the price has a long-term declining tendency (mainly due to negative roll yield over time caused by storage and carry costs). Therefore, we will use a quarterly rolling short position as a benchmark.
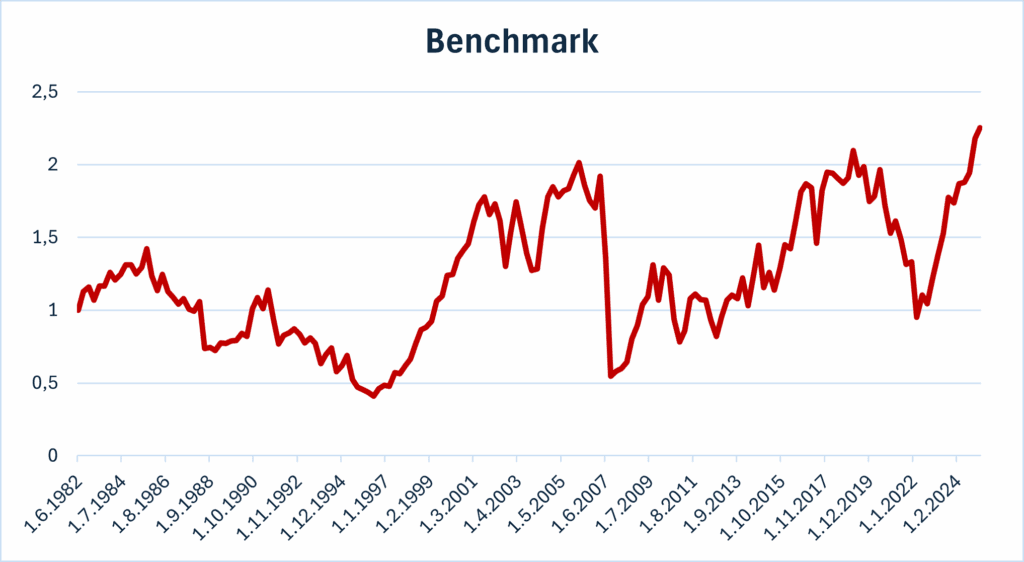
Even though the benchmark shows an upward trend, its performance is not particularly strong, with a yearly return barely reaching 2% and markable variablity, showing not only graphically, but also on the result of standard deviation. Can our market timing strategy outperform this indicator and deliver more efficient results?
Short positions
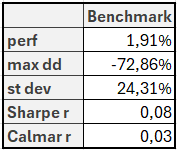
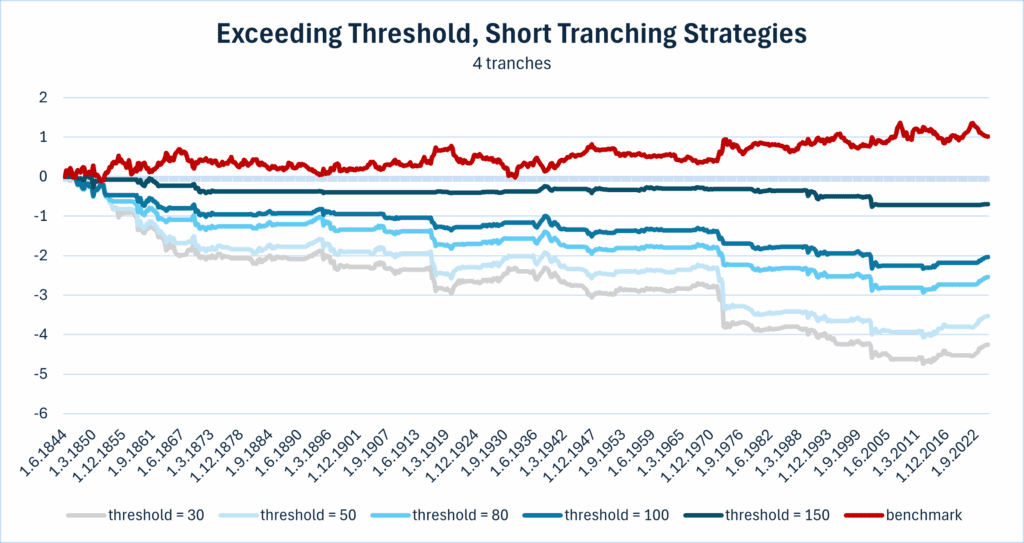
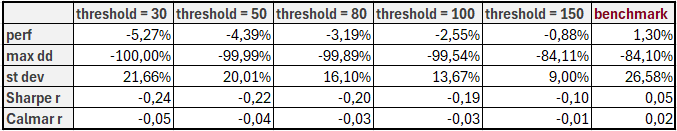
We first focused on short tranching strategy, entering a short position when the number of sunspots exceeds a given threshold, anticipating a price decline, with 4 tranches and several threshold values: 30, 50, 80, 100, and 150.
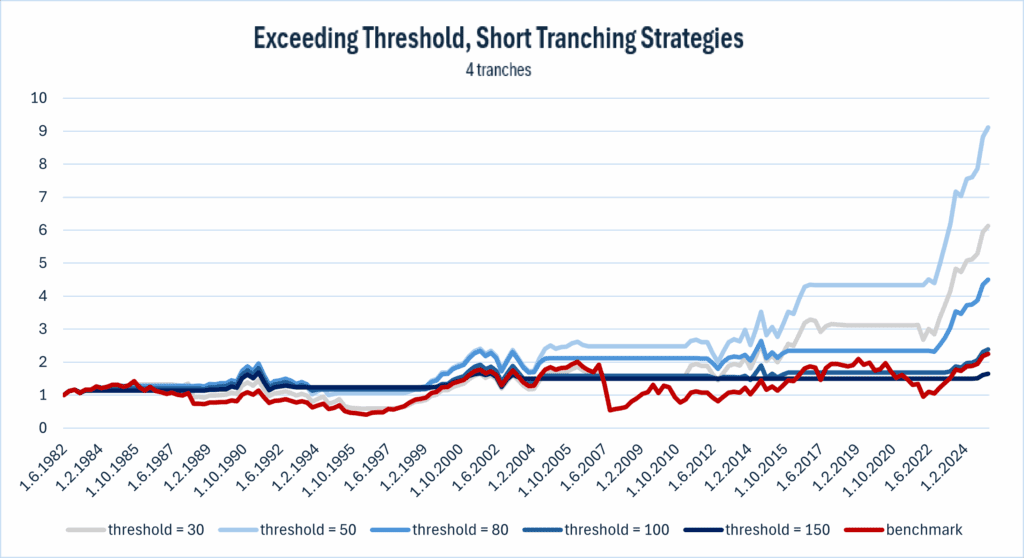
It is evident that strategies using the number of sunspots exceeding the threshold as a signal for short positioning with four tranches are more profitable than the benchmark, which relies solely on a rolling short position, especially when the threshold is set to 50. With a return of 5.27%, a standard deviation of 14.83%, and a maximum drawdown of -45.46%, this strategy clearly outperforms the benchmark, achieving a Sharpe ratio more than four times higher, as well as a significantly superior Calmar ratio.
Next, let’s examine the strategy with the threshold still set at 50, this time not only using 4 tranches, but also expanding to 8 and 12 tranches.
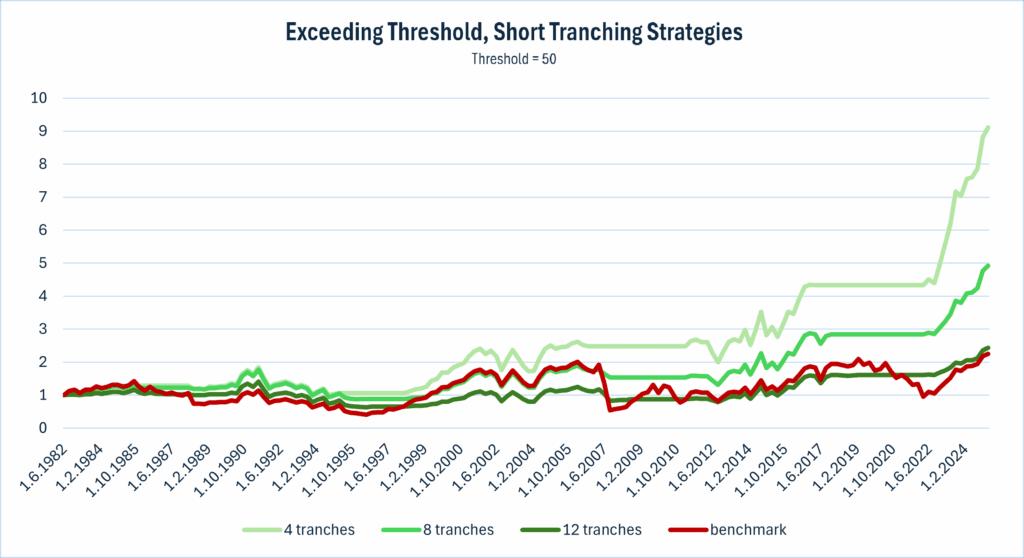
At first glance, increasing the number of tranches does not appear to be beneficial for the strategy. Both the graph and table indicate lower efficiency, however, the strategy still outperforms the benchmark when a suitable threshold is applied.
This suggests that the impact of a rising sunspot number is lagged, but as time progresses, its effect gradually weakens. While the shorting strategy appears applicable when a price decline is expected, it remains unclear whether it can be adapted effectively for rising markets (number of sunspots falling below the threshold) and long positions.
Long positions
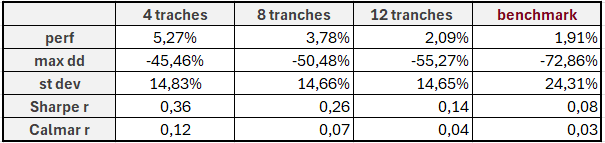
Now, let’s apply the same procedure focusing on the number of sunspots falling below the threshold set to 20, 30, 40, 50 and 60, but as a signal for long positioning .
Even though there were periods when strategies based on taking long positions after the threshold fell below a certain level outperformed the benchmark, their long-term performance remained negative and consistently less effective than the benchmark. Therefore, it still holds that the only applicable strategy using sunspots as an investment signal is the short tranching strategy that invest when the threshold is exceeded, particularly when it is set to 50.
However, backtest period of 40 years is not as long as we wish, but the wheat futures data we have doesn’t have longer history. For this reason we decided to utilise the spot prices of wheat.
Spot prices
We prefer using futures contracts in our analysis because they inherently reflect storage costs, which are already priced into the market. This makes them a more realistic instrument for studying commodity price behavior from a trading perspective. However, due to the limited availability of long-term historical futures data, we would also rely on spot prices in our analysis, since they offer a much longer data history suitable for studying long-term patterns.
The dataset of spot prices covers the period from 1842 to 2025 and is compiled from multiple sources. From 1841 to 1944 the data are based on the Wholesale Price of Wheat and for the period 1944 to 1952 is used Wholesale Price of Wheat again. From 1952 to 1990 is Producer Price Index by Wheat Commodity applied and finally, from 1990 to 2025 is used Global price of Wheat. The last two datasets were originally reported in different units and therefore had to be converted to cents per bushel for consistency.
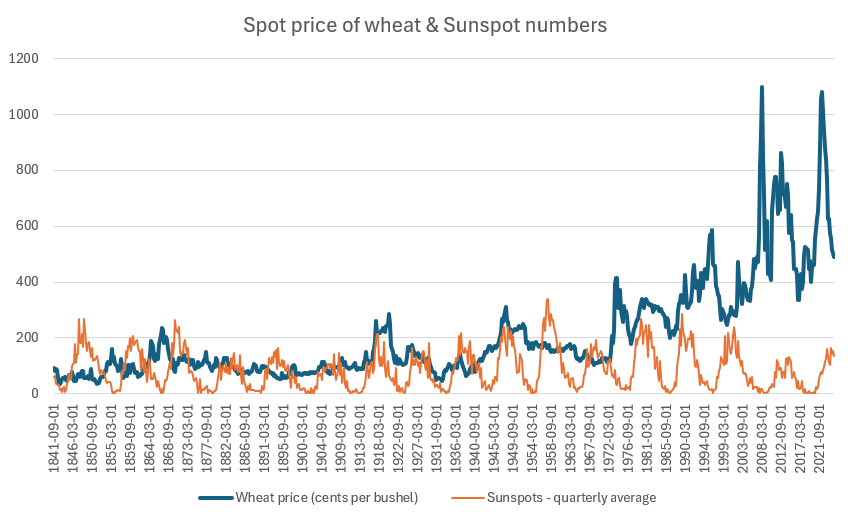
The spot price of wheat exhibits a generally upward trend particularly since the 1970s, accompanied by several significant drawdowns. This pattern may be attributed to the effect of inflation over time.
In contrast to futures, the benchmark is now constructed as a rolling long position rebalanced monthly, reflecting the generally upward movement in spot prices. However, as we mentioned earlier, this naive benchmark strategy does not incorporate storage costs, so we must take all the results from this longer analysis with a grain of salt.
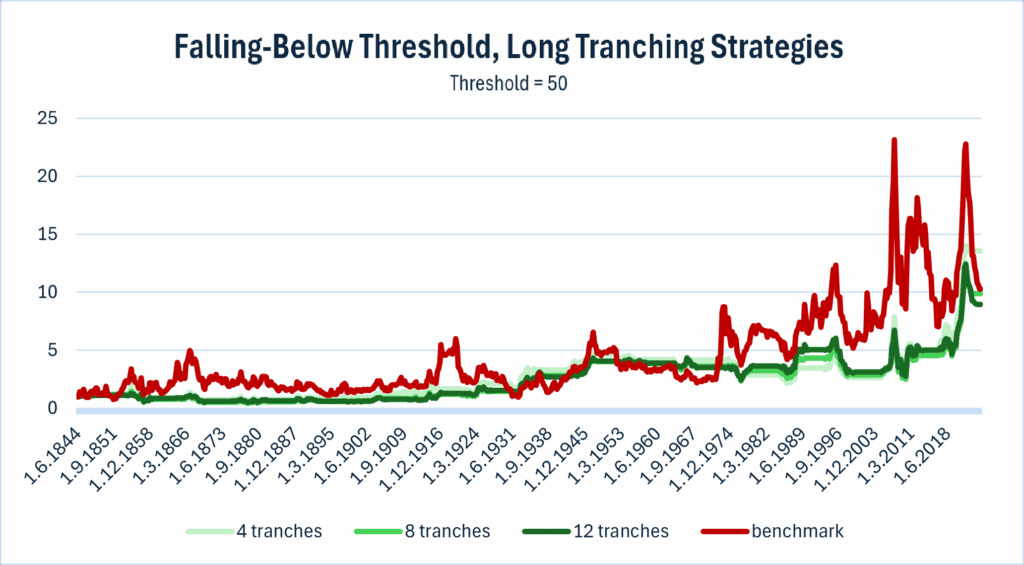
Let’s investigate whether the previously applied strategies will prove effective in this new context. Given the prevailing upward trend in prices, we begin by focusing on long positions initiated when the signal falls below the threshold. As a first step, we apply the 4-tranche procedure (quarterly rebalanced strategies, with 12-month holding period) using threshold levels set at 20, 30, 40, 50, and 60.
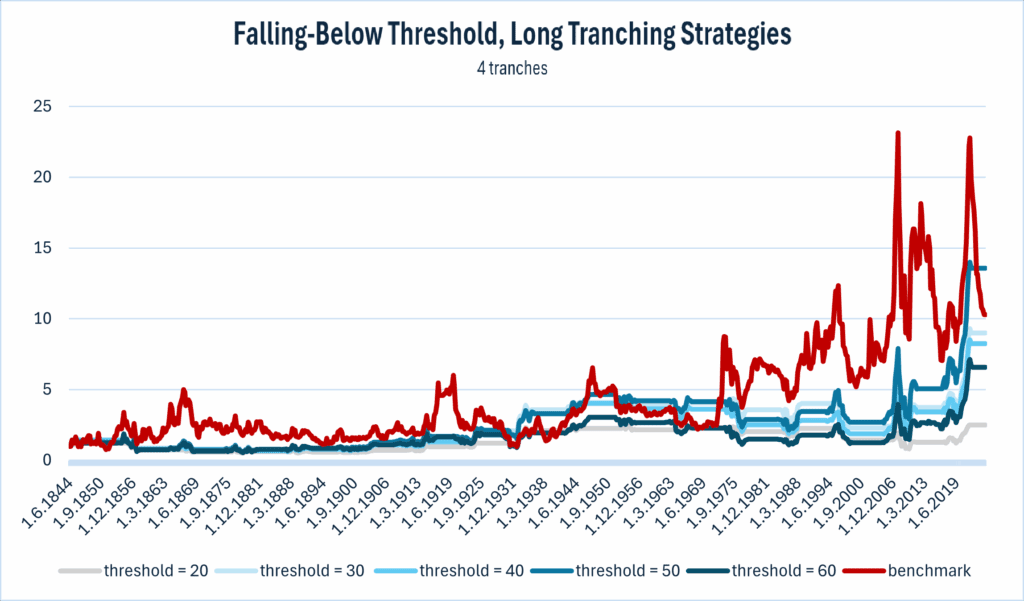
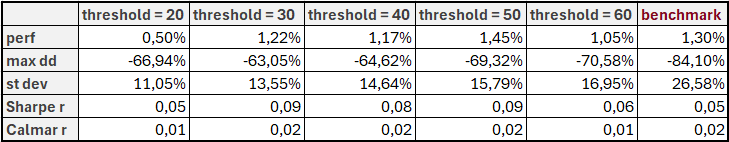
The application of our strategy provides a more stable outcome, evidenced by lower standard deviation and consequently a higher Sharpe ratio, even though the returns are not significantly higher than those of the benchmark. In this case, setting the threshold at 50 appears to be the most suitable, however, we acknowledge that this may be coincidental, given the negligible differences observed across other threshold settings.
Let us now examine the performance of strategies with longer holding periods (2-years, and 3-years), specifically with 8 and 12 tranches using the same threshold value of 50.
Changing the number of tranches didn’t result in any substantial differences, but it still led to a more stable approach, with a slightly higher Sharpe ratios compared to the benchmark. However, all Calmar ratios remained unchanged.
Finally, we were curious whether applying the most effective approach identified in the previous analysis the strategy could produce more favorable results. Therefore, we tried short tranching strategy, entering a short position when the number of sunspots exceeds a given threshold, anticipating a price decline, with 4 tranches and several threshold values: 30, 50, 80,100 and 150, expressed in logarithmic prices for better visualisation.
An application of the short tranching strategies after the threshold is exceeded and using 4 tranches didn’t prove beneficial in any case. Negative returns, and consequently negative Sharpe and Calmar ratios, underscore the inefficiency of this approach.
Conclusions
In conclusion, the use of wheat futures appears not only more profitable but also more rational, as it inherently accounts for storage costs (which cause the significant downwards price drift and we just need to correctly time entries and exists). If one aims to exploit a natural phenomenon such as sun activity, entering a short position when the number of sunspots exceeds a given threshold with 4 tranches proves to be effective, particularly when the threshold is set to 50, due to the generally declining behavior of futures prices, not only for wheat but potentially for other crops as well.
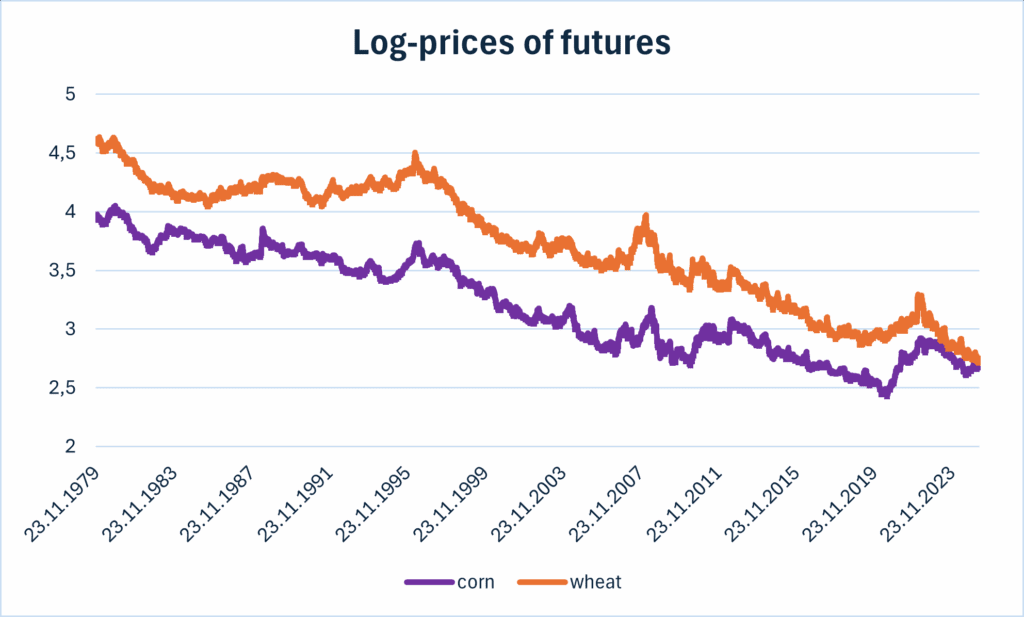
As shown in Figure 11, wheat and corn futures exhibit similar behavior over time. Therefore, the patterns and approaches applied to wheat futures are also applicable to corn futures.
In contrast, the primary advantage of using spot prices lies in the availability of a much longer historical dataset. However, this benefit comes at the cost of reduced strategy effectiveness. A long position initiated when the number of sunspots falls below a given threshold, particularly using the 4-tranche approach, can outperform the benchmark, albeit only marginally, while offering more stable performance. This effect is most notable when the threshold is set to 50. Nonetheless, these results should be interpreted with caution, as spot prices do not reflect storage costs. Consequently, while the strategy may appear profitable, incorporating storage costs could reverse the price dynamics, rendering long positions unprofitable. In such cases, short positioning, as implemented with futures, proves more appropriate.
Author: Sona Beluska, Junior Quant Analyst, Quantpedia
Are you looking for more strategies to read about? Sign up for our newsletter or visit our Blog or Screener.
Do you want to learn more about Quantpedia Premium service? Check how Quantpedia works, our mission and Premium pricing offer.
Do you want to learn more about Quantpedia Pro service? Check its description, watch videos, review reporting capabilities and visit our pricing offer.
Do you want algorithmic access to the full Quantpedia database via the API? Subscribe to Quantpedia Pro, ask for an API key, and explore the in/out-of-sample statistics, source academic papers, and code snippets — ideal for quantitative research, systematic trading workflows, and AI model training.
Are you looking for historical data or backtesting platforms? Check our list of Algo Trading Discounts.
Or follow us on:
Facebook Group, Facebook Page, Twitter, Linkedin, Medium or Youtube
Share onLinkedInTwitterFacebookRefer to a friend


