Do Airline Stocks Take Off Around U.S. Holidays?
Introduction
Holidays put people in motion. In the days surrounding major U.S. holidays, airports become busier as travelers visit their families or take advantage of extended weekends. Financial markets themselves are known to display a holiday-related seasonality. In our previous research on the Pre-Holiday Effect in Commodities, we identified a short-term price drift in crude oil and gasoline before major U.S. holidays. Increased travel and the associated expectation of higher fuel consumption offered one possible explanation. This naturally raises another question: if holiday travel leaves a seasonal footprint in energy markets, can it also be detected in the stocks of the airlines transporting those travelers? To investigate this possibility, we analyze the performance of the U.S. Global Jets ETF (JETS) around major U.S. holidays. We first examine its daily returns from ten trading days before to ten trading days after each holiday and use the resulting return profile to identify the strongest seasonal windows. We then formulate two directional JETS strategies and a JETS–USO strategy.
Background
Calendar anomalies are recurring patterns in asset returns associated with specific days, months, or events. Common examples include the day-of-the-week, turn-of-the-month, January, and pre-holiday effects. Quantpedia database contains more than 100 seasonality-based trading strategies across different markets and asset classes.
The pre-holiday effect is among the most extensively studied of these patterns. Using 90 years of daily Dow Jones Industrial Average data, Lakonishok and Smidt (1988) documented persistent anomalous returns around the turn of the week, month, and year, as well as around holidays. Focusing specifically on the pre-holiday period, Ariel (1990) found that, between 1963 and 1982, average returns on the trading day before holidays were nine to fourteen times higher than returns on other days. More recently, Vidal-García and Vidal (2025), using data from 1990 to 2024, found evidence of pre-holiday effects in Asian and North American markets and post-holiday effects in Europe and North America, while Albertson et al. (2026) also identified positive abnormal returns around specific U.S. federal holidays, particularly Martin Luther King Jr. Day, Presidents’ Day, and Thanksgiving.
Our previous research on the Pre-Holiday Effect in Commodities found a short-term price drift in crude oil and gasoline before major U.S. holidays. One possible explanation was that markets anticipated increased holiday travel and fuel consumption. This prompted us to ask: Do airline stocks also move systematically before and around major U.S. holidays?
Data and Methodology
Our main instrument is the U.S. Global Jets ETF (JETS), which tracks an index composed primarily of U.S. and international passenger airlines. We also use the United States Oil Fund (USO), a futures-based ETF providing exposure to crude oil prices. We use daily adjusted closing prices for the period from May 1, 2015, to May 29, 2026. Data is sourced via EODHD.com – the sponsor of our blog (and as a special offer, our blog readers can enjoy an exclusive 30% discount on premium EODHD plans).
The core calendar covers eight recurring U.S. market holidays: New Year’s Day, Martin Luther King Jr. Day, Presidents’ Day, Memorial Day, Independence Day, Labor Day, Thanksgiving, and Christmas Day. Juneteenth is added from 2022 onward, expanding the calendar to nine holidays. We denote the observed market-holiday date by D. Because the market is closed on D, D−1 refers to the final trading day before the holiday, while D+1 refers to the first trading day after it. All relative days are defined in trading days.
We begin by examining the average daily return of JETS and JETS – USO from D−10 to D+10. The following bar charts present the average return for each relative day, allowing us to identify periods in which positive or negative returns cluster around holidays.

Figure 1. Average Daily Return of JETS Around U.S. Holidays (D−10 to D+10)
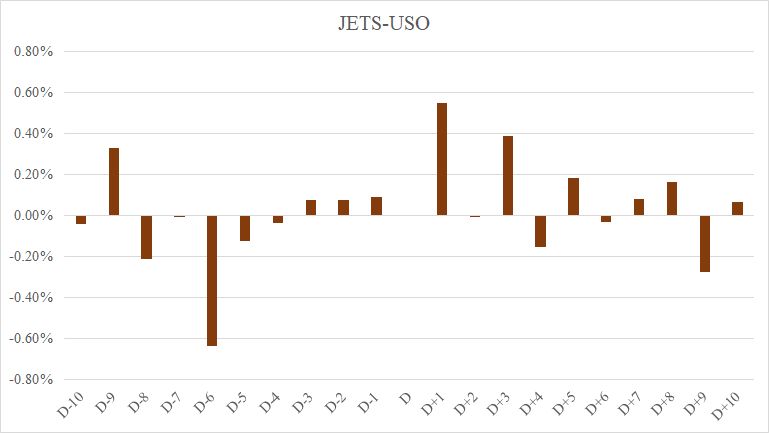
Figure 2. Average Daily Return of the JETS–USO Spread Around U.S. Holidays (D−10 to D+10)
Based on this return profile, we select the most promising holding periods and formulate three strategies with simple trading rules:
JETS D−4 to D−1
– Enter: Buy JETS at the close of D−5.
– Hold: Maintain the position from D−4 through D−1 without adjustment.
– Exit: Sell JETS at the close of D−1.
JETS D−4 to D+8
– Enter: Buy JETS at the close of D−5.
– Hold: Maintain the position from D−4 through D+8 without adjustment.
– Exit: Sell JETS at the close of D+8.
JETS–USO D−3 to D+3
– Enter: Buy JETS and take a short position in USO at the close of D−4.
– Hold: Maintain both positions from D−3 through D+3 without adjustment.
– Exit: Close both positions at the close of D+3.
The first two strategies focus on the standalone performance of JETS. The third is a long–short strategy designed to examine airline-stock performance relative to crude oil. Its daily return is calculated as the return on JETS minus the return on USO. Outside the specified trading windows, the strategies hold no position and uninvested capital earns a return of zero. Transaction costs are excluded. The longer JETS window can overlap around Christmas and New Year’s Day. When this occurs, the strategy maintains one continuous position rather than closing and reopening it or creating an additional position.
Results
The JETS D−4 to D−1 strategy, which holds JETS during the four trading days preceding each holiday, produced a compound annual return of 7.14% with annualized volatility of 9.40%. Its maximum drawdown was limited to −14.61%, resulting in a Sharpe ratio of 0.76 and a Calmar ratio of 0.49. The equity curve increased relatively steadily, making this the least volatile strategy and the one with the smallest drawdown. The backtest shows a relatively stable positive return pattern in JETS during the days immediately preceding U.S. holidays.
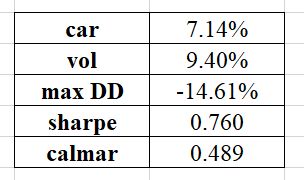
Table 1. Performance Statistics for the JETS D−4 to D−1 Strategy
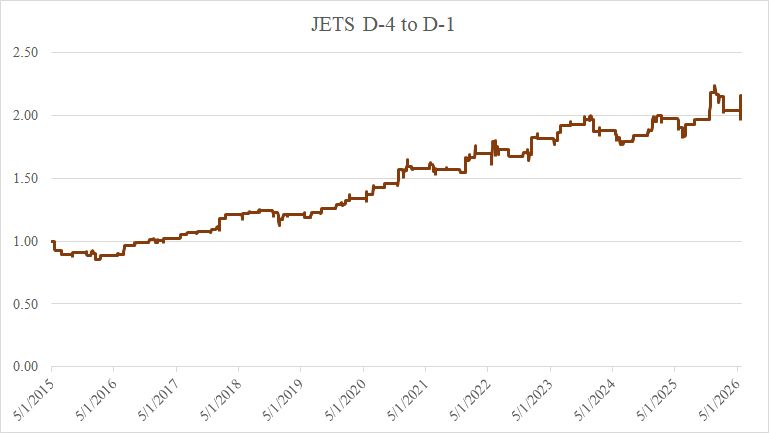
Figure 3. Equity Curve of the JETS D−4 to D-1 Strategy
The JETS D−4 to D+8 strategy extends the holding period beyond the holiday and achieved the strongest overall performance. It generated a compound annual return of 16.00% and the highest Sharpe ratio, at 0.93. However, the longer market exposure also increased annualized volatility to 17.21% and the maximum drawdown to −32.81%. Its Calmar ratio of 0.49 was nearly identical to that of the shorter strategy. Extending the holding period substantially increased returns, but the improvement came with considerably greater downside risk.

Table 2. Performance Statistics for the JETS D−4 to D+8 Strategy
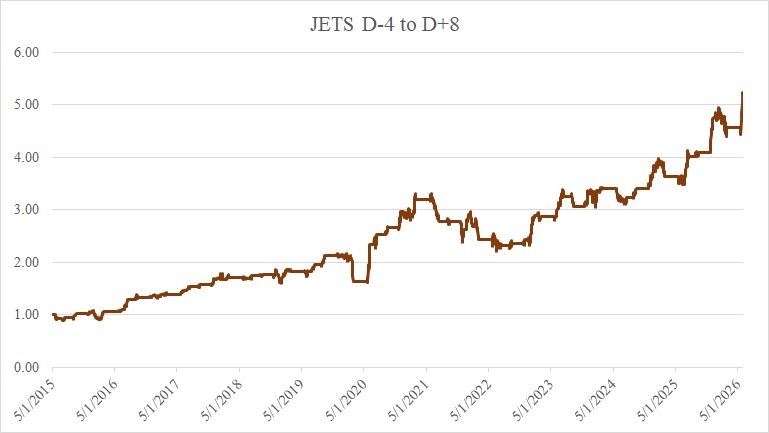
Figure 4. Equity Curve of the JETS D−4 to D+8 Strategy
The longer strategy produced the strongest overall performance, but it also experienced larger declines. Part of its higher return reflects the fact that it remains invested for twelve trading days around each holiday, compared with only four days for the shorter strategy. The D−4 to D−1 strategy therefore provides a more focused and stable exposure to the pre-holiday period, while the D−4 to D+8 strategy captures additional returns after the holiday but involves greater risk.
We next examine whether airline stocks also performed well relative to crude oil. The JETS–USO D−3 to D+3 strategy, which combines a long position in JETS with an equally sized short position in USO, generated a compound annual return of 8.37%. Its annualized volatility reached 17.71%, while its maximum drawdown was −31.36%. The corresponding Sharpe and Calmar ratios were 0.47 and 0.27, respectively. This indicates that JETS tended to outperform USO during the selected holiday windows, so the observed pattern was not simply shared by airline equities and crude oil. Nevertheless, the spread strategy was more volatile and achieved weaker risk-adjusted performance than the standalone JETS strategies.
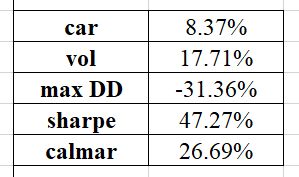
Table 3. Performance Statistics for the JETS–USO D−3 to D+3 Strategy
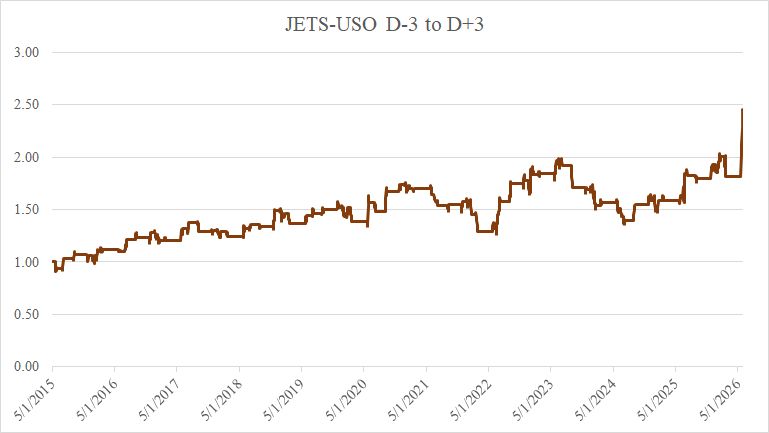
Figure 5. Equity Curve of the JETS-USO D−1 to D+3 Strategy
As an additional specification, we extended the JETS–USO holding period from D+3 to D+5. This produced only a modest increase in return while raising volatility and considerably worsening the maximum drawdown. Both its Sharpe and Calmar ratios declined. The two additional trading days therefore added more risk than return, supporting the selection of D−3 to D+3 as the preferred JETS–USO window.
Conclusion
This analysis asked whether increased travel around major U.S. holidays is reflected in airline-stock returns. Using daily data from May 2015 to May 2026, we first analyzed the average returns of JETS from ten trading days before to ten trading days after each holiday. Based on the observed return profile, we constructed two directional JETS strategies covering the D−4 to D−1 and D−4 to D+8 windows. We also combined a long position in JETS with an equally sized short position in USO from D−3 to D+3 to determine whether airline equities performed well relative to crude oil.
Overall, the results reveal a positive holiday-related pattern in airline equities during the sample period. The longer JETS strategy delivered the highest return and Sharpe ratio, whereas the shorter pre-holiday strategy provided a smoother return profile and substantially lower drawdowns. The positive JETS–USO results further show that JETS outperformed crude oil around the analyzed holidays, although shorting USO did not improve performance on a risk-adjusted basis.
Author: Margaréta Pauchlyová, Junior Quant Analyst, Quantpedia
Are you looking for more strategies to read about? Sign up for our newsletter or visit our Blog or Screener.
Do you want to learn more about Quantpedia Premium service? Check how Quantpedia works, our mission and Premium pricing offer.
Do you want to learn more about Quantpedia Pro service? Check its description, watch videos, review reporting capabilities and visit our pricing offer.
Do you want algorithmic access to the full Quantpedia database via the API? Subscribe to Quantpedia Pro, ask for an API key, and explore the in/out-of-sample statistics, source academic papers, and code snippets — ideal for quantitative research, systematic trading workflows, and AI model training.
Are you looking for historical data or backtesting platforms? Check our list of Algo Trading Discounts.
Or follow us on:
Facebook Group, Facebook Page, Telegram, Twitter, Linkedin, Medium or Youtube
References
Albertson, N. L., Tierney, H. L., Cline, J. W., & Boylan, D. (2026). Abnormal returns and stock performance prior and after federal holidays. Review of Financial Economics, 44(1), e70018.
Ariel, R. A. (1990). High stock returns before holidays: Existence and evidence on possible causes. The Journal of Finance, 45(5), 1611-1626.
Lakonishok, J., & Smidt, S. (1988). Are seasonal anomalies real? A ninety-year perspective. The review of financial studies, 1(4), 403-425.
Vidal-García, Javier and Vidal, Marta, The Holiday Effect (September 10, 2025). Available at SSRN: https://ssrn.com/abstract=5073776
Vojtko, Radovan and Dujava, Cyril, Pre-Holiday Effect in Commodities (October 14, 2024). Available at SSRN: https://ssrn.com/abstract=4990978 or http://dx.doi.org/10.2139/ssrn.4990978
Share onLinkedInTwitterFacebookRefer to a friend