Embedded Leverage in High Beta Funds and Management Fees
Risk-averse investors want higher returns at any cost. If they are constrained and are not able to use leverage on their own, they will look for other ways to increase their performance. Recent academic paper written by Hitzemann, Sokolinski, Tai suggests, that such risk-seeking investor will search for a high-beta fund that will give them requested embedded leverage, even when that fund charge higher than average fees. Resultant net alpha of those high-beta funds is then negative, and this effect can explain the significant part of the underperformance of the overall mutual fund industry. And now, the logical question follows: As hedge funds have even higher fees than mutual funds, what is embedded in them, that constrained clients normally can’t access? Higher leverage and access to option-like return distribution? Maybe…
Authors: Hitzemann, Sokolinski, Tai
Title: Paying for Beta: Embedded Leverage and Asset Management Fees
Link: https://papers.ssrn.com/sol3/papers.cfm?abstract_id=3470288
Abstract:
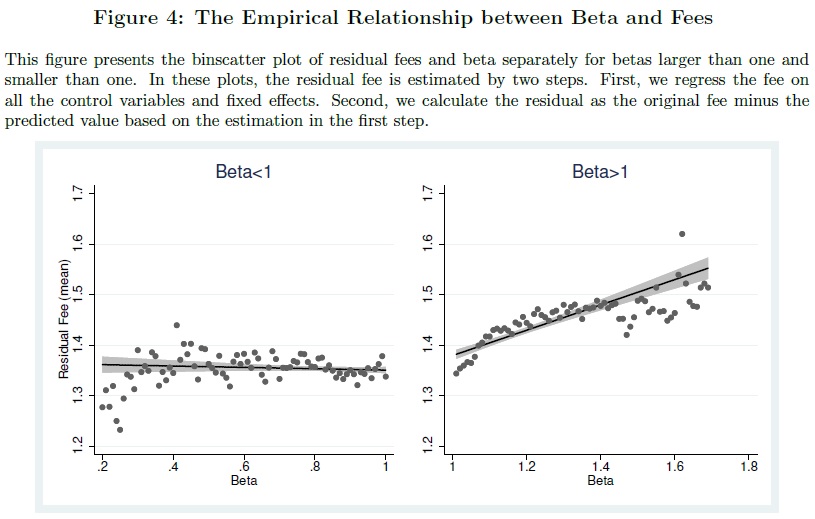
This article studies the effects of leverage constraints on asset management fees. We present a new model in which constrained investors delegate capital to asset managers. In the equilibrium, risk-seeking investors choose high beta managers who charge high fees for providing embedded leverage. Our empirical results in the sample of the U.S. equity mutual funds are consistent with the model’s three novel predictions: 1) fees increase in market beta, but only when beta is larger than one, 2) this relation is stronger when leverage constraints tighten, and 3) fund net alpha declines in beta faster than its gross alpha. Our study suggests that willingness to pay for embedded leverage helps explain net-of-fees underperformance of actively managed funds.
Notable quotations from the academic research paper:
“Many investors delegate portfolio construction to professional money managers and pay fees for asset management service. Individual
investor holdings of U.S. common equity declined from 47.9% in 1980 to only 21.5% in 2007 while open-end mutual fund holdings increased from 4.6% to 32.4% over the same period. At the same time, investors sacrificed about 10% of their annual real return for asset management fees and transaction costs.
In this article we present and test a novel explanation for this puzzle: asset managers can charge fees for the provision of leverage to investors who face borrowing constraints, even if asset managers lack the ability to beat the market.
To understand how borrowing constraints might a ffect asset management fees, consider the following example. Imagine two investors who do not assemble portfolios on their own but can easily obtain leverage. The risk-seeking investor seeks to obtain a portfolio with the market beta of 1.5 and the risk-averse investor wants to achieve a beta of 0.5. According to the capital asset pricing model, the first investor borrows 50% of her wealth and invests 150% of it in the market index fund while the second investor equally splits her holdings between the market index fund and the risk-free asset. But if the risk-seeking investor cannot borrow, she has to find an asset manager who can assemble a portfolio with beta of 1.5 on her behalf. Such a manager can charge a markup for providing beta greater than one even at the absence of any ability to beat the market. Importantly, the risk-averse investor does not face borrowing constraints as she still can achieve her desired beta of 0.5 solely relying on the market index fund. As a result, low-beta asset managers cannot charge markups similar to high-beta managers.
Since we suggest that investors pay fees not only for performance but also for embedded leverage, we expect funds to under-perform more due
to high fees when leverage provision becomes especially valuable. In particular, the model predicts that net alpha declines with fund beta faster than gross alpha, when beta is larger than one. This result helps explain why certain funds charge fees substantially higher than their gross alphas, contributing to under-performance of the average actively managed fund.
Using portfolio sorting, we first document that the increase in market beta is associated with lower gross alphas. The diff erence in gross alphas between low and high beta fund portfolios equals to 37 basis points, however this di fference is not statistically signi ficant at the 10% level. This result is consistent with the analysis of individual stocks in Frazzini and Pedersen (2014) who show that high-beta stocks have lower alphas.
At the same time, our model and previous empirical results imply that net alphas should decline even further. Since we have shown that fund fees increase in beta for betas above one, we expect net alphas to decline with beta even faster relative to gross alphas. Consistently with this prediction, the di fference in net alphas between low and high beta fund portfolios amounts to 60 basis points and it is statistically signi ficant at the 5% level. 40% of this di fference (23 basis points) is purely driven by the diff erence in fees between the funds. At the same time, we show that high beta funds generate higher net returns relatively to low beta beta funds. The combined evidence implies that investors pay high fees to obtain access to high returns of high beta funds while facing lower net alphas.”
Are you looking for strategies applicable in bear markets? Check Quantpedia’s Bear Market Strategies
Are you looking for more strategies to read about? Sign up for our newsletter or visit our Blog or Screener.
Do you want to learn more about Quantpedia Premium service? Check how Quantpedia works, our mission and Premium pricing offer.
Do you want to learn more about Quantpedia Pro service? Check its description, watch videos, review reporting capabilities and visit our pricing offer.
Do you want algorithmic access to the full Quantpedia database via the API? Subscribe to Quantpedia Pro, ask for an API key, and explore the in/out-of-sample statistics, source academic papers, and code snippets — ideal for quantitative research, systematic trading workflows, and AI model training.
Are you looking for historical data or backtesting platforms? Check our list of Algo Trading Discounts.
Or follow us on:
Facebook Group, Facebook Page, Telegram, Twitter, Linkedin, Medium or Youtube
Share onLinkedInTwitterFacebookRefer to a friend


