ESG Scores and Price Momentum Are More Than Compatible
Introduction
Momentum in stocks is not only a key strategy in the many portfolios of practitioners, but it is also an attractive research topic for academics. The original idea behind momentum, is that past winner tend to perform well in the near future, and vice versa, past loser tend to underperform (Jegadeesh and Titman, 2001). Later, the momentum anomaly was found practically everywhere, Moskowitz, Ooi, and Pedersen (2012) identified momentum in an equity index, currency, commodity, and bond futures. Hartley (2020) identified momentum anomaly in global yield curves. Moreover, the momentum factor is also presented in the equity factors, as concluded by Arnott, Clements, Kalesnik and Linnainmaa (2019).
While momentum anomaly is a staple in the financial literature, the theory behind socially responsible investing or ESG investing, and mainly ESG scores is emerging. E score stands for environmental, S for social and G for governance qualities of firms. Aim of the score is to measure quality or responsibility of the firm in each of the categories mentioned above. We have also reviewed literature related to the ESG investing, and have concluded that ESG scores could be successfully used in practice, utilized in negative screening, level, or momentum strategies. It is no surprise that researchers looked for momentum in ESG scores.
What will happen if we mix ESG scoring with price momentum? Can we improve simple ESG investing strategy?
Quantpedia’s newest research paper written by Matus Padysak answers these questions. Let’s start our analysis with the following analogy – the relationship between price equity momentum and ESG scores can be compared to a robber in a jewellery store with a knapsack of limited capacity. The ESG scores and momentum anomaly can be related to the famous optimization Knapsack problem. One of the most straightforward explanations of the Knapsack problem is a robber that has limited capacity in the backpack, and naturally, wants to return from the store with a maximal loot. Therefore, the weight of the loot is limited, and robber wants to maximize his profit by choosing the most valuable combination of items that would fit into his knapsack.
The Knapsack problem applied to the equity momentum and ESG scores can form two different scenarios.
Firstly, it is possible to make classical momentum more „sustainable“ or ESG friendly. In this case, the aim is to pick stocks with the highest momentum, but at the same time, maximize the ESG score of the portfolio. In other words, the momentum represents the weight, the higher the momentum, lower the weight. The limited capacity of the knapsack ensures that only stocks with high momentum (low weight) would be included in a portfolio. The ESG score of each stock represents the value. Therefore, picking stocks with the lowest „weight“ and maximizing the „value“ creates a more ESG friendly momentum strategy.
Secondly, the situation can be reversed, and ESG can represent the „weight“ of the stock – higher the ESG, lower the weight. In this case, momentum represents the „value“ of the stock. In practice, such an approach chooses portfolio with as highest ESG as possible while maximizing the momentum of the stocks.
The first approach can be used to make the portfolio more attractive in terms of the ESG scores. The average ESG score of stocks in a portfolio can be significantly improved, with only a slight reduction in the performance. The second approach leads to a portfolio that can be without a doubt called as socially responsible according to the ESG scores. Additionally, this approach largely improves the returns of ESG strategies compared to, for example, the ESG level or momentum strategies as shown by Dorfleitner, Utz, and Wimmer (2013) and Nagy, Kassam and Lee (2016). Moreover, compared to the traditional momentum in stocks, both the volatility and maximal drawdowns are substantially improved, leading to a better risk-adjusted return compared to the momentum alone.
Data
The OWL Analytics kindly provided unfiltered ESG data. Each month, the data consisted from 5000 stocks at the beginning up to almost 30 000 companies at the end. For each company, data includes ISIN, shareClassFIGI, region, and over 200 detailed parameters for the E, S, and G score and the total ESG score. In this paper, a scaled total ESG score, that is between zero and one, is in the scope of interest. Stocks were filtered to be from the US region. Later, through their ISIN, were paired with their ticker and price for each month. Small firms and firms without the ticker or price were omitted. The dataset contains 691 stocks and spans from 31.3.2010 to 31.10.2019. Factor portfolios were obtained from Kenneth R. French`s data library.
Knapsack problem
Consider two paired vectors of features of objects. The weight of objects and the value (or prices) of objects. Then the knapsack problem consists of finding the combination of objects that maximize the value, given the condition of the maximal weight. The problem can be denoted as follows:

The complexity of the Knapsack problem raises with the rising number of objects. For the lower number of objects, the direct search might be comfortably fast. However, for the task of portfolio construction, direct search method is impossible. For example, there are 120 (5!) possibilities if we have five objects. If we have ten objects, there are 3,628,800 (10!) possibilities. Clearly, searching directly between (500!) (or even more, if objects are stocks) is impossible.
Complex problems can be usually solved by using methods of stochastic optimization that are deeply connected with probability. For the Knapsack problem, for example, the simple greedy algorithms such as hill climbing can be used. However, a large number of objects favours more complex algorithms such as Simulated annealing, Differential evolution or Particle swarm optimization.
In this paper, we utilize a modified approach of Simulated annealing that does not rely only on the annealing and the convergence to the optima but remembers the best solution. Therefore, it is possible to utilize the ability of annealing to jump from local optimum, and yet similar to other algorithms, remember the best solution so far.
A complete description of the optimization process is in the full version of the paper.
Portfolio sorts
In this section, various portfolio sorts are considered. Firstly, portfolios that pick stocks with the highest momentum while maximizing ESG score of the portfolios. Secondly, a reversed situation, portfolios that picks stocks with the highest ESG score while maximizing momentum of the stocks. These sorts are made by transforming the stock-picking to the Knapsack problem. In the first case, the weight is represented by the momentum (higher the momentum, lower the weight). Therefore the maximal weight ensures that the portfolio would be formed of stocks with high momentum. Given the maximal „weight“, we want to maximize total value, which is represented by the ESG scores. Approach, as mentioned earlier results in a MOM-ESG portfolio.
In the second case, weight and value are reversed, and the aim is to construct a portfolio with the highest ESG scores and maximizing the momentum at the same time. Such an approach leads to an ESG-MOM portfolio. Because of the Knapsack formulation as in (1), in this application, ESG scores are reversed, to ensure that weight cap is correct for picking high ESG stocks. Both strategies have the weight set in a way that the resulting portfolio would on average represent either top momentum quintile or top ESG quintile. The algorithm may and probably would not choose the exact number of stocks that represent 10% of the investment universe. Aim of the algorithm is to find the best combination, that can be formed of a lower number of stocks. Since the task is to examine whether momentum portfolios can be more socially responsible, portfolios are long-only. Additionally, since the Knapsack algorithm and the Simulated annealing brings randomness into portfolio creation, we consider ten portfolio sorts for both MOM-ESG and ESG-MOM and present an average portfolio. Given the higher computational time and low dispersion among portfolios, we assume that ten different portfolios are sufficient.
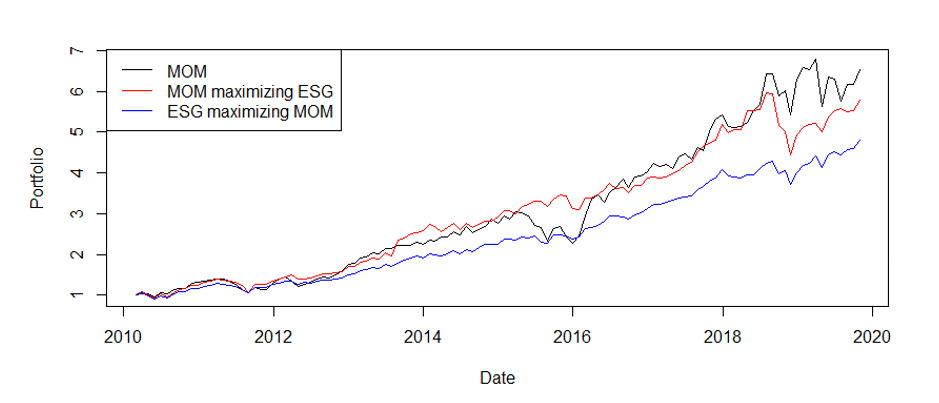
For comparison, we consider traditional cross-sectional equally-weighted momentum portfolios (MOM) formed of stocks of equal quintiles used to construct knapsack portfolios. To directly compare the performance to the ESG portfolios, the momentum is a long-only.
| Top 10% of stocks | Return | Volatility | Maximal drawdown | Risk adjusted return | ESG | N |
| MOM | 21.25% | 21.78% | -25% | 0.97 | 0.39 | 68 |
| MOM-ESG | 19.71% | 18.48% | -25% | 1.07 | 0.52 | 45 |
| ESG-MOM | 17,47% | 13.49% | -18% | 1.29 | 0.90 | 52 |
Portfolio sorts: annualized returns and volatilities. Risk-adjusted return is return divided by the volatility. N is the average number of stocks in the portfolio. Best values are in bold.
Comparision of portfolios consisting of “Top 10%” stocks
Furthermore, coefficients (tables) of asset pricing models: CAPM, Fama and French three-factor model and Fama and French five-factor model are presented in the full version of the paper. Overall, strategies have both economically, and statistically, significant alphas and common market factors cannot explain the performance. Strategies are unrelated to common equity risk factors and coefficients are small and insignificant.
Risk, Volatility and Drawdowns and ESG
Across the financial literature, there is a consent that high ESG stocks bear a lower „risk“. According to Ashwin Kumar et al. (2016), the integration of Environmental, Social and Fair Governance practices makes a company less vulnerable to reputation, political and regulatory risk and thus leading to lower volatility of cash flows and profitability. Authors have also found that across every industry, the annualized volatility is lower for the high ESG stocks. Socially responsible behaviour makes firms less vulnerable to expensive government-imposed fines (Freedman and Stagliano, 1991). In many cases, this effect can be directly observed and utilized, as shown by Taehyun and Yongjun (2020). Corporate Environmental Responsibility actions significantly affect firm value and proxied by reduction of toxic chemical emissions can be directly used for a portfolio sorting, where firms that have reduced the emissions the most outperform those that have reduced the emissions least. Additionally, as shown by Godfrey (2005), socially responsible behaviour aids firms to minimize exposure to risk. Results of Dorfleitner, Utz, and Wimmer (2013) show that a high corporate social performance today can save money and yield high (unexpected by the market) cash flows in future periods. Therefore, lower volatility and drawdowns of ESG-MOM and MOM-ESG portfolios are largely in line with a majority of literature. As a result, the MOM-ESG and mainly, the ESG-MOM portfolios should be accompanied by lower volatility and drawdowns. This can be directly observed by looking at Figures 1 and 2. A similar effect was found by Varma and Nofsinger (2012), responsible mutual funds outperform other mutual funds during bear markets. However, according to paper, the dampening of downside risk has its price. Responsible funds tend to underperform during non-crisis periods. Paper argues that the outperformance in crisis periods is driven by the focus on shareholder advocacy and environmental, social, and governance issues. However, the combined knapsack portfolios naturally do not have such problems with underperformance. After all, there are two criteria, one momentum-based and one representing social responsibility.
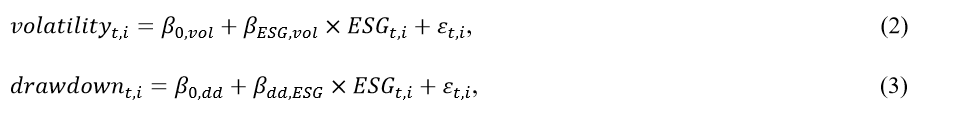
For data in this study, linear models can be used to examine the relationship between ESG scores and volatility and maximal drawdown. Natural expectation would be that higher the ESG, lower the volatility. For the maximal drawdowns, higher ESG should lead to more „positive“ drawdowns.
The models can be formed as:
| Panel A: Volatility | ||
| Year | ||
| 2010-2012 | 10.28*** | -3.12*** |
| 2012-2014 | 8.46*** | -1.73*** |
| 2014-2016 | 6.33*** | -0.50*** |
| 2016-2018 | 7.48*** | -1.14*** |
| 2018-2020 | 8.03*** | -1.52*** |
| Panel B: Drawdown | ||
| Year | ||
| 2010-2012 | -14.22*** | 4.42*** |
| 2012-2014 | -15.74*** | 3.84*** |
| 2014-2016 | -11.71*** | 1.87*** |
| 2016-2018 | -12.81*** | 2.77*** |
| 2018-2020 | -15.36*** | 2.08*** |
Regression for volatility and drawdowns. 𝐸𝑆𝐺𝑡,𝑖 is the average ESG score of the stock i for two years, 𝑣𝑜𝑙𝑎𝑡𝑖𝑙𝑖𝑡𝑦𝑡,𝑖 is two-year volatility and 𝑑𝑟𝑎𝑤𝑑𝑜𝑤𝑛𝑡,𝑖 is a maximal drawdown of each stock i during two years. 𝜀𝑡,𝑖 are random errors. Therefore, for both measures of risk, we obtain rolling regressions.
In conclusion, results are in line with the previous literature, and high ESG stocks bear a lower risk, either represented by the drawdowns or volatility.
Additionally, in recent times, the focus of the researchers was aimed at momentum crashes or periods where the momentum performed with large drawdowns and periods of persistent negative returns. The literature recognizes momentum crashes, and there are a few possible solutions. According to Fan et al. (2020), stocks with high returns are often highly volatile over the formation period, and as a result, the probability of stock to be included in the portfolio is related to it´s realized volatility. High volatility assets result in momentum portfolios with high volatility or in other words, portfolios with momentum-specific risks. Aforementioned would mean that momentum risks are a result of signal construction and ranking process. A possible solution is to scale returns by some moment of the standard deviations, to obtain risk-adjusted momentum signal. As a result, the strategy would prefer lower volatility stocks, that are more favourable to be utilized in a momentum strategy. Inclusion of ESG into MOM portfolios is indirectly doing the same, as mentioned before, ESG lowers volatility, which enhances the MOM strategy. Moreover, such addition leads to an attractive and modern, socially responsible portfolios.
Conclusion
No doubt, ESG is becoming a part of the financial world. While many pure ESG strategies may seem to bring low profits, the profits can be significantly enhanced when ESG is only a part of the portfolio. As shown in this paper, momentum can be an ideal combination to be used with ESG scoring system. Momentum strategies that are both popular and profitable are vulnerable to momentum crashes. ESG stocks tend to be less volatile, a characteristic that is vital in momentum portfolios.
As a result, considering the combination of ESG/MOM as a Knapsack problem, can significantly improve ESG score of the MOM portfolio, and make the investment more socially responsible without sacrificing returns. Moreover, volatility is reduced. Therefore, such combination can be an interesting modification of pure momentum strategy, to make it more modern, attractive, responsible and less volatile.
In a reversed situation, where the objective is to improve the MOM of ESG portfolio, the algorithm chooses high ESG stocks that are less volatile and at the same time, have a large momentum. On a risk-adjusted basis, ESG-MOM portfolios outperform both MOM and MOM-ESG portfolios. The strategy based on the Knapsack algorithm leads to more consistent returns, lower volatility and drawdowns. Overall, the results are in line with literature about ESG and the connection of momentum and volatility. Results are also supported by rolling regressions that estimate the relationship between ESG scores and volatility or maximal drawdown.
Author:
Matus Padysak, Senior Quant Analyst, Quantpedia
Related literature
Arnott, Robert D. and Clements, Mark and Kalesnik, Vitali and Linnainmaa, Juhani T., Factor Momentum (February 1, 2019). Available at SSRN: https://ssrn.com/abstract=3116974 or http://dx.doi.org/10.2139/ssrn.3116974
N. C. Ashwin Kumar, Camille Smith, Leïla Badis, Nan Wang, Paz Ambrosy & Rodrigo Tavares (2016): ESG factors and risk-adjusted performance: a new quantitative model, Journal of Sustainable Finance & Investment, DOI: 10.1080/20430795.2016.1234909
Bélisle, C. J. P. 1992. Convergence Theorems for a Class of Simulated Annealing Algorithms on Rd. Journal of Applied Probability, vol. 29(4), p. 885-895.
Dorfleitner, Gregor and Utz, Sebastian and Wimmer, Maximilian, Where and When Does It Pay to Be Good? A Global Long-Term Analysis of ESG Investing (October 7, 2013). 26th Australasian Finance and Banking Conference 2013. Available at SSRN: https://ssrn.com/abstract=2311281 or http://dx.doi.org/10.2139/ssrn.2311281
Fan, Minyou and Kearney, Fearghal Joseph and Li, Youwei and Liu, Jiadong, Momentum and the Cross-Section of Stock Volatility (February 20, 2020). QMS Research Paper 2020/01 . Available at SSRN: https://ssrn.com/abstract=3541766 or http://dx.doi.org/10.2139/ssrn.3541766
Freedman, M. and A. J. Stagliano (1991). Differences in social-cost disclosures: A market test of investor relations. Accounting, Auditing and Accountability Journal 4 (1), 68–83.
Godfrey, P. C. (2005). The relationship between corporate philanthropy and shareholder wealth: A risk managment perspective. Academy of Management Review 30 (4), 777–798.
Hartley, Jonathan, Interest Rate Momentum Everywhere Across Global Yield Curves (February 22, 2020). Available at SSRN: https://ssrn.com/abstract=3542813 or http://dx.doi.org/10.2139/ssrn.3542813
Jegadeesh, Narasimhan and Titman, Sheridan, Momentum (October 23, 2001). University Of Illinois Working Paper, Available at SSRN: https://ssrn.com/abstract=299107 or http://dx.doi.org/10.2139/ssrn.299107
Kim, Taehyun and Kim, Yongjun, Capitalizing on Sustainability: The Value of Going Green (February 2, 2020). Available at SSRN: https://ssrn.com/abstract=3310643 or http://dx.doi.org/10.2139/ssrn.3310643
Moskowitz, T. J., Ooi, Y. H. and Pedersen, L. H. (2012). Time series momentum. Journal of Financial Economics 104 (2012), 228-250.
Varma, Abhishek and Nofsinger, John R., Socially Responsible Funds and Market Crises (September 6, 2012). Journal of Banking and Finance, Forthcoming. Available at SSRN: https://ssrn.com/abstract=2142343 or http://dx.doi.org/10.2139/ssrn.2142343
Vojtko, Radovan and Padysak, Matus, Quant’s Look on ESG Investing Strategies (December 16, 2019). Available at SSRN: https://ssrn.com/abstract=3504767 or http://dx.doi.org/10.2139/ssrn.3504767
Zoltán Nagy, Altaf Kassam, Linda-Eling Lee: Can ESG Add Alpha? An Analysis of ESG Tilt and Momentum Strategies. The Journal of Investing May 2016, 25 (2) 113-124; DOI: 10.3905/joi.2016.25.2.113
Are you looking for strategies applicable in bear markets? Check Quantpedia’s Bear Market Strategies
Are you looking for more strategies to read about? Sign up for our newsletter or visit our Blog or Screener.
Do you want to learn more about Quantpedia Premium service? Check how Quantpedia works, our mission and Premium pricing offer.
Do you want to learn more about Quantpedia Pro service? Check its description, watch videos, review reporting capabilities and visit our pricing offer.
Do you want algorithmic access to the full Quantpedia database via the API? Subscribe to Quantpedia Pro, ask for an API key, and explore the in/out-of-sample statistics, source academic papers, and code snippets — ideal for quantitative research, systematic trading workflows, and AI model training.
Are you looking for historical data or backtesting platforms? Check our list of Algo Trading Discounts.
Or follow us on:
Facebook Group, Facebook Page, Telegram, Twitter, Linkedin, Medium or Youtube
Share onLinkedInTwitterFacebookRefer to a friend


