Evaluating Long-Term Performance of Equities, Bonds, and Commodities Relative to Strength of the US Dollar
Introduction
The US dollar is the world’s primary reserve currency, is the most widely traded currency in the world (making up over 85% of all foreign exchange transactions), and is used as the benchmark currency for pricing many commodities such as oil and gold. We can say that the US dollar is the blood of the current financial system. A few months ago, we shared how to build a really long-term (nearly 100 years long) history of the USD exchange rate. Therefore, as we already have the data, we can now perform the cross-asset analysis to study the impact of the US Dollar’s strength or weakness on the performance of other asset classes, notably US equities, US treasury bonds, and commodities.
Data
We collected data from different sources and formed a set of daily values of returns from US bonds with a 10-year maturity, the performance of US equities (which are publicly available, for example, Fama & French offer free stock data with a long history), the selected basket of commodities, and finally US Dollar relative to other world currencies from the period of 1926 to 2022 (almost 100 years data). Data were then sampled for a monthly period.
Following is the figure of visualization of the performance of the mentioned asset classes during the period:
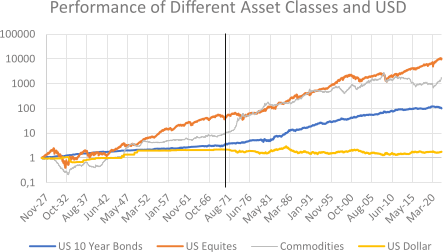
Figure 1. Absolute Performance of Equities, Bonds, and Commodities
We can easily conclude that over time, US Dollar lost its buying power over other asset classes significantly, and putting it onto any choice was certainly a better decision.
An important date division by a solid black line you can see from the chart is 15 August 1971 when the Bretton Woods system was ended. This marks the termination of the convertibility of the US dollar to gold and brings several implications and consequences we will discuss further on.
Methodology
We test not just the impact of the US dollar on the US equities, US treasuries, and commodities, but also include a spread portfolios consisting of going long equities and short commodities simultaneously and going long commodities and short treasuries simultaneously and evaluate them on the basis of US Dollar strength.
For evaluation purposes, we calculate the long (12-months) and short-term (3-months) moving averages (MAs) of the US Dollar and, each month, check if the current monthly value is higher or lower than the corresponding MA. Afterward, we check what’s the performance of the strategy that would buy (or sell) another asset (US equities, US treasuries, commodities, or spread portfolio) based on the price-vs-MA signal from the US Dollar.
Depending on the results, we will try to conduct remarks from the data alone if we find supporting evidence. We try to validate given hypotheses and see if conclusions can be drawn from them.
We went through the academic research and tried to find some papers that would link the US Dollar behavior to the returns of different assets. Here is what we have found:
- School of Stocks by Fyers (2023) claims that ‘during times the global economy is strengthening, international investors reduce their holdings in US treasuries, causing US yields to rise and the dollar to decline’, ‘[o]n the other hand, if movements [ ] are being driven by interest rate expectations, US yields and the dollar tend to move in the same direction’.
- According to Lee, Matt. (March 15, 2022), ‘as the value of the U.S. dollar rises globally, the U.S. stock indexes tend to rise along with it.’
- Javier Blas from Bloomberg mentions ‘typically, a strong dollar means weaker commodity prices — and vice versa.’ Ganapathyraman, Sankararaman & Sugumaran, Suresh & Komatheswari, T. & Surulivel, S.T. & Selvabaskar, s & Anand, V.V. & Rengarajan, V. (2018) are confirming: ‘long run the impact of US dollar exchange rate changes on commodity prices is negative and statistically significant.’
Results
We always report visual results from both moving averages rules (short- and long-term) and present tables for the whole mentioned period and for a period after the Bretton Woods system ends.
US Treasuries
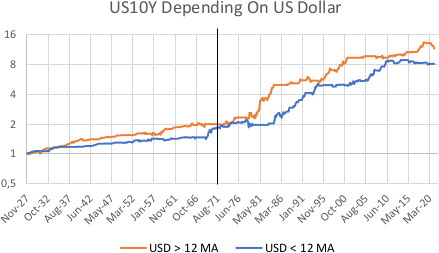
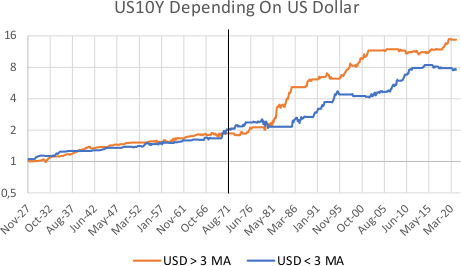
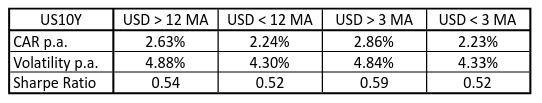
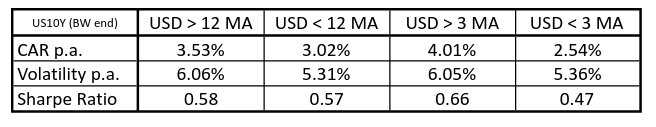
Table 1. Impact of the US Dollar strength/trend on the US Treasuries
There is no significant impact on performance when using either long- or short-period MAs on the US dollar as a trading indicator for US treasuries during the whole period. There was, however, a notable advantage for the exposure in fixed income if USD was over the 3-month (and slightly weaker advantage if over the 12-month MA) after the end of the BW system. We do not have an economic explanation for this effect for you at this moment (only speculations), but the difference in performance is economically significant.
US Equities
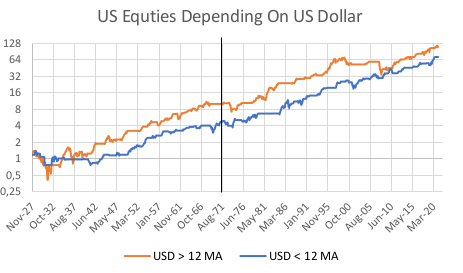
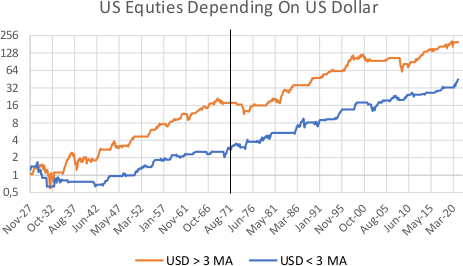
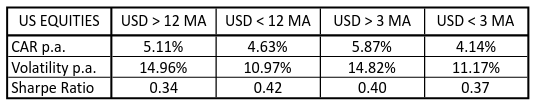
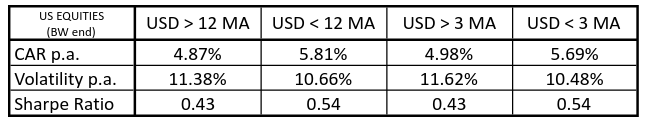
Table 2. Impact of the US Dollar strength/trend on the US Equities
The results for the US equities are really mixed. They perform slightly better on a total return basis over the whole tested period when the US dollar is over the 3-month and 12-month MAs. But we get a different impression when we compare the risk-adjusted performance. Additionally, after the Bretton Woods system’s end, the patterns are inconsistent with the whole sample. Overall, we feel it’s not wise to make strong theories based on the data alone.
Commodities
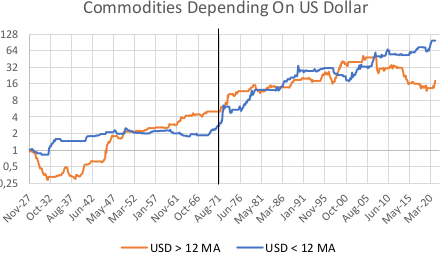
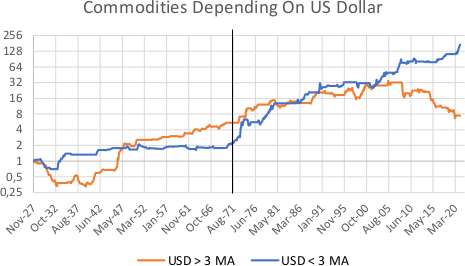
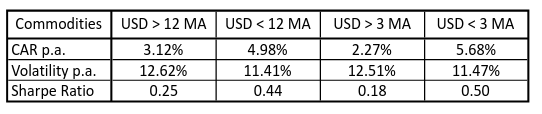
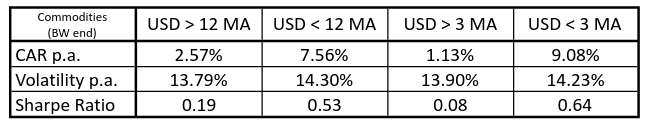
Table 3. Impact of the US Dollar strength/trend on the Commodities
Judging from the data alone, we can observe that commodities are performing better when the US Dollar is weak, meaning that lower US dollar strength translates into higher commodity prices. This can actually be seen from both the long and the short MA variants and even more observed after the Breton Woods system end. This clearly confirms the common sense and experience of investors closely following the commodity markets. However, charts also show that the impact was reversed in the first half of the sample (before and during the Bretton Woods system) – a stronger dollar was followed by higher commodity prices.
Spread portfolio #1:
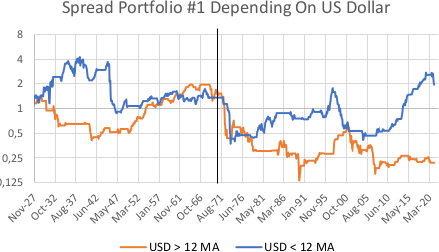
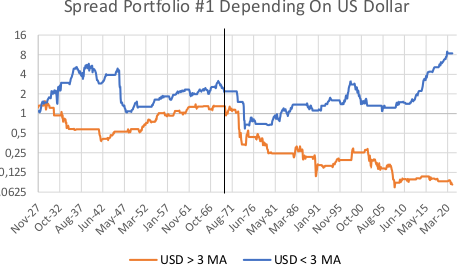
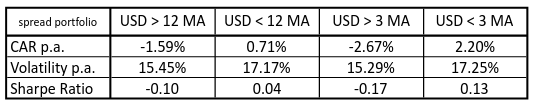
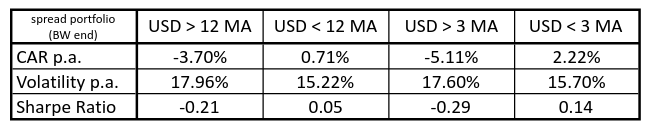
Table 4. Impact of the US Dollar strength/trend on the Spread portfolio 1 (long equities/short commodities)
We can see that the exposure of going long equities and simultaneously short commodities when the US Dollar is weaker (under MAs) produces positive returns. On the other hand, when the US Dollar is strong and in an up-trend, the spread portfolio is significantly negative.
Spread portfolio #2:
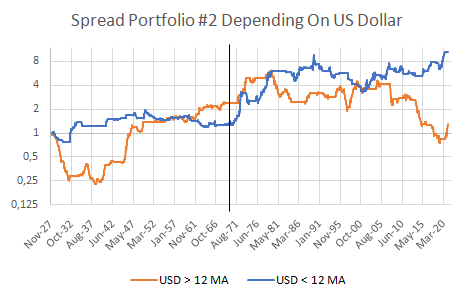
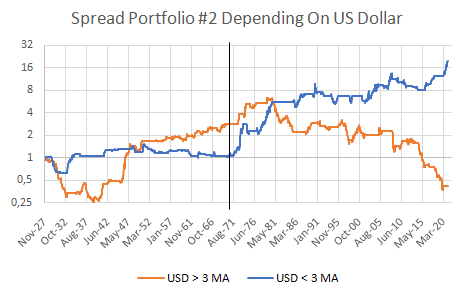
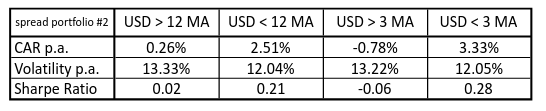
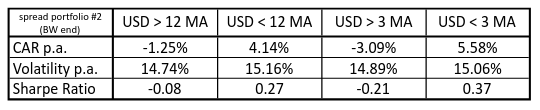
Table 5. Impact of the US Dollar strength/trend on the Spread portfolio 2 (short treasuries/long commodities)
An another spread portfolio; we can again see that a spread portfolio in which we go short treasuries and simultaneously long commodities produces positive returns when USD is weak. Interestingly, it is especially unproductive to do this kind of spread in recent years in case of strong USD, whether using longer or shorter MA.
Short recapitulation & conclusion
Let’s review if we have some confirmations of the questions raised by the academic research:
- We did not actually test the performance of treasuries and the US Dollar based on the strength of a global economy. But we tried to check if there is a link between the US Dollar and US Treasuries’ performance. The data shows that if there is a link, then it’s really weak.
- The US indexes perform slightly better during the whole ~100-year period when the USD index is over its 3 and 12 months MA. However, these results are reversed for the period after BW end. So we have not found confirmation in the data about the relationships between the US Dollar and equities, and we firmly cannot confirm that the hypothesis laid by the second point is valid.
- With a US Dollar in an up-trend, the lower commodity prices will follow, and it is reflected on both shorter (3 months) and longer (12 months) time-frames. The hypothesis is valid; there is nothing more that we can add.
Our tests of the spread portfolios uncovered one neat trick. If we combine the most sensitive asset (commodities) with other assets, then we can create spread portfolios that are more susceptible to the USD movements. Especially after the end of the Bretton Woods system, the shorter trends (USD over/under 3-month MA) are a good signal for timing the Commodities/Treasuries spread portfolio.
As further research, it would be interesting to find out how other aspects such as inflation rate and GDP influence the performance of different asset classes during various regimes of the USD strength.
Are you looking for more strategies to read about? Sign up for our newsletter or visit our Blog or Screener.
Do you want to learn more about Quantpedia Premium service? Check how Quantpedia works, our mission and Premium pricing offer.
Do you want to learn more about Quantpedia Pro service? Check its description, watch videos, review reporting capabilities and visit our pricing offer.
Do you want algorithmic access to the full Quantpedia database via the API? Subscribe to Quantpedia Pro, ask for an API key, and explore the in/out-of-sample statistics, source academic papers, and code snippets — ideal for quantitative research, systematic trading workflows, and AI model training.
Are you looking for historical data or backtesting platforms? Check our list of Algo Trading Discounts.
Or follow us on:
Facebook Group, Facebook Page, Telegram, Twitter, Linkedin, Medium or Youtube
Share onLinkedInTwitterFacebookRefer to a friend


