Investing truly is an intense intellectual undertaking. For a Portfolio Manager (PM) to execute an investment, they must first convince themselves, then others, that the rationale behind the investment is sound. The variables they utilize in developing their rationale are of the upmost importance; These variables inevitably serve as a foundation in the evaluation of a given Asset, and therefore possess the power to influence a PM’s level of confidence in the investment. If a variable is weak, it can lead to a poor diagnosis of the asset in question, which can lead to unfavorable results on a given investment. If a variable is strong, then it will indeed provide insight into asset and therefore help paint a clear picture into the future of the asset. To be on the right side of this sword, it is imperative that portfolio managers correctly implement quantitative reasoning if not within their decision-making process, then definitely around it. This article introduces the theory of mutual information as a tool for asset managers to gauge the predictive efficiency of their selected variables.
Mutual Information
In information theory and statistics, mutual information is a measure of the amount of information shared between random variables (X and Y). In other words, it quantifies how much knowing one of these variables reduces uncertainty about the other, for example if X and Y are independent, then knowing X gives no information about Y and vice versa, therefore, their respective mutual information score will be 0.
To fully explain mutual information, it is imperative that we mention the inherent link that exists between mutual information and another measure called entropy. Entropy is essentially a measure of “uncertainty” or information content in a random variable. For instance, a dataset associated with a financial instrument (i.e AAPL) tends to yield very high entropy scores due to the likely high levels of disorder or unpredictability within the dataset. On the other hand, a binary classification problem (2 outcomes, i.e coin toss) tends to yield very low entropy score as the dataset would exhibit a higher degree of order. In relation to entropy, mutual information is the reduction in uncertainty about a variable. Therefore, in terms of the function’s (fig 1) output, the mutual information score is bounded below by 0 (in cases of total independence between the two variables) and above by the minimum of the entropy outputs between the two variables.
The Mutual Information between two discrete random variables (X and Y) is defined as:

The key components of the formula above are the joint probabilities [likelihood of two things occurring at the same time, denoted as P (X, Y)], as well as marginal probabilities [likelihood of individual event occurring, denoted as P (X)]. Furthermore, two summations (∑) ensure that all possible combinations of the variables are included when one runs the formula, and 〖log〗_2 helps with the scaling of the mutual information score itself, making it easier to interpret and compare. A higher information score indicates strong associations between variables, whereas a low or rather a negligible score indicates redundancy or weak predictive power.
Mutual Information Score in Action
Portfolio Managers can utilize Mutual Information to assess the predictive power between variables within their investment models. However, doing so requires precise problem formulation and data handling. This requires a PM to first and foremost adopt a perspective which is identical to logical standpoint of the mutual information formula explained above. In other words, the PM must mathematically model their desired outcome and assign it as a variable (Y or X). Furthermore, depending on the nature of the variables that are used in a PM’s investment process, additional functions may need to be created. In addition, data collection and handling will be imperative in this process.
Kavod Holdings (The firm that the author of this article co-founded) is a short only quantitative investment firm. Our approach implies that the dataset for our target variable Y exclusively consists of downtrends and X represents different variables which we consider utilizing to predict our target variable Y. Within the given context, our core objective is to determine the extent to which a given variable X can offer: How much information about whether a downtrend will occur (variable Y) is provided from variable X? In the following table, the mutual information score for each variable x is presented:
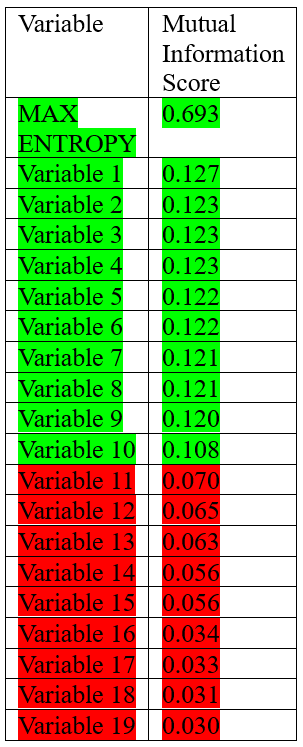
Multiple pathways exist in interpreting the mutual information score, we will dive into the specifics on two distinct approaches One approach involves establishing the minimum entropy score between the two variables, which then enables the calculation of the highest attainable mutual information score. This method can suit those who are looking to perhaps rank the information score of multiple different variables. A second, more effective approach would be to utilize the P-value measure to interpret and compare individual scores. The P value is a measure in statistics that quantifies evidence against a null hypothesis. In a sense, P value operates like a litmus test, indicating the extent to which the data contradicts a proposed idea. Through utilizing the p score, PM’s will be incorporating a measure of statistical significance into the variable selection process, which further increases the confidence one may warrant to a particular variable. In addition, by thresholding the P values given by each individual mutual information score for a given variable, a PM will be able to have a reliable benchmark of which you can compare present and future variables. In table 1, green highlighted variables passed the P value Threshold whereas red variables failed to pass the threshold. Red variables therefore can be considered to have weak predictive power, and therefore are excluded from our investment model, whereas the green variables, particularly variable 1, would be considered to have significant mutual information scores and can therefore be used in live trading.
Performance improvement
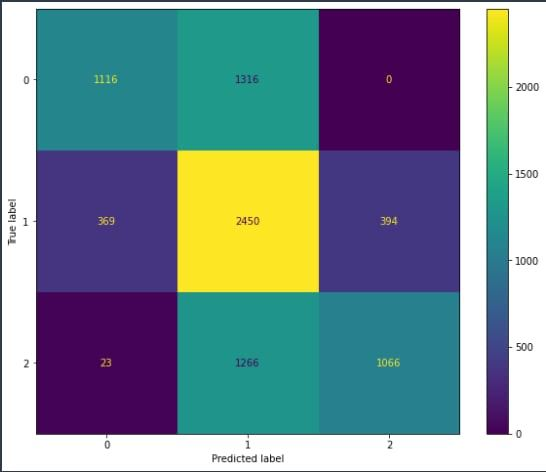
Before incorporating the selected features into our system, our machine learning model exhibited a precision score of 0.37 (on a scale of 0 to 1) [FIG 1]. Building a proficient and resilient machine learning model for any task involves numerous complex factors, and trading presents a unique set of challenges. Addressing these hurdles demands tackling multiple stages across various facets of the machine learning development process. While the lower score likely stemmed from a multitude of reasons, a prominent factor was the inadequacy of tools—functions and formulas—within the model to accurately predict the target group.
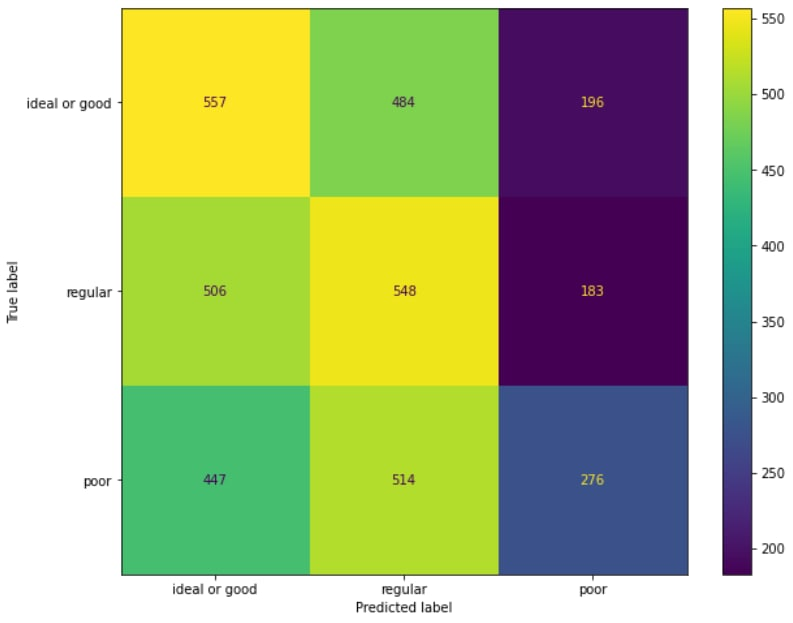
Fig 2 represents the performance of the ML model following the trimming of the feature list through Mutual Information Scores. In addition to the aforementioned change, we also increased the sample size for each label, as well as the troubleshooting of 2 of our proprietary functions. After all the implementations had been completed, we saw a 0.2 increase in our precision metric from (0.37 to 0.57)
Conclusion
In conclusion, Mutual information can be quite a robust tool for Asset Managers seeking to enhance their decision-making process. Through understanding which variables contain substantial or rather sufficient mutual information, managers will be able to assess the strength of each variable’s influence on outcomes. In addition, managers can prioritize those variables within their decision-making process, as well as use those strong variables as benchmarks against future variables a manager may consider adding.
About the Authors
Gabriel Kingsley-Nyinah: Gabriel Kingsley-Nyinah is the Co-founder and Managing Director of Kavod Holdings. Kavod Holdings is an emerging quantitative investment firm with a distinct focus on short only trading. In his capacity at Kavod, Gabriel has steered the Research and Development (R&D) initiatives, as well as overseeing the trading operations governed by sophisticated algorithms and machine learning models.
Sergei Egorov: (Master of Mathematics at Rouen University, France) Sergei Egorov is the team lead of the Research Department at Talestorm, a software development house currently focused on LLM integration across sectors, as well as Kavod Holdings.
Are you looking for more strategies to read about? Sign up for our newsletter or visit our Blog or Screener.
Do you have an idea for systematic/quantitative trading or investment strategy? Then join Quantpedia Awards 2024!
Do you want to learn more about Quantpedia Premium service? Check how Quantpedia works, our mission and Premium pricing offer.
Do you want to learn more about Quantpedia Pro service? Check its description, watch videos, review reporting capabilities and visit our pricing offer.
Are you looking for historical data or backtesting platforms? Check our list of Algo Trading Discounts.
Or follow us on:
Facebook Group, Facebook Page, Twitter, Linkedin, Medium or Youtube
Share onLinkedInTwitterFacebookRefer to a friend


