Grading and Merging ESG Scores from Multiple Providers
Socially responsible investing, also known as ESG investing, is a recent trend in the world of portfolio management. More and more investors have started to look into the Environmental, Social, and Governance scores of the companies they invest in. However, one major problem with ESG scoring is that there is not one universal scoring system. Many companies sell ESG data, but the scores are not comparable, and additionally, the ESG data providers are not very transparent about how they create the ratings. These problems with ESG data mean we need to have a method to grade and merge the information from multiple providers.
The authors of this research paper analyze the various scoring systems and the attributes that can explain the movement in ESG ratings. Ultimately, the authors aim to find the most relevant elements of ESG ratings for the firms from each sector. The paper focuses on the ordered probit model proposed in Hausman, Lo, and Machkinlay (1992), because of the discrete nature of the data. Firstly, they examine the credibility of every sector individually. Then, after accounting for each sector’s credibility, they apply the probit transformation to combine the data from all providers. Lastly, they explore multiple ways of weighting the information from various providers to end up with the most reliable ESG score.
Author: Invest Verte
Title: InvestVerte Framework
Link: https://investverte.com/api/share/investverte-framework
Abstract:
“This paper explores how to merge statistically the information from different providers and explores a larger source of attributes that can explain the movement in ESG ratings. the aim is to have an in-house and transparent scorecard and to find the most relevant attributes for ESG ratings for the firms belonging to a certain sector.”
As always, we present several interesting figures:
Notable quotations from the academic research paper:
“In recent years, Environmental, Social, and governance (hereafter, ESG) ratings have become influential information for Investors relying on assessing corporate ESG performance. Institutional investors aim from corporations to set up ESG processes, manage ESG issues and monitor ESG performance (Dyck et al., 2019). This is due to the additional return expectation in the generally low-interest rate financial environment and the lack of return in a more conventional investment area.
ESG providers disclose a high difference in their final rating (Chatterji et al., 2016). From six different providers namely, KLD (MSCI Stats), Sustainalytics, Vigeo Eiris (Moody’s), RobecoSAM (S&P Global), Asset4 (Refintiv), and MSCI a recent study assesses the average correlation of 0.54 (F. Berg et al., 2020).
Also, ESG rating agencies disclose a low level of transparency on their Rating assessment and as the discrepancies are high, we can say that their framework differs substantially. Many different root causes can explain the discrepancies between providers, but we can denote the set of attributes or even if the providers measure the same set of attributes the metrics used may differ and the scorecards and the weights for a given set of attributes may differ and induces the ESG rating differences between providers (F. Berg et al., 2020).
Our study aims to propose a methodology for consensus such as all information available from different public sources can be aggregated and collected.
This paper explores how to merge statistically the information from different providers and explores a larger source of attributes that can explain the movement in ESG ratings. the aim is to have an in-house and transparent scorecard and to find the most relevant attributes for ESG ratings for the firms belonging to a certain sector.
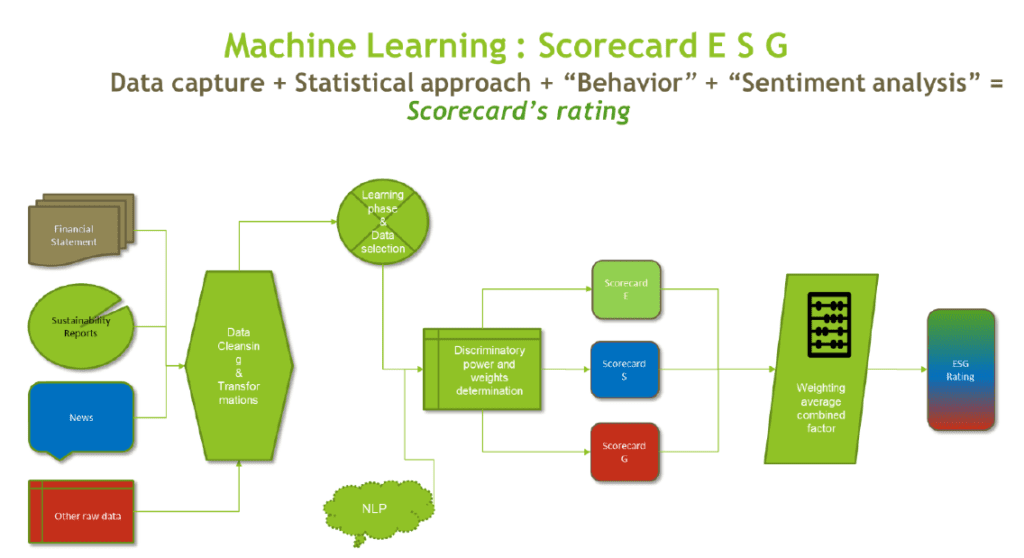
Before the weighted average is performed, the target variable namely E, S and G are transformed in gaussian quantile under 100 buckets. The reasons are, first, to make the E, S G ratings from different providers comparable. Second, as it is a biased market, the ESG rating outputs from different providers mays lead to having non-gaussian behaviour. As in credit rating, and thanks to central limit theory, the rating should converge towards a Gaussian distribution. Given the low number of rated companies for each provider, a gaussian transformation should be applied.
To combine all ESG rating (after probit transformation) providers we explore two methods. The first method (α) uses a number weighted average ESG rating. The rationale is that the more a provider rates companies in a specific sector and/or region, the more accurate is the rating. The final ESG rating is calculated as follows.
The second method (β) uses a value-weighted average ESG rating per sector. The rationale is that the provider may have an incentive to rate a certain size of the firm for a specific sector. This may lead to considering the expert effect of the provider on the average. More a provider is a specialist in one sector higher its weight. Therefore, the weight will be assigned per sector/region.
In conclusion, the Sector and the Region matter in the way to have a weighted average combined E, S and G score. A more granular weight will be used in our methodology to use Sector and Region segmentation to weight the ratings.
The final model is a joint model which combines the quantitative model and the qualitative model. Both models produce a score function which is obtained by multiplying each variable with its coefficient and summing these terms in a logistic regression function. A rescaling is done so that each score is between 0 and 100 (the so-called z-score). We denote the z-score for the quantitative model as 𝑍𝑄𝑢𝑎𝑛𝑡 and for the qualitative model as 𝑍𝑄𝑢𝑎𝑙. To construct the final model, the quantitative model and qualitative are joined using the multiple ordinal logistic regression with the quantitative and qualitative z-scores as inputs. Only the common observations between quantitative and qualitative datasets can be used. It is generally the case that one of the 2 components has more observation making the estimators and the final z-score more robust in one of the components.”
Are you looking for more strategies to read about? Sign up for our newsletter or visit our Blog or Screener.
Do you want to learn more about Quantpedia Premium service? Check how Quantpedia works, our mission and Premium pricing offer.
Do you want to learn more about Quantpedia Pro service? Check its description, watch videos, review reporting capabilities and visit our pricing offer.
Do you want algorithmic access to the full Quantpedia database via the API? Subscribe to Quantpedia Pro, ask for an API key, and explore the in/out-of-sample statistics, source academic papers, and code snippets — ideal for quantitative research, systematic trading workflows, and AI model training.
Are you looking for historical data or backtesting platforms? Check our list of Algo Trading Discounts.
Or follow us on:
Facebook Group, Facebook Page, Telegram, Twitter, Linkedin, Medium or Youtube
Share onLinkedInTwitterFacebookRefer to a friend


