Historical Returns for US Bonds since 1793
We have mentioned it several times – we are quants but we love history and we love research papers like this:
Author: McQuarrie
Title: The First Eighty Years of the US Bond Market: Investor Total Return from 1793, Combining Federal, Municipal, and Corporate Bonds
Link: https://papers.ssrn.com/sol3/papers.cfm?abstract_id=3260733
Abstract:
US securities markets took root after Alexander Hamilton’s refunding of the Federal debt in the early 1790s. Accordingly, a market in bonds has been in operation in the US for over two centuries. Until recently, however, little was known about the bond market prior to 1857. This paper focuses on investor holding period returns, using newly compiled data on bond prices, rather than focusing on the movement of yields, as in Homer (1963). It incorporates the relatively familiar Treasury securities from before President Andrew Jackson paid off the debt in 1835, but also includes state and city debt, which ballooned beginning in the 1820s, as well as corporate debt, from its beginnings about 1830 to its explosion after 1850. I find that all three classes of bonds provided investors with similar total returns, excepting a brief period in the 1840s when state securities plunged before recovering. I also find that real returns in the eight decades following 1793 were generally higher than the long-term average return of 3.6% proposed for bonds in Siegel (2014). I further find that in these early years, bonds sometimes out-performed stocks over periods of several decades, again contrary to Siegel’s thesis. The paper considers the implications of a demonstration that stocks and bonds performed differently in the nineteenth century as compared to the twentieth century.
Notable quotations from the academic research paper:
"The importance of the nineteenth century, in the context of financial history, is to provide a check on hasty generalizations from limited data. Returns from a few decades in the twentieth century, first made available in Fisher and Lorie (1964), must be regarded as limited indeed. This limited twentieth century data, which emerged as financial history was developing as a discipline and has been widely diffused in publications by Ibbotson (2016, Stocks, Bonds, Bills & Inflation), has strongly inflected conclusions about what investors can expect over the long-term. The twentieth century US data, especially following WW II when the US economy bestrode the world as a colossus, paints a very sunny picture for stocks, and a sad cloudy picture for bonds, memorialized in Siegel (2014, Stocks for the Long Run).
The US had a rather different economy in the nineteenth century, especially the antebellum years which have been the focus of this paper. Likewise, the US economy then held a very different and much more minor position in the world economy. Hence, it was rhetorically powerful for Siegel (2014) to advertise that two centuries of data told one consistent story: stocks are splendid, bonds are laggards. Consistent performance across two such wildly different epochs was strongly supportive of his thesis.
It now appears that Siegel’s (2014, Stocks for the Long Run) early nineteenth century database was both thinner than many readers may have realized (e.g., dividend payments were estimated rather than observed; many prominent stocks were excluded), and more prejudicial to bonds than may have been grasped (e.g., by taking the minimum of Federal and municipal yields, even after Federal bonds gained circulation privileges). The much thicker datasets here do not support Siegel’s attempt to generalize from mid-twentieth results to the very different circumstances faced by US investors in the early nineteenth century. As it becomes possible to stitch together an unbroken multi-century record for both stocks and bonds, discussion may turn to the factors that determine when stocks (bonds) will do well, and when stocks (bonds) will do poorly. There is now a counter to Siegel’s thesis: that both investments follow a random walk within bounds, and that these bounds may not differ by much across these two major categories of investment.
Stocks did out-perform bonds in the middle of the twentieth century, per Ibbotson and Siegel; but stocks did not out-perform bonds in the first few decades of the nineteenth century. Generalizations from the middle of the twentieth century do not hold—these now appear as simple extrapolations. Gainsaid in the nineteenth century, these extrapolated returns may not apply to the twenty-first century either.
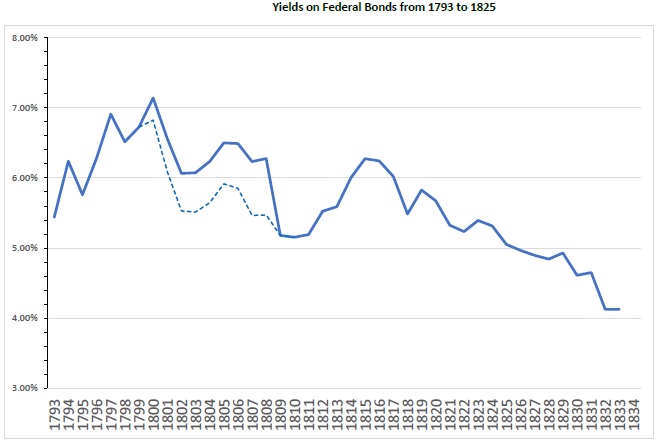
Examining Figure 1, the pattern is straightforward. Yields rose through the 1790s, then declined until the War of 1812 (prior to the war, the government steadily paid down its debt). After the war Federal yields resumed their decline, ending at their low point for the period charted.
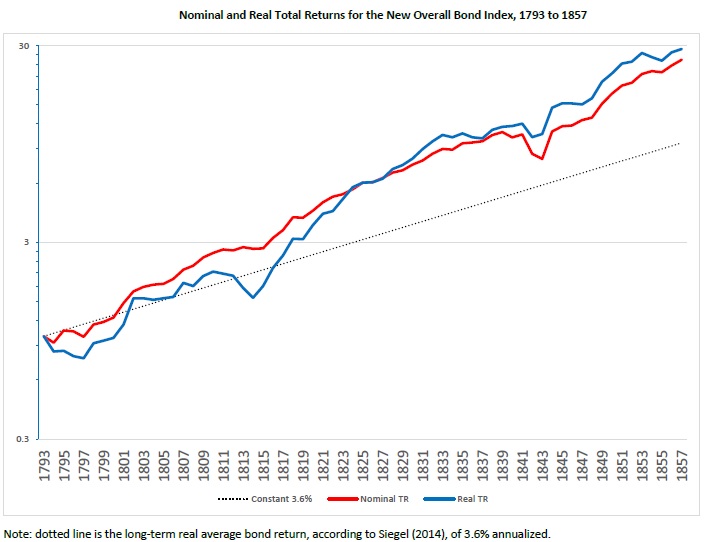
A simple summary of the newly uncovered sixty-four years of bond returns charted in Figure 12 might state:
1) returns for the period were well above the long-term average cited by Siegel (2014);
2) bonds are as subject to bull and bear markets as stocks;
3) bond returns can be depressed or super-charged over periods decades in length.
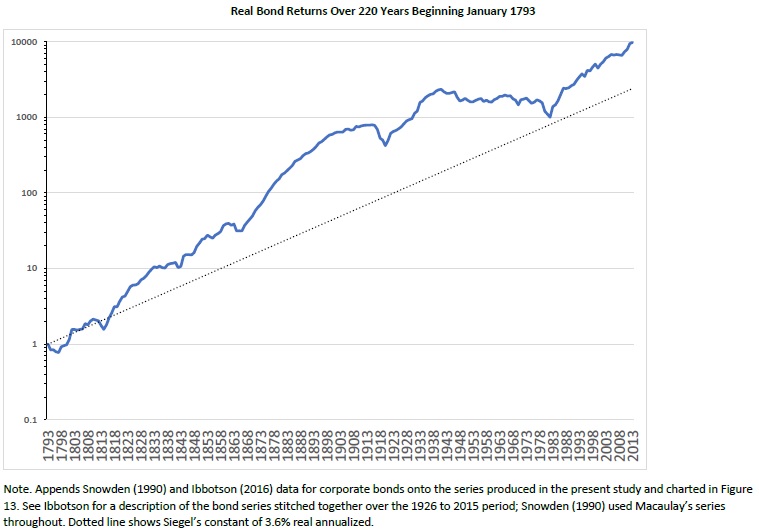
The most straightforward interpretation of Figure 14 is that bond investors never received the average return over any lengthy period. Rather, from time to time bond investors suffered depressed returns, most notably from the 1940s through 1980, but also from 1793 through 1814, while at other times, bond investors enjoyed sustained periods of unusually high returns, most notably from the end of the Civil War to the beginning of World War I, but also from the end of the War of 1812 to the beginning of the Civil War, and from 1981 to the present day. Bond investors were also vulnerable to sudden sharp shocks in which the real value of a bond portfolio dropped 30% or even 40% over a few years (these were mostly associated with bouts of wartime inflation). Conversely, during favorable periods bond investors could rack up multi-decade returns comparable to those expected from stocks. Over the eighty-seven years beginning in 1814, bond investors received an annualized real return of 7.12%–somewhat higher than the long-term return to be expected from stocks, according to Siegel, of 6.6%.
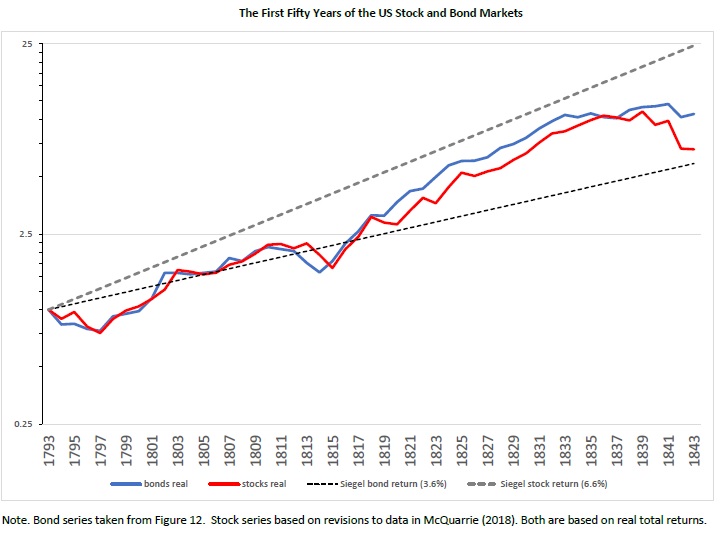
Figure 15 combines fifty years of bond data gathered in this paper with fifty years of stock returns. The pattern is not supportive of Siegel’s claim that stocks must out-perform bonds over decades-long periods. Nor does the pattern support Siegel’s (and Bernstein’s) expectation that real stock returns, measured over the long-term, will converge on an underlying constant, currently estimated by Siegel as 6.6%. Rather, stocks significantly underperformed this standard over the 1793-1843 period.
If Siegel (2014) had never published his thesis about stocks for the long run, and Figure 15 were the only evidence available on historical stock and bond returns in the nineteenth century, what would be the most straightforward interpretation of it?
Answer: that over most periods decades in length, stocks and bonds return about the same. Second, that returns fluctuate, consistent with a random walk within bounds, in which strings of good or bad performance, of any length, may occur. Accordingly, in the fullness of time sharp drops may occur, and stocks and bonds may drop together or not. Likewise, stocks and bonds may register an above-trend performance, lasting decades, which may be coincident or not. If the analyst is free to select an arbitrary beginning point, subject only to that point being decades in the past, then when measured at exactly the right (wrong) time, stocks can be shown to have under-performed bonds “over the long run.” The fifty years from 1793 provide such an example. Stocks returned 3.96% real annualized, while bonds returned 4.88%. As before, the difference sounds small until converted into ending portfolio values. Over those fifty years, perhaps one of the worst five-decade periods in the history of the US securities markets, stocks turned an investment of $1000 into $6,963, but bonds turned that $1000 into $10,807."
Are you looking for more strategies to read about? Sign up for our newsletter or visit our Blog or Screener.
Do you want to learn more about Quantpedia Premium service? Check how Quantpedia works, our mission and Premium pricing offer.
Do you want to learn more about Quantpedia Pro service? Check its description, watch videos, review reporting capabilities and visit our pricing offer.
Do you want algorithmic access to the full Quantpedia database via the API? Subscribe to Quantpedia Pro, ask for an API key, and explore the in/out-of-sample statistics, source academic papers, and code snippets — ideal for quantitative research, systematic trading workflows, and AI model training.
Are you looking for historical data or backtesting platforms? Check our list of Algo Trading Discounts.
Or follow us on:
Facebook Group, Facebook Page, Telegram, Twitter, Linkedin, Medium or Youtube
Share onLinkedInTwitterFacebookRefer to a friend


