How to Build Mean Reversion Strategies in Currencies
Our article explores a simple mean reversion trading strategy applied to FX futures, focusing on identifying undervalued and overvalued currencies to generate returns. Using FX futures rather than spot rates allows for the inclusion of interest rate differentials, simplifying the analysis. The strategy employs two position-sizing methods—linear and exponential—both rebalanced monthly based on currency deviations from their mean. While the linear method offers stability, its returns are limited. In contrast, the exponential method, despite higher risk and deeper drawdowns, ultimately delivers stronger growth and better overall performance by leveraging the mean reversion tendencies of FX pairs.
Introduction
Mean reversion is a fundamental concept in financial markets that suggests asset prices and returns eventually move back toward their historical average or mean level over time. This phenomenon can be observed across various asset classes, including equities, commodities, and currencies – particularly in currency pairs within FX markets. Instead of solely focusing on spot exchange rates, it is often more beneficial to use FX futures for analyses. The reason for this is that FX futures continuous data series incorporate the interest rate differentials between currencies, automatically including the carry return. If we rely solely on spot rates, such as EUR/USD, we would need to manually calculate and adjust for swap points to account for the costs or benefits of holding a higher-yielding currency against a lower-yielding one.
By analyzing a basket of currencies, we can calculate an average exchange rate and identify which currencies have deviated significantly from this mean. Those that move too far from the mean have a tendency to revert, creating an opportunity to buy undervalued currencies and short overvalued ones, which is in line with the natural mean-reverting tendency of FX pairs.
Thus, we arrived at the hypothesis: if we construct a simple strategy that goes long on undervalued currencies and short on overvalued ones, we will generate excess returns that exceed average expected returns, regardless of market movements or the benchmark. In other words, we aim to achieve pure alpha performance.
Strategy analysis
For this strategy, we used daily adjusted prices of FX futures traded on derivatives exchanges, specifically AD1 (futures on the Australian Dollar), BF1 (futures on the British Pound), CD1 (futures on the Canadian Dollar), EC1 (futures on the Euro), SF1 (futures on the Swiss Franc) and JY1 (futures on the Japanese Yen). We are using the continuous futures for our analysis. More details on how to build such data series can be found in our older post, Continuous Futures Contracts Methodology for Backtesting. The dataset covers the period from February 13, 2007 to September 5, 2024, during which only the last available price of each month was selected for the subsequent analyses.
In the first step, we calculated the cumulative return of each FX future on the last trading day of the month and created an “average futures” series, that’s used over the course of the analysis as an anchor towards which the all individual continuous FX futures tend to mean revert.
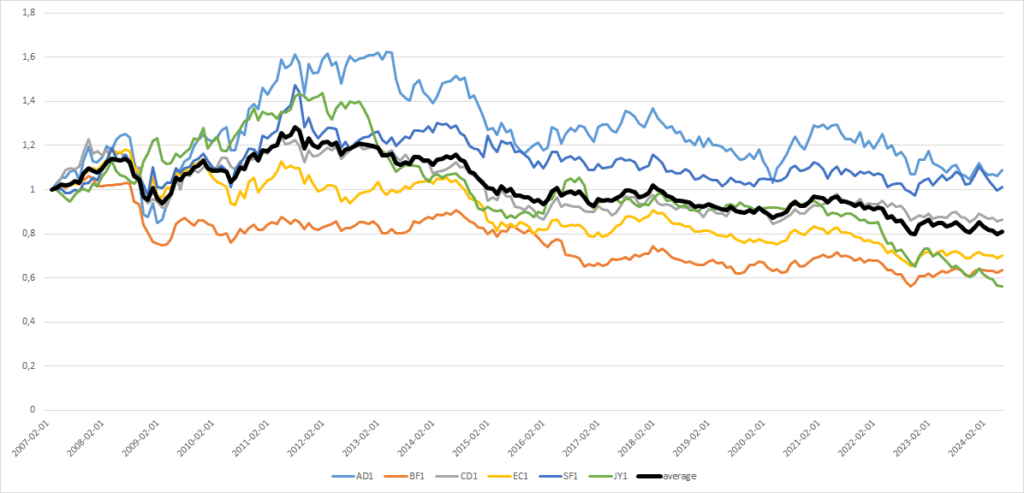
If an individual FX future exceeded the average (it’s an overvalued currency), we went short; otherwise, if it was below the average (it’s an undervalued currency), we went long. This approach is similar to a grid trading strategy, which is described in more detail in studies such as What’s the Relation Between Grid Trading and Delta Hedging? or A Primer on Grid Trading Strategy. As the FX futures contracts are signed for a specific period, we deal with them in terms of continuously rolled futures data series. To maintain our positions even after they expire, we sell them before the expiration date and buy new ones. Thus, we ensure their ongoing holding.
Of course, the most important question for any mean reverting strategy is to how to assign weights for individual currencies. We decided to set weights such that the larger the difference between the given individual continuous futures data series and the average, the greater the weight assigned to the short/long position. There are two possible ways for managing this – linear or exponential. In both cases, we repeated this process monthly.
Linear position sizing
In linear position sizing, we used the difference between the given continuous futures series and the average futures series as the weight for the short/long position. For example, if the continuous futures series of a currency is 20% higher (20% lower) than the average of all futures series, then we go short 20% of the currency (go 20% long), and so on.
Exponential position sizing
In the exponential approach, we also utilized the difference between the individual continuous futures and the average data series, but this time, the weight for the short/long position is set in the exponential style. For instance, if the individual continuous future was 20% higher (20% lower) than the average, we allocated 40% of the currency to a short position (40% to a long position). If the individual continuous future was 30% higher (30% lower) than the average, we allocated 90% of the currency to a short position (90% to a long position), and so on (160% weight for a 40% difference, etc.). Of course, there is a risk of uncontrolled leverage growth when using the exponential position sizing, but if applied correctly, it is manageable and not overly dangerous.
Comparison of the position sizing methods
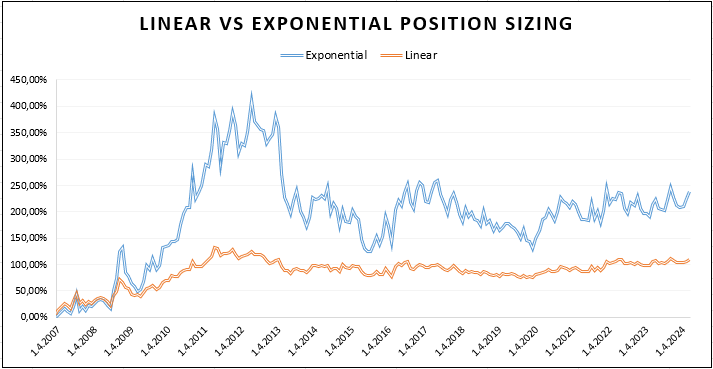
And how do the total weights of the portfolios managed by linear and exponential weightings develop over time? We can review that by looking at the picture in Figure 2. As we can see, the total weights of futures in the portfolio (total leverage) can rise significantly in the periods when individual continuous futures move far away from the average, which serves as the anchor for the portfolio. In contrast, the linear position sizing is more stable, and the total position size rarely exceeds 150%; it usually oscillates around the 100% value.
Linear vs Exponential Mean Reversion Trading Strategy
Based on linear position sizing, we created a linear mean reversion trading strategy, and similarly, an exponential mean reversion trading strategy was developed using exponential position sizing. Both strategies are rebalanced monthly, with FX futures selected for short or long positions based on the same principle—shorting overvalued and buying the undervalued continuous futures. The primary difference between the two strategies lies in the weight invested in each FX future, which is determined by linear or exponential position sizing. Both portfolios started with an initial value of 1.
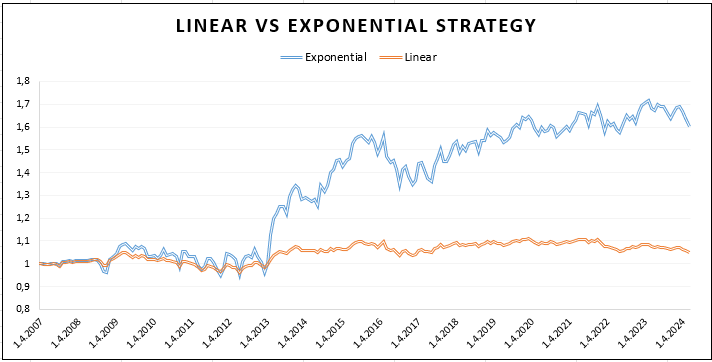
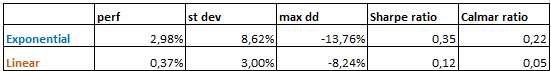
The linear strategy shown in Figure 3 appears stable, with insignificant drawdowns but no tendency to grow. The value of the linear strategy portfolio has fluctuated around 1.1 for 10 years, which is not interesting at all. This poor performance is further confirmed by the low Sharpe ratio of 0.12 and the Calmar ratio of 0.05 (shown in Table 1). On the other hand, the trading strategy with the exponential position sizing portfolio delivers attractive positive excess returns (all returns are calculated from the continuous futures data series and, therefore, are excess returns over the cash) with a Sharpe ratio of 0.35.
Conclusion
The mean reversion behavior is a well-utilizable feature in many fields of the investing world, and as we have observed, it also applies to currency FX futures. By leveraging this property, we can build a profitable strategy, particularly in combination with the exponential position sizing method. However, nothing is free, and there is a risk that its application could create uncontrollable leverage. Our exponential position sizing doesn’t have excessively high total leverage (450% in the maximum point), so if smart risk management is used, the simple mean reversion strategies in currencies can be used as a diversifier or source of an additional uncorrelated return in the broader multi-asset multi-strategy portfolio. Of course, more sophisticated methods for position sizing can be developed than the two we have presented. However, our goal was to show the potential of the simple currency mean-reversion strategies as a group and not to develop the best possible trading strategy. We will leave the possible paths to improve performance and return-to-risk ratios of mean-reverting strategies for future articles.
Author: Sona Beluska, Quant Analyst, Quantpedia.com
Are you looking for more strategies to read about? Sign up for our newsletter or visit our Blog or Screener.
Do you want to learn more about Quantpedia Premium service? Check how Quantpedia works, our mission and Premium pricing offer.
Do you want to learn more about Quantpedia Pro service? Check its description, watch videos, review reporting capabilities and visit our pricing offer.
Are you looking for historical data or backtesting platforms? Check our list of Algo Trading Discounts.
Would you like free access to our services? Then, open an account with Lightspeed and enjoy one year of Quantpedia Premium at no cost.
Or follow us on:
Facebook Group, Facebook Page, Twitter, Linkedin, Medium or Youtube
Share onLinkedInTwitterFacebookRefer to a friend


