How to Improve Post-Earnings Announcement Drift with NLP Analysis
Post–earnings-announcement drift (abbr. PEAD) is a well-researched phenomenon that describes the tendency for a stock’s cumulative abnormal returns to drift in the direction of an earnings surprise for some time (several weeks or even several months) following an earnings announcement. There have been many explanations for the existence of this phenomenon. One of the most widely accepted explanations for the effect is that investors under-react to the earnings announcements. Although we already addressed such an effect in some of our previous articles and strategies, we now present a handy method of improving the PEAD by using linguistic analysis of earnings call transcripts.
Introduction
The use of traditional data sources, such as company filings, broker forecasts, and management guidance, is considered a standard financial analysis approach. Alternative data are defined as non-traditional because they can provide an indication of the future performance of a company outside of traditional sources. This data can be used as part of the pre-trade investment analysis, as well as help investors monitor the health of a company, industry, or economy. Alternative data present great opportunities for fundamental and quantitative institutional investors to create innovative sources of alpha.
One of the recent very useful additions to the research of PEAD is the use of natural language processing (NLP). Natural language processing (NLP) is a branch of linguistics, computer science, and artificial intelligence concerned with the interactions between computers and human language, in particular, how to program computers to process and analyze large amounts of natural language data. In our strategy, they are earnings transcripts. The main aim strives to give computers the ability to understand the text and spoken words in much the same way human beings can.
In our approach, we have been inspired by PEAD.txt: Post-Earnings-Announcement Drift Using Text paper, where researchers present a new numerical measure of earnings announcement surprises with a text-based empirical model to show that the calls’ news content is about details behind the earnings number and the fundamentals of the firm. Results from the paper provide the basis and additional evidence for investors’ underreaction to earnings announcements since earnings calls contain a wide range of information regarding the firm’s performance, which goes far beyond the headline number.
For this article, we use the Brain Language Metrics on Earnings Calls Transcripts (BLMECT), an alternative dataset from research-focused company BRAIN. The whole dataset is composed of two parts. Part one includes several language metrics for the most recent earnings call transcript for each stock, and part two includes the differences between the most recent earnings call transcript and the previous one. The metrics calculation is reported separately for the a./ Management Discussion, b./ Analysts’ Questions, c./ Management Answers to Analysts’ Questions sections of the transcript. The dataset is composed of data from 4500+ US stocks available from 2012, and is updated daily.
Our Strategy
The investment universe used in our strategy is composed of the 500 most liquid stocks with a price at a minimum of 5$, which have earnings call sentiment data available. Sentiment surprise is then calculated as the difference between the most recent Sentiment and mean Sentiment measure during the previous 8 quarters from the Management Discussion section and can be either positive or negative. The value is then used to build ranking rules in the inclusion of stocks in the long-short portfolio. Earnings call sentiment data are modeled to be known one week after the Earnings Calls Transcripts date for each stock. The portfolio is formed weekly with a 12-week holding period (so 1/12 of the portfolio is rebalanced every week).
The ranking is based on the Sentiment surprise variable. Investor goes long the first quintile (stocks with higher Sentiment positive surprise) and shorts the last quintile. The portfolio is equally-weighted (uniform for each quintile). To account for transaction costs, we use our standard custom fee model, which takes a total of 0.005% from each order.
Results
Our preliminary findings for the first strategy version are promising. A long-short strategy built on the most liquid stocks has a 2.6% compounding annual return with a Sharpe Ratio of 0.50 and a maximum drawdown -of 9.4%.
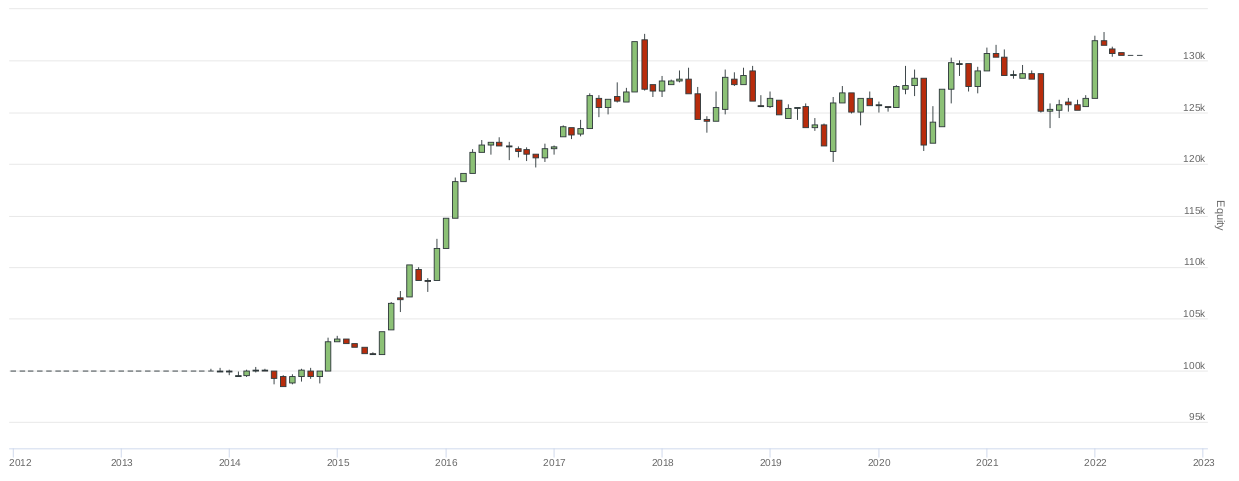
This variation of strategy has been flat for the last few years. Nevertheless, it utilizes very liquid balanced long-short equity exposure, which smooths out most of the volatility, and the rules we present are the first that came to our mind when we saw the dataset. The promising preliminary results lead to the next robustness tests.
Further Work
To further improve our work, we’ve done basic robustness tests. The main idea behind this was to try different variations by changing 3 main parameters to find out how they change overall performance results, and we vary rules between:
- sorting of data into/by: sets of median (1/2), terciles (1/3), quartiles (1/4), quintiles (1/5; as by default), and deciles (1/10),
- calculation of sentiment surprise by taking various periods into account: the most recent sentiment coming from actual earnings call statement and mean sentiment during previous 4, 8 (set as default), 12, and 20 quarters, and
- holding periods of stocks in portfolio, whether they are short or long: 4, 8, 12 (set as default), 24 and 48 weeks.
One variable is always changed, and other ones are set as default constants. That gives us a ceteris paribus chance to see changes while keeping other parameters the same.
As you are used to know, we tested the strategies in QuantConnect and calculated further data by exporting equity curves into Quantpedia Pro into our Portfolio Manager.
Preliminary Results
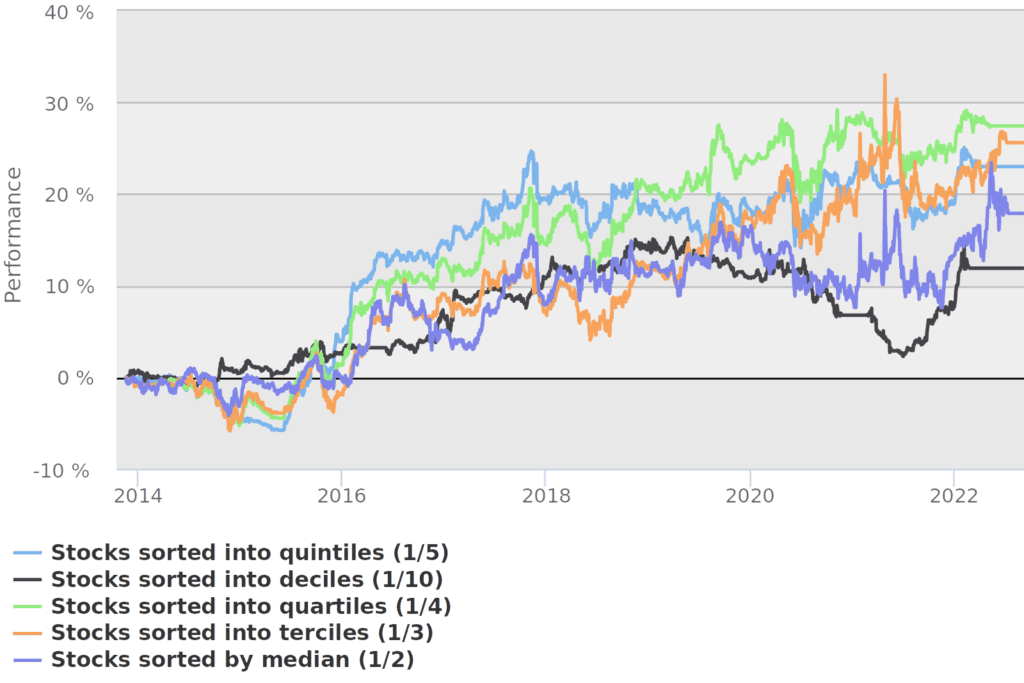
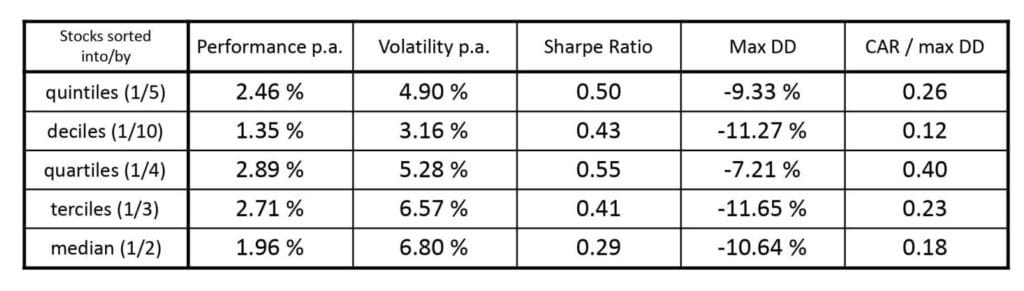
We have judged that best results are achieved when using quartiles (1/4) and terciles (1/3) for sorting stocks in portfolio. We take that as basis for forming our final recommended strategy’s variant.
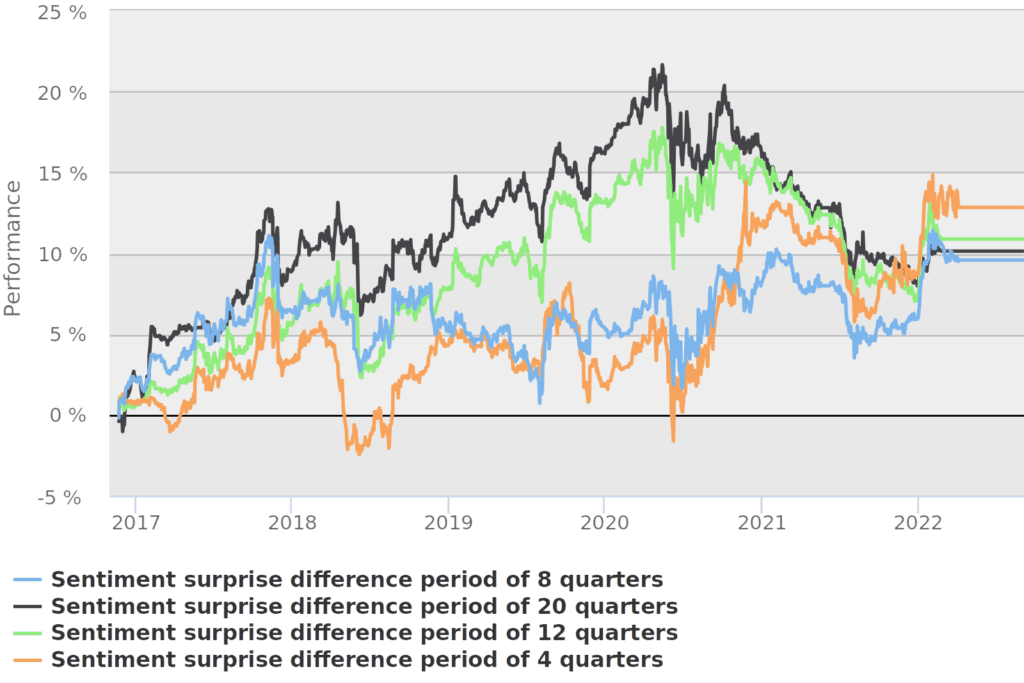
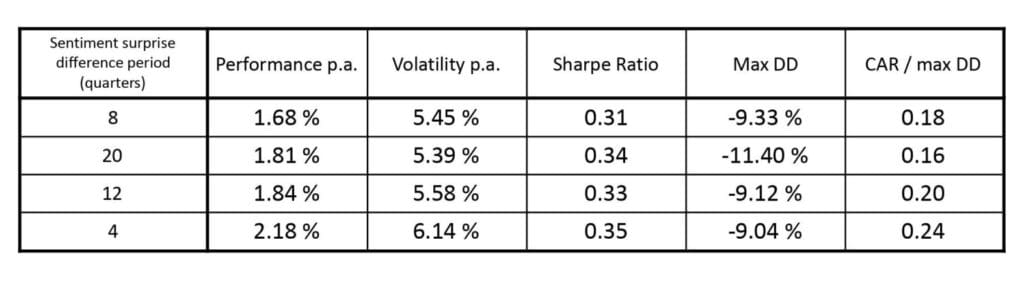
It looks like the best length of period for taking previous earnings releases into account is 4 quarters, and we select it as our preference for further research. On the other hand, the longest period, with 20 quarters, was very good, performing most of the time before 2021 but came quite fading after.
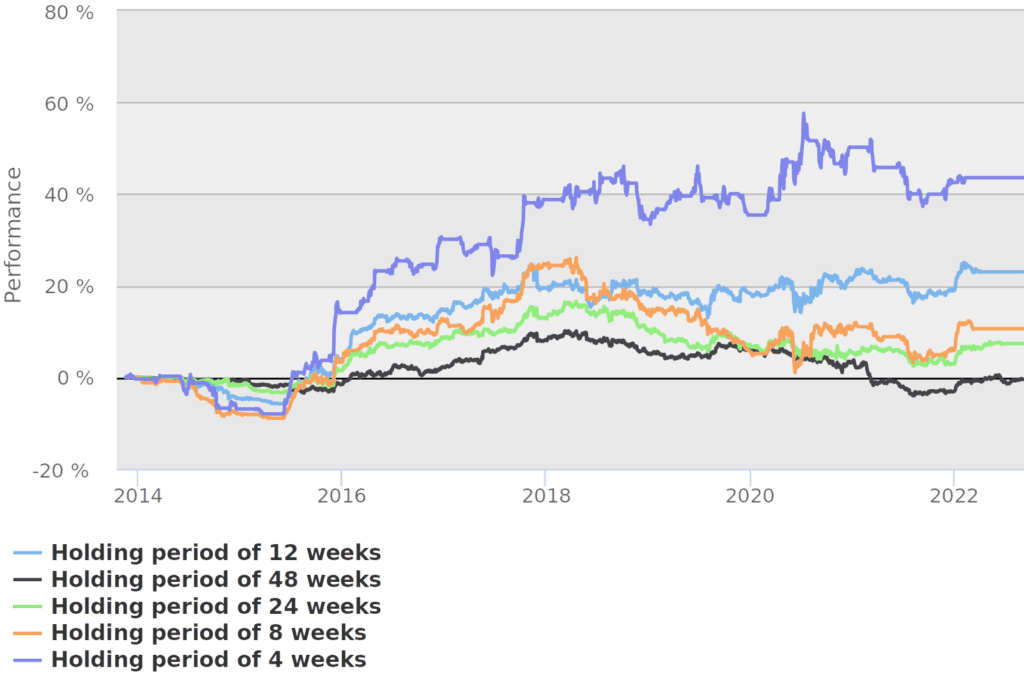
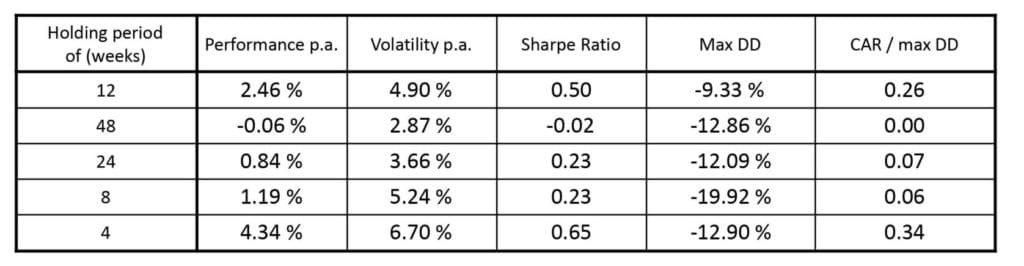
It is pretty clear that it is best to hold constructed long-short portfolio for 4 weeks only. This was used default in our final tests.
Final strategy’s variant
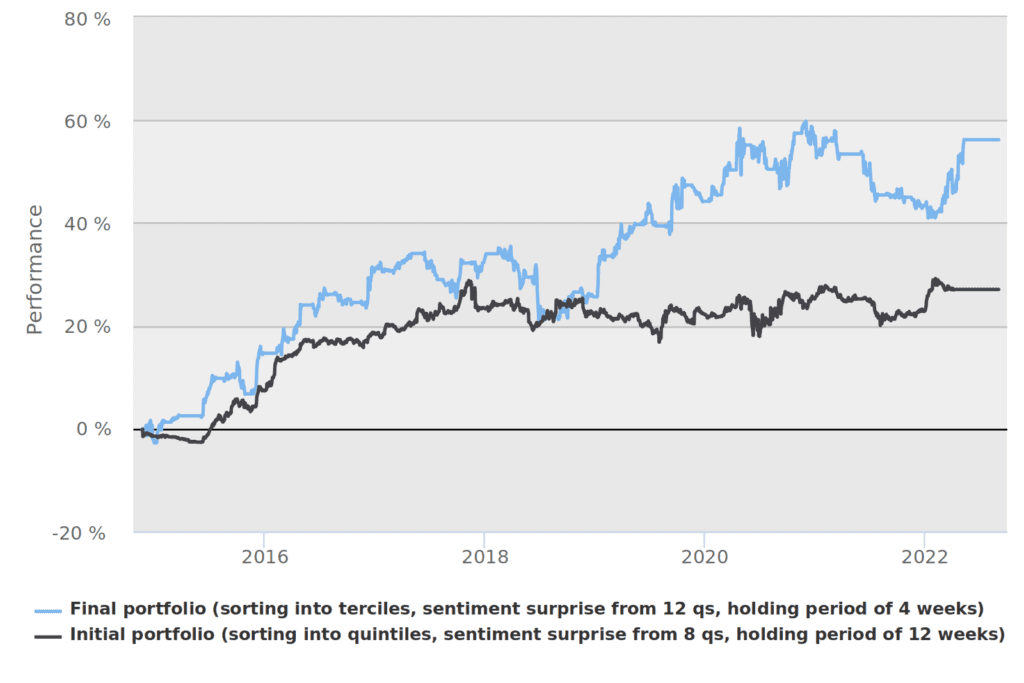
The second round of fine-tuning consisted of amplifying these preliminary findings into the actual final strategy. By shortlisting of most promising strategies, there were favorites selected that we once again tested in Quantconnect. We find that the best results are accrued with sorting into terciles (1/3), having 4 week holding period, and using 12 quarters of previous data taken into account for the calculation of earnings surprise.
We were able to increase the performance of our initial strategy to a compounding annual return of 5.89% with a Sharpe Ratio of 0.76 and a maximal drawdown of -11.81%. But what’s more important is that most of the strategy’s variants were showing positive performance, indicating underlying alpha that can be harvested by using linguistic analysis of earnings announcement calls. We are also confident that even better results can probably be achieved by using the shorter period for reaction on earnings calls (we use the default one week, but data are available on a daily basis) and/or more complex rules or methodology.


Conclusion
This is our final proposal for the strategy with the most balanced parameters. The initial strategy, excluding proposed changes, is still profitable, but the final strategy has clearly outperformed since 2019.
We are aware of survivorship bias in our results, which can be addressed by the introduction of another set of walk-forward rules. The essential problem here is that we are choosing the best variables after the factual testing (a posteriori). Since we removed the worst-performing variable values, we cannot account for their possible performance in the non-overlapping future time window. This forms the basis for the possibility of further testing and increasing the robustness of the overall solution. This kind of further modification can increase the chance of even better prediction of hidden alpha signals. But our main finding holds -> there really seems to be a treasure trove hidden in earnings call transcripts data.
Author:
Cyril Dujava, Junior Quant Analyst, Quantpedia
Are you looking for more strategies to read about? Sign up for our newsletter or visit our Blog or Screener.
Do you want to learn more about Quantpedia Premium service? Check how Quantpedia works, our mission and Premium pricing offer.
Do you want to learn more about Quantpedia Pro service? Check its description, watch videos, review reporting capabilities and visit our pricing offer.
Are you looking for historical data or backtesting platforms? Check our list of Algo Trading Discounts.
Would you like free access to our services? Then, open an account with Lightspeed and enjoy one year of Quantpedia Premium at no cost.
Or follow us on:
Facebook Group, Facebook Page, Twitter, Linkedin, Medium or Youtube
Share onLinkedInTwitterFacebookRefer to a friend


