How to Use Lexical Density of Company Filings
The application of alternative data is currently a strong trend in the investment industry. We, too, analyzed few datasets in the past, be it ESG data, sentiment, or company filings. This article continues the exploration of the alt-data space. This time, we use the research paper by Joenväärä et al., which shows that lexically diverse hedge funds outperform lexically homogeneous as an inspiration for us to analyze various lexical metrics in 10-K & 10-Q reports. Once again, we show that it makes sense to transmit ideas from one research paper to completely different asset class.
Introduction
The invention of the steam engine in 1698 marks the beginning of the first industrial revolution. Since then, we have made significant progress, and it seems we are not slowing down. Some say that Artificial Intelligence (AI) marks the start of the most recent industrial revolution.
Artificial Intelligence became a hot topic in recent years because of its variety of functions, including speech and language recognition. Natural language processing, or NLP for short, is the ability of a program to understand human language. You might ask, how is this useful in the financial sphere. Well, there are numerous research papers (Banker et al., 2021 and Joenväärä et al., 2019) analyzing the connection between investor’s vocabulary and the profitability of their strategies.
Specifically, the research by Joenväärä et al., 2019 inspired us to analyze various lexical metrics in 10-K & 10-Q reports. After adjusting for risk, they found that lexically diverse hedge funds outperform lexically homogeneous hedge funds. Furthermore, they explain that investors react correctly but not fully to the information on fund manager skill embedded in lexical diversity. Their results support the notion that linguistic skills are helpful for investment performance.
Moreover, alternative data is becoming a mainstream topic in investment management and algorithmic trading. For example, the textual analysis of 10-K & 10-Q filings can be used as a profitable part of investment portfolios (Padysak, 2020). All publicly traded companies have to file 10-K & 10-Q reports periodically. These reports consist of relevant information about financial performance. Nowadays, there is a gradual shift from numerical to text-based information, making the reports harder to analyze (Cohen, 2010). Still, the 10-K & 10-Q reports rightfully receive great interest from academics, investors and analysts.
Data
BRAIN is one of the companies that analyze the 10-K & 10-Q reports using NLP. The main objective of The Brain Language Metrics on Company Filings (BLMCF) dataset is to monitor numerous language metrics on 10-Ks and 10-Qs company reports for approximately 6000+ US stocks. The BLMCF dataset consists of two parts. The first part contains the language metrics of the most recent 10-K or 10-Q report for each firm, such as:
- Financial sentiment
- Percentage of words belonging to financial domain classified by language types:
- “Constraining” language
- “Interesting” language
- “Litigious” language
- “Uncertainty” language
- Readability score
- Lexical metrics such as lexical density and richness
- Text statistics such as the report length and the average sentence length
The second part includes the differences between the two most recent 10-Ks or 10-Qs reports of the same period for each company.
This article focuses on the first section of the BLMCF dataset, specifically the Lexical metrics such as lexical richness, lexical density, and specific density.
In simple words, lexical richness says how many unique words are used by the author. The idea is that the more varied vocabulary the author has, the more complex the text is. The lexical richness is measured by the Type-Token Ratio (TTR), which is defined as the number of unique words divided by the total number of words. As a result, the higher the TTR, the higher the lexical complexity.
Secondly, lexical density measures the structure and complexity of human communication in a text. A high lexical density indicates a large amount of information-carrying words, and a low lexical density indicates relatively few information-carrying words. Lexical density is calculated as the number of so-called lexical tokens (verbs, nouns, adjectives, verbs except auxiliary verbs) divided by the total number of tokens.
Lastly, specific density measures how dense the report’s language is from a financial point of view. BRAIN uses a dictionary of financially relevant words as a reference. Specific density is then calculated as the ratio between the number of dictionary words present in the report divided by the total number of words.
Analysis
This article analyses how lexical richness, lexical density, specific density, and their combinations affect the strategy returns. We created two investment universes, the first one contains the top 500 stocks by market capitalization from NYSE, NASDAQ and AMEX exchanges, and the second contains the top 3000 stocks. The first investment universe is highly liquid and contains only large-cap stocks. The second investment universe is made of large-cap, mid-cap and small-cap stocks. Our process for building an investment factor portfolio is to sort the stocks into deciles (quintiles) and create a long-short equity factor strategy (long top decile, short bottom decile). All the backtests are done on the Quantconnect platform, and the data is integrated into the platform itself. Additionally, it can be found here: https://www.quantconnect.com/datasets/brain-language-metrics-company-filings.
Suggested factor strategies are rebalanced on a monthly basis, and we use real historical bid-ask spreads (slippage). Trading costs (transaction fees) are omitted; however, they do not have a high impact on the resultant strategy, as the usual asset manager can achieve trading costs at the range of 1-2bps per trade.
We suspect lexical density and specific density to have the greatest effect on the return. This would mean that the more information-carrying words and the more finance-related word the report has, the better the company performs.
How does the resultant factor strategy look like?
But firstly, we analyzed all three lexical metrics by themselves. Let’s take a look at the strategy based purely on lexical richness. The first figure shows the results for the smaller investment universe containing 500 stocks. As we can see from the chart, the performance is not so good. The trend is growing only in the last few years. The Sharpe ratio of this strategy is -0.053.
However, when we expand the investment universe to 3000 stocks, the performance improves. Thus, even though the performance is not perfect, it is much better than the previous scenario. Moreover, the Sharpe ratio grows from -0.053 to 0.21.
Now let’s take a look at the second lexical metric: lexical density. We analyze this strategy on the smaller investment universe containing 500 stocks. As we can see, the performance’s trend is growing since 2012. The negative performance during the first few years can be explained by the size and accuracy of the BRAIN dataset in the early years. The Sharpe ratio of this strategy is 0.362.
The third strategy we analyze is based on the specific density. Just like before, we analyze this strategy on the smaller investment universe containing 500 stocks. As we can see, the trend of cumulative performance is growing almost since the beginning. This strategy is experiencing significant drawdowns only in recent years, which can be explained by the COVID-19 pandemic. The Sharpe ratio of this strategy is 0.416.
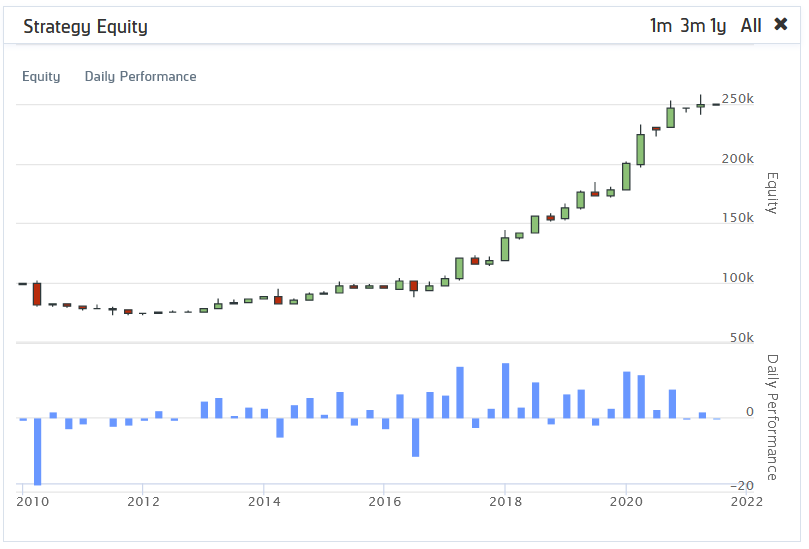
Overall, we argue that the lexical richness has a far weaker effect on the return than the lexical density or specific density. So, in the next section, we looked at the combination of lexical density and specific density. We analyzed this strategy on the investment universe containing 500 stocks. As we can see, the cumulative performance of this strategy is increasing during almost the whole period. The Sharpe ratio of the strategy which combines the two metrics is 0.688.
Altogether, the combined lexical & specific density long-short factor strategy offers really promising results. The only period with slightly negative performance is at the beginning of the sample in 2012. We can speculate and try to explain this by the fact that the BRAIN dataset was new. Often in alternative datasets, the beginning of the time series is more problematic and less covered than later years, although we do not have any specific evidence of this for the BRAIN dataset.
What’s the fundamental driver of this factor strategy? From what we have found, it seems that, on average, companies with a more “dense” style of reporting tend to outperform. It could be caused because the 10K and 10Q reports would be less uncertain and more “matter of fact” and would be rewarded by higher inflow from investors. It would also mean that strategy is connected to “accrual-based” strategies, where companies with less opaque financial statements outperform those with less transparent accounting practices.
Authors:
Daniela Hanicová, Quant Analyst, Quantpedia.com
Filip Kalus, IT Developer/ QuantConnect code builder, Quantpedia.com
Radovan Vojtko, CEO & Head of Resarch, Quantpedia.com
Are you looking for more strategies to read about? Sign up for our newsletter or visit our Blog or Screener.
Do you want to learn more about Quantpedia Premium service? Check how Quantpedia works, our mission and Premium pricing offer.
Do you want to learn more about Quantpedia Pro service? Check its description, watch videos, review reporting capabilities and visit our pricing offer.
Are you looking for historical data or backtesting platforms? Check our list of Algo Trading Discounts.
Would you like free access to our services? Then, open an account with Lightspeed and enjoy one year of Quantpedia Premium at no cost.
Or follow us on:
Facebook Group, Facebook Page, Twitter, Linkedin, Medium or Youtube
Share onLinkedInTwitterFacebookRefer to a friend


