Introduction to Clustering Methods In Portfolio Management – Part 2
October’s is coming, and we continue our short series of introductory articles about portfolio clustering methods we will soon use in our new Quantpedia Pro report. In the previous blog, we introduced three clustering methods and discussed the pros and cons of each one. Additionally, we showed a few examples of clustering, and we presented various methods for picking an optimal number of clusters.
This section demonstrates the Partitioning Around Medoids (PAM) – a centroid-based clustering method, Hierarchical Clustering, which uses machine learning and Gaussian Mixture Model based on probability distribution and applies all three methods to an investment portfolio that consists of eight liquid ETFs.
Analysis
To demonstrate the abovementioned methods in real (investment) life, we decided to pick eight assets: four equities (SPY–SPDR S&P 500 ETF Trust, VGK–Vanguard FTSE Europe Index Fund ETF Shares, EEM–iShares MSCI Emerging Markets ETF, VPL–Vanguard FTSE Pacific Index Fund ETF Shares), two alternatives (DBC–Invesco DB Commodity Index Tracking Fund, GLD–SPDR Gold Shares) and two bond ETFs (IEF–iShares 7-10 Year Treasury Bond, BNDX–Vanguard Total International Bond Index Fund ETF Shares).
Of course, it would be ideal to use significantly more assets when applying clustering methods. However, to describe the process in detail and make the results clear, we stuck to eight assets. Furthermore, we use weekly returns over a one-year period (27/05/2020 – 24/05/2021) as our parameters.
Tackling the big data
Before we get to the clustering, we need to discuss the data itself. Firstly, some methods use raw data such as unadjusted weekly returns, and others require the data to be normalized (i.e. to have a zero mean and standard deviation equal to one). Both approaches are equally valid. One has to decide based on the nature of their experiment, which approach is more suitable and delivers more realistic results.
Secondly, if, like in our case, the number of dimensions (~50 weekly returns) is greater than the number of assets (8 assets), we can either work with the data as it is, or we can reduce the number of dimensions in the first place. The most widely used methods for reducing the number of dimensions are PCA (Principal Component Analysis) and MDS (Multi-Dimensional Scaling).
We won’t go into further details about MDS or PCA today. Instead, we will delve deeper into the topic in one of our future reports. For the sake of this report, we will use the techniques mentioned above for the following:
- PAM: PCA to just display our 50-dimensional data in a 2D space, clustering is applied to raw data, data is not normalized
- AGNES: clustering is applied to raw data, data is normalized
- GMM: PCA reduces the 50-dimensional data to 2 dimensions; clustering is applied to the first 2 principal components, data is not normalized further
Clustering the ETFs
PAM
The first method we applied is Partitioning Around Medoids. As we already mentioned, the first step one has to take is to decide on the number of clusters. To make this decision, we used the silhouette method. We calculated silhouettes for scenarios with 2 – 7 clusters. In the table below, we present the results of the silhouette method.
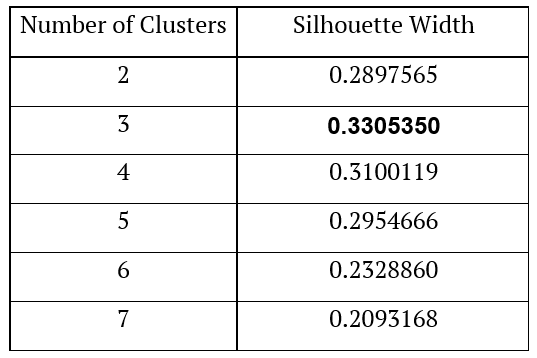
As we can see, the method of calculating the silhouette width suggests using three clusters.
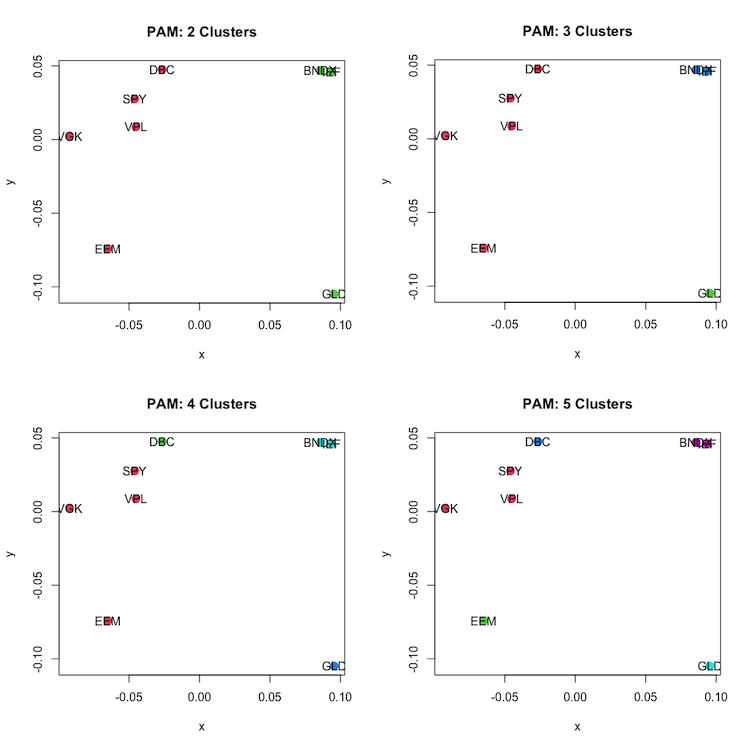
The following figures show the assets sorted into two, three, four and five clusters. In the example of two clusters, we have DBC, SPY, VPL, VGK and EEM (all four equities and one risky asset – commodities) in one cluster and GLD, BNDX and IEF (gold and bonds) in the second cluster.
In the example with three clusters, we have DBC, SPY, VPL, VGK and EEM (all four equities and one risky asset – commodities) in one cluster, GLD (gold) in the second – single cluster, and the last cluster contains BNDX and IEF (all bonds).
In the example of four clusters, we get two one-object clusters: DBC (commodities) and GLD (gold), one two-object cluster containing BNDX and IEF (all bonds) and one four-object cluster containing EEM, VGK, SPY and VPL (all equities).
In the example of five clusters, we get three one-object clusters: DBC (commodities), EEM (emerging equity) and GLD (gold), one two-object cluster containing BNDX and IEF (all bonds) and one three-object cluster containing VGK, SPY and VPL (three equities).
All of these classifications make economic sense in some way. Thus, we may conclude that PAM clustering has done its job well this time.
AGNES and DIANA
The second method we applied is Hierarchical Clustering. There are two main approaches to Hierarchical clustering: agglomerative (AGNES) and divisive (DIANA). Additionally, there are multiple ways of computing the actual tree created by the agglomerative approach based on how we measure the distance between objects. These different calculation methods include Average linkage, Single linkage, Complete linkage, Ward linkage or even different ones. The following figures show dendrograms we created for all linkage methods mentioned above.
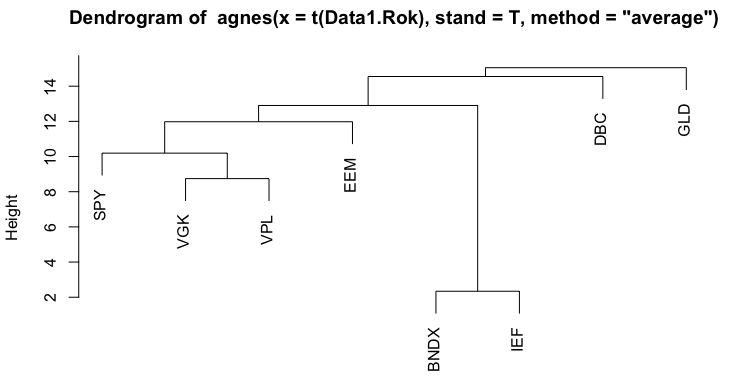
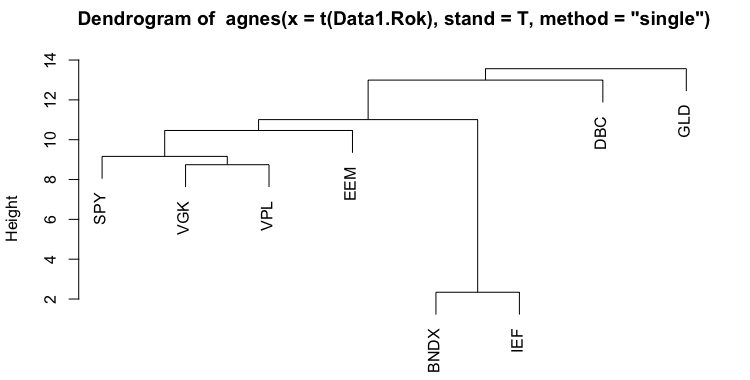
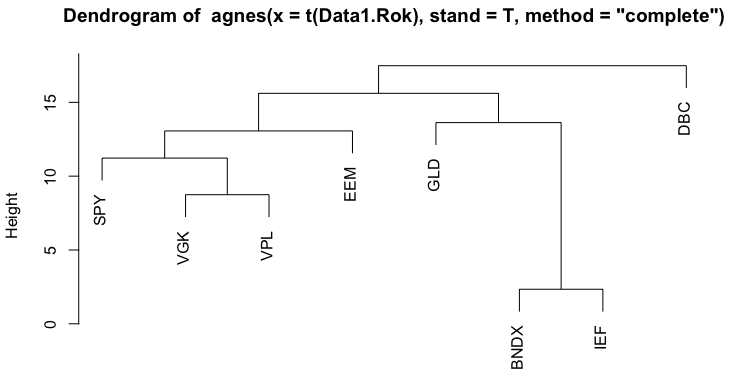
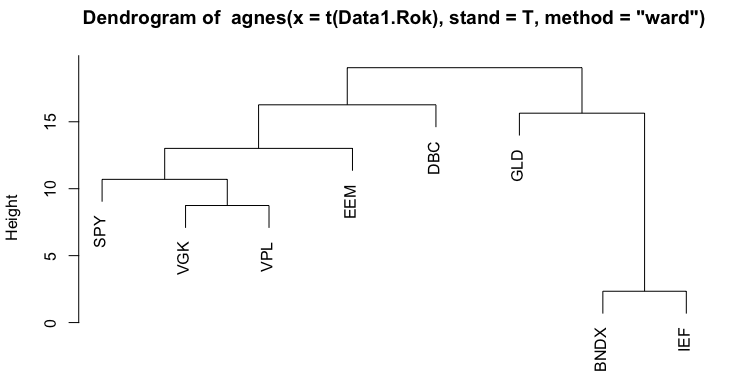
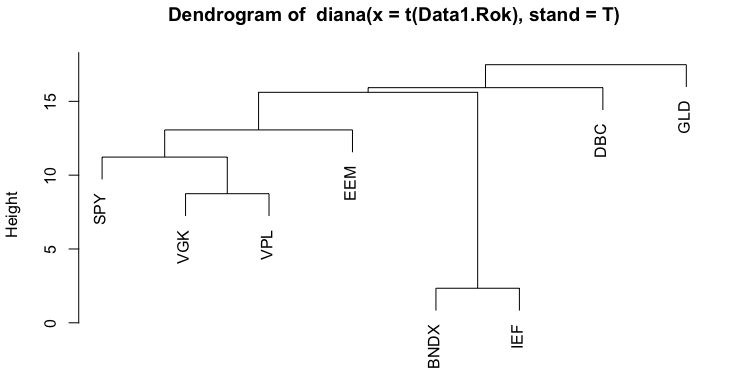
As we can see, most of the trees are very similar, but the heights at which their branches grow are different. The next step after creating dendrograms is to create clusters. As was the case with PAM, we decided on the number of clusters based on the silhouettes. We cut the tree at different heights and calculate the silhouette. The next table shows the results of the silhouette method for the first dendrogram (Agglomerative Clustering – Average Linkage).
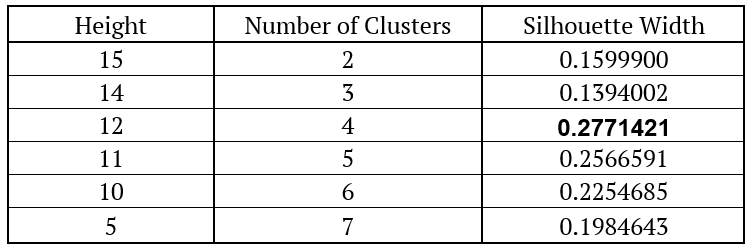
As we can see, we get the highest silhouette for the height of 12, which means that using this method, we end up with four clusters. The GLD ETF (gold) is in the first cluster, DBC ETF (commodities) is in the second cluster. The third cluster contains SPY, VGK, VPL and EEM (all four equities) and the last cluster contains BNDX and IEF (both bonds).
GMM
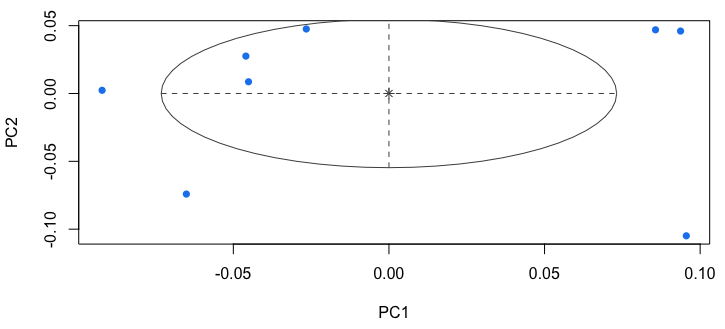
The last method we analyzed is the Gaussian Mixture Model. As mentioned earlier, for this method to work, we firstly have to reduce the dimension of the data. We do this by selecting first two principal components by PCA. This method then normalizes the data before clustering and chooses the number of clusters by itself. The following figure shows that all of the objects are sorted into one cluster.
Conclusion
This blog post shows a real (investment) life application of three clustering methods. Because each method results in a different outcome in many cases, it is hard to say which one is the best. So how can we select the most suitable clustering method for our portfolio? It would be better to create a strategy based on each clustering method and compare the performance characteristics of such strategies. So the next blog will examine precisely this problem. In a couple of days, we will publish the third and last blog from the clustering series, which will centre around clustering-based trading strategies.
Author:
Daniela Hanicova, Quant Analyst, Quantpedia
Are you looking for more strategies to read about? Sign up for our newsletter or visit our Blog or Screener.
Do you want to learn more about Quantpedia Premium service? Check how Quantpedia works, our mission and Premium pricing offer.
Do you want to learn more about Quantpedia Pro service? Check its description, watch videos, review reporting capabilities and visit our pricing offer.
Do you want algorithmic access to the full Quantpedia database via the API? Subscribe to Quantpedia Pro, ask for an API key, and explore the in/out-of-sample statistics, source academic papers, and code snippets — ideal for quantitative research, systematic trading workflows, and AI model training.
Are you looking for historical data or backtesting platforms? Check our list of Algo Trading Discounts.
Or follow us on:
Facebook Group, Facebook Page, Telegram, Twitter, Linkedin, Medium or Youtube
Share onLinkedInTwitterFacebookRefer to a friend


