Lottery Effect in ETFs Across Several Asset Classes
Indisputably, we are witnesses of an ETF mega boom. From passive to active ETFs, their numbers seem to be ever-increasing. Since these exchange-traded funds can be excellent (accessible, transparent, liquid) instruments, it is a great necessity to examine their possible usage in active and systematic trading or investing. Therefore, the short research critically assesses the possibility of using ETFs in the Skewness Trading Strategy.
Introduction
Lottery tickets have meager prices relative to the highest potential payoff; they have low negative expected returns; their payoffs are very risky (i.e., the prize distribution has high variance); and, most importantly, they have a tiny probability of a huge reward (i.e., they have positively skewed payoffs). Overall, for a low cost, lottery tickets offer a slight chance of a huge reward and a significant probability of a little loss, where the probabilities of winning and losing are fixed and known in advance. Even though any particular asset is not likely to possess the extreme characteristics of lotteries, mainly the considerable reward to cost ratio, some assets share these features qualitatively. To identify these assets that can be perceived as lotteries, one can consider asset-specific skewness as a measure. Agents, in general, are likely to deem the assets with high asset-specific skewness more attractive. Kumar (2009) proposed that the investors perceive low-priced stocks with high idiosyncratic volatility and high idiosyncratic skewness as lotteries. The study suggests that investors are likely to pay for a small probability to win an enormous payoff.
The skewness effect has been identified across multiple asset classes before – namely commodities, currencies, or equities. Amaya et al. (2015) analyzed intraday equity returns and found that the skewness is a negative predictor of the following week’s return. Fernandez-Perez et al. (2018) have identified a similar effect in commodity futures, where skewness is also a negative predictor. Skewness as a negative predictor was also identified by Zaremba and Nowak (2015) in an extensive sample of 78 country indices. Vojtko and Lievaj (2020), who analyzed currencies, equities (country indices), and bonds, also provide skewness-related findings. While bonds and currencies seem to relate to the sizeable skewness effect consistent with the other literature, the investment universe of equities is much smaller than that of Zaremba and Nowak (2015), and the effect seems insignificant.
Our motivation for research stems from the fact that the anomalies in the financial market tend to repeat in multiple assets classes. Hence the lottery-like payoff resulting from the skewness effect could be present in exchange-traded funds as well. For example, commodity ETFs track the underlying commodities, and if the skewness effect is present in individual commodities, the effect should also exist in commodity ETFs.
Furthermore, according to the previous research, investors should be the “lottery ticket issuer” instead of playing the lottery. In other words, if the skewness effect holds, they should prefer going long on ETFs without lottery-like characteristics (ETFs with low skewness) and short on ETFs with lottery-like characteristics (ETFs with high skewness). The critical question is whether this lottery effect also holds in ETFs. We examine the skewness effect across various categories: country ETFs, commodity ETFs and global or US sector ETFs. The skewness anomaly is examined for two lookback periods – shorter one-month skewness and long 12-months skewness. The 12-months skewness coincides with the skewness in commodity futures of Fernandez-Perez et al. (2018). The one-month skewness is more dynamic and can be compared to another common lottery effect – the MAX effect of Bali et al. (2009), calculated as the maximal daily return over the previous month. Although the MAX effect was originally found in individual stocks, there is a possibility that it can also be found in ETFs.
Recently, Yahoo Finance discontinued free end-of-day data downloads. As a result, we recommend sourcing data from our preferred provider, EODHD.com – the sponsor of our blog. EODHD offers seamless access to +30 years of historical prices and fundamental data for stocks, ETFs, forex, and cryptocurrencies across 60+ exchanges, available via API or no-code add-ons for Excel and Google Sheets. As a special offer, our blog readers can enjoy an exclusive 30% discount on premium EODHD plans.
Methodology
The analysis of the skewness effect is performed through portfolio sorts. Each month, skewness is calculated from daily returns over the past month for the short one-month or over the past twelve months for the long twelve-month skewness. As a next step, we sort ETFs into quintiles (quartiles). To conclude our analysis, we examine the strategy of going long on the quintiles (quartiles) of ETFs with the lowest skewness and going short on the quintiles (quartiles) of ETFs with the highest skewness. The portfolios are rebalanced each month and equally weighted.
Analysis – one-month skewness
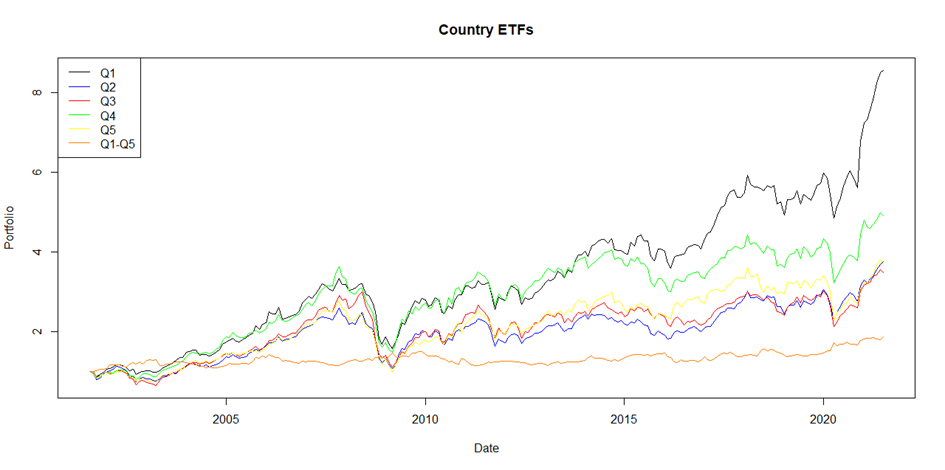
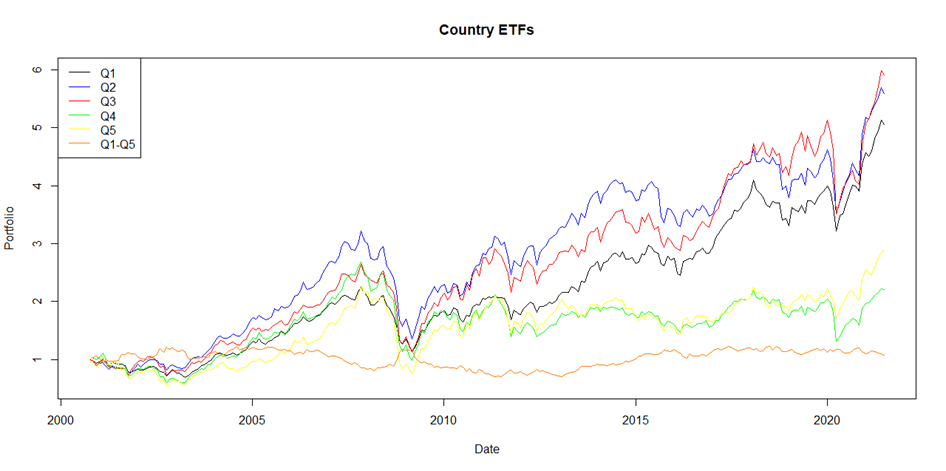
Country Exchange-traded Funds
The investment universe consists of 19 exchange-traded funds: SPY, EWL, EWQ, EWU, EWD, EWG, EWN, EWI, EWO, EWK, EWJ, EWW, EWM, EWH, EWS, EWA, EWZ, EWT, and EWY. The backtesting period spans from 01.8.2000 to 31.07.2021.
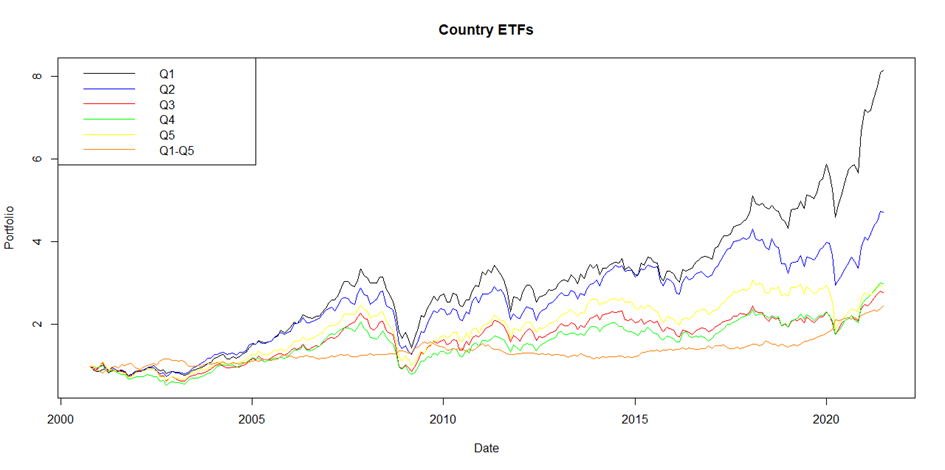
For the Country ETFs, we have identified similar results as Zaremba and Nowak (2015). The lowest skewness assets outperform the highest skewness assets, and the anomaly seems to be alive even if the ETFs are used as trading instruments. Additionally, the skewness effect appears to be economically significant and has reasonably low volatility (under 10%).
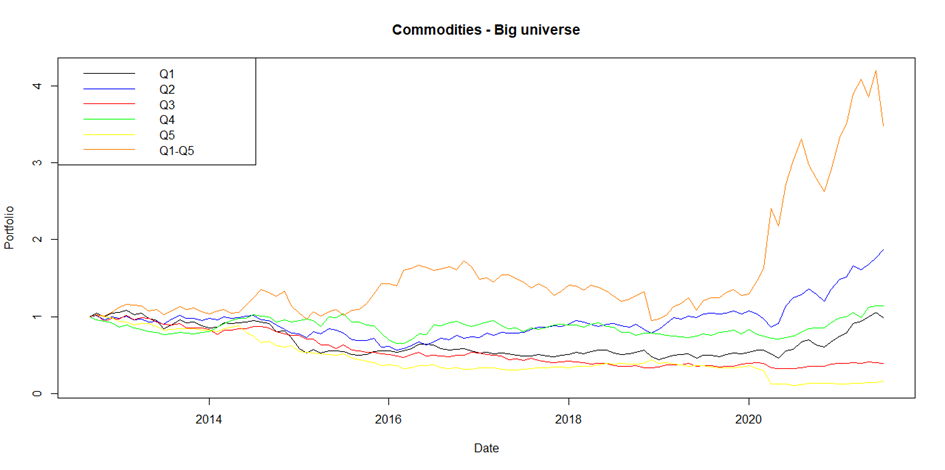
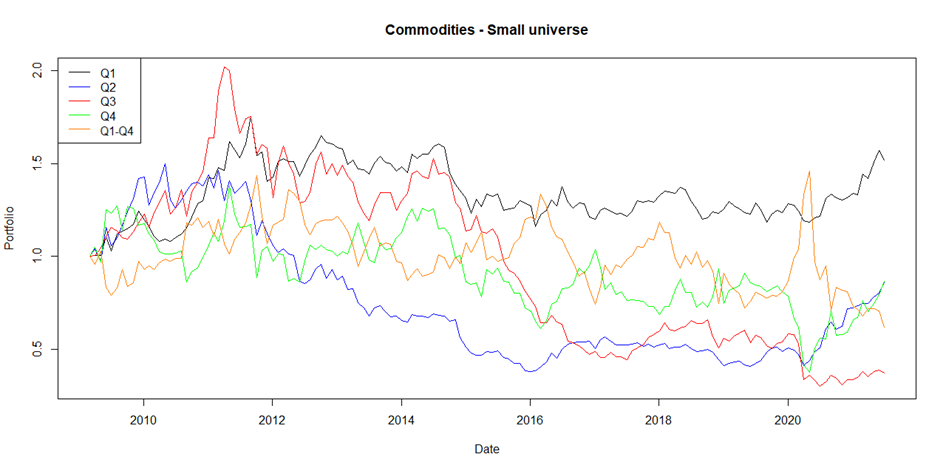
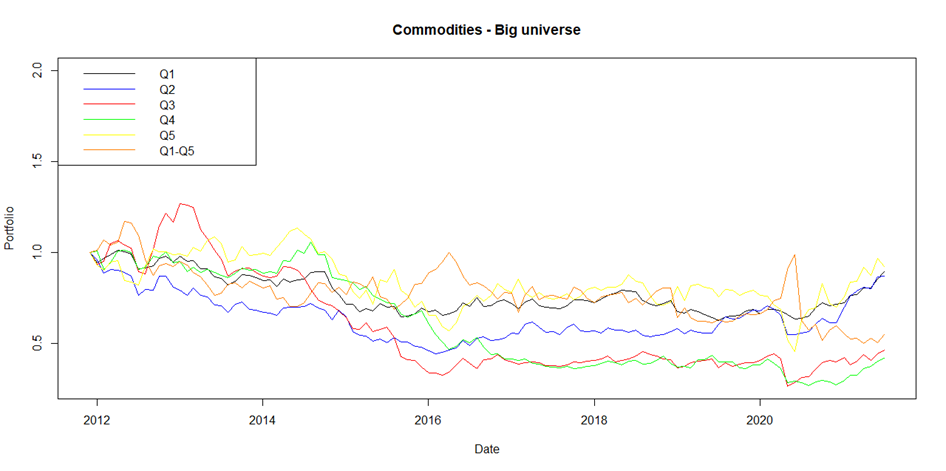
Commodity Exchange-traded Funds
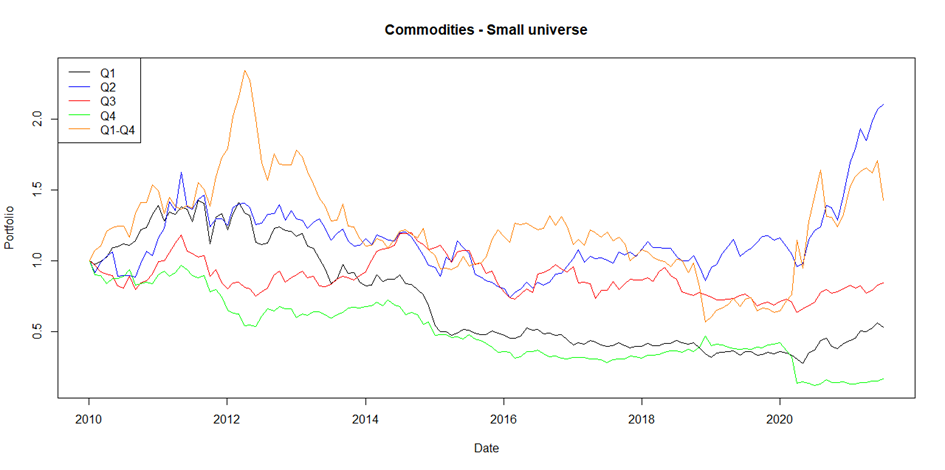
For commodities, we analyze two investment universes. The first universe is smaller but offers a more extended sample. The second is more extensive regarding the number of instruments, but due to inception dates, the sample is shorter.
The first universe consists of 8 commodities ETFs: gold, silver, oil, natural gas, base metals, agriculture, cocoa, and gasoline (GLD, SLV, USO, UNG, DBB, DBA, NIB, UGA). The backtesting period spans from 01.07.2008 to 31.07.2021.
The second one consists of 14 commodities ETFs, namely gold, silver, oil, brent, natural gas, platinum, palladium, gasoline, base metals, corn, cane, soybean, wheat, and cocoa (GLD, SLV, USO, BNO, UNG, PPLT, PALL, UGA, DBB, CORN, CANE, SOYB, WEAT, NIB). The backtesting period spans from 01.10.2011 to 31.07.2021.
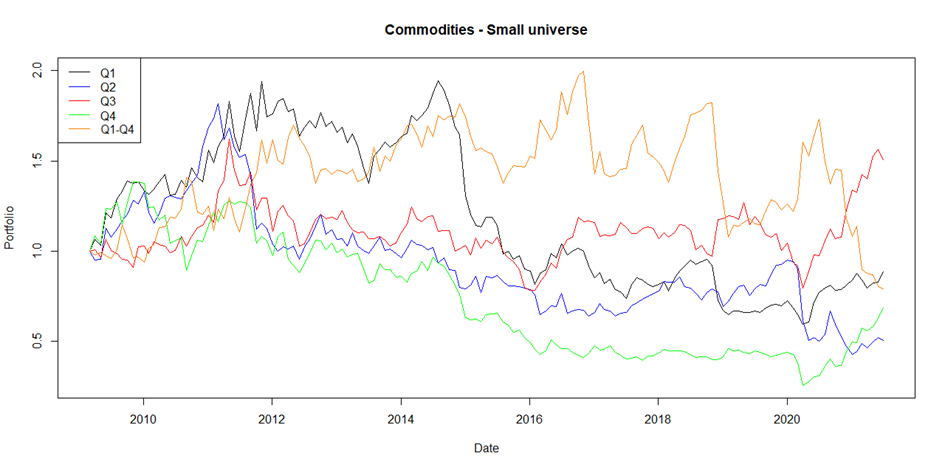
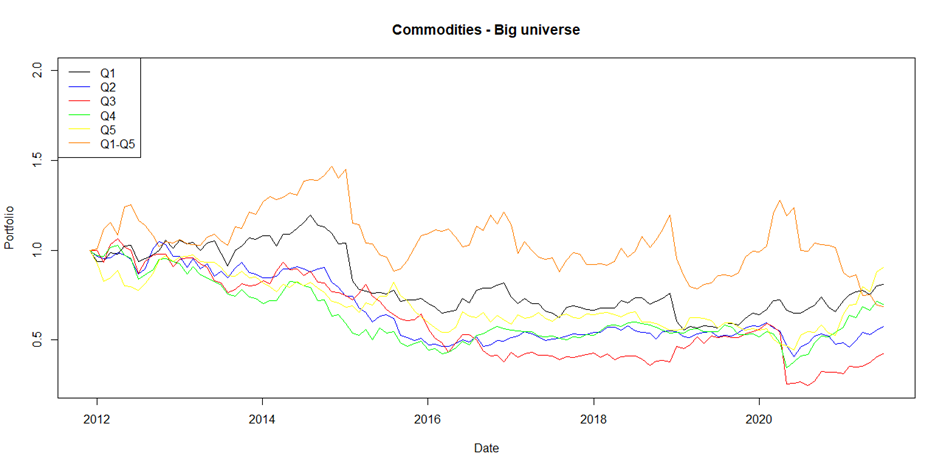
Commodities are widely recognized to follow long bull or bear runs, which is the main reason why a passive holding of commodities is rarely advised. Instead, the commodities are commonly used in active strategies, but the commodity ETFs do not seem to be the best investment universe for the skewness effect.
Both samples primarily include a major commodity bear run, and although the lowest skewness ETFs tend to decrease the least, the highest skewness ETFs can bounce back strongly and erode the returns. Overall, both strategies are unprofitable and volatile. There certainly are periods where the skewness effect in commodities can benefit the investor, but undoubtedly it is not an all-weather strategy.
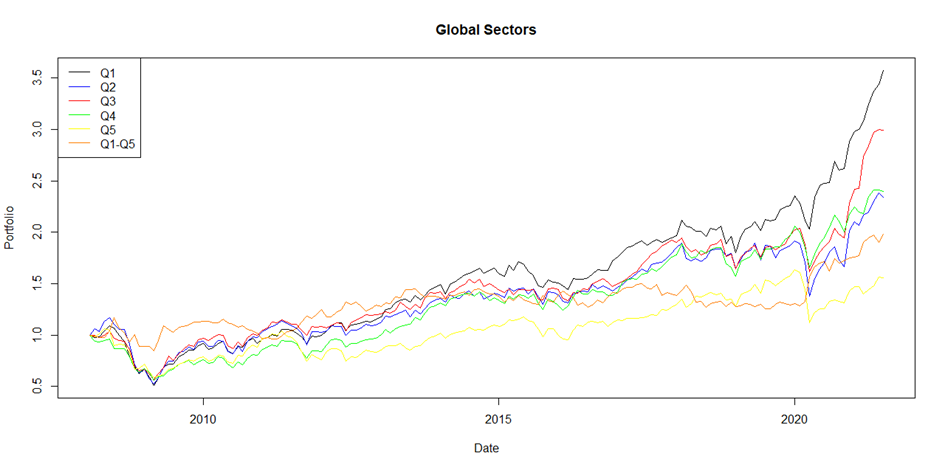
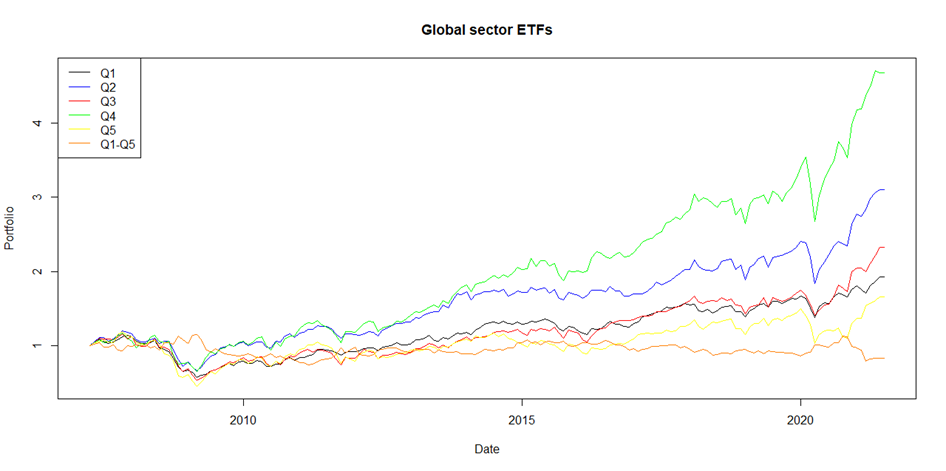
Global Sector Exchange-traded Funds
The investment universe consists of 10 exchange-traded funds: IXN, IXP, IXJ, RXI, MXI, EXI, KXI, JXI, IXG, IXC. The backtesting period spans from 01.02.2007 to 31.07.2021.
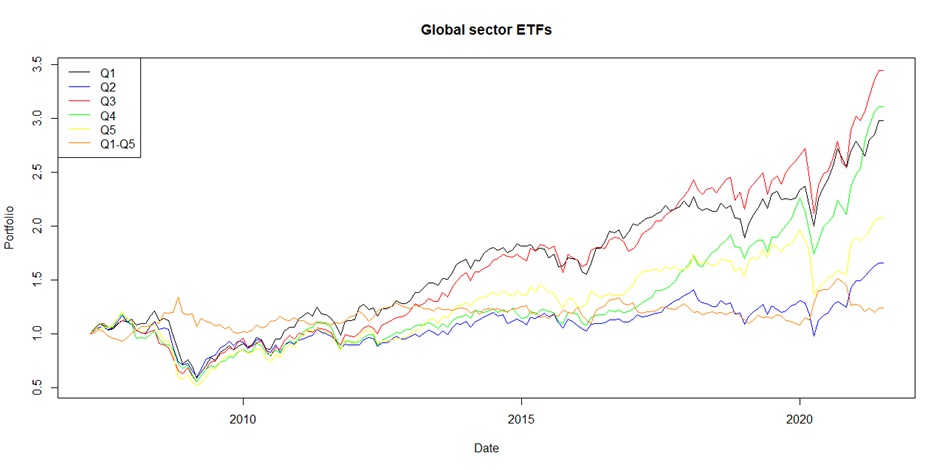
Although the skewness spread portfolio (Q1-Q5) appears to be slightly profitable, the skewness effect seems to be relatively weak. On average, the highest skewness quintile has the lowest returns, but the difference is minor. Moreover, the lowest skewness quintile is almost on par with the middle quintile. On the contrary to expectations about significant anomaly, the performance does not continuously decrease from the lowest to the highest quintile.
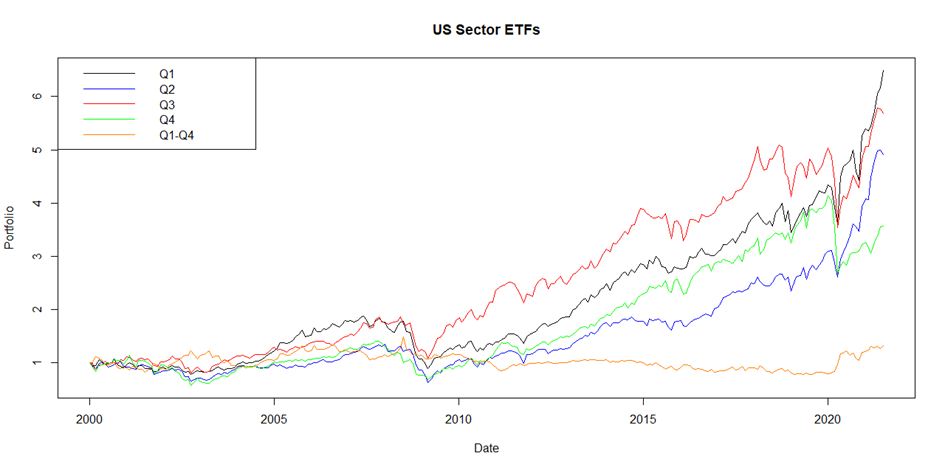
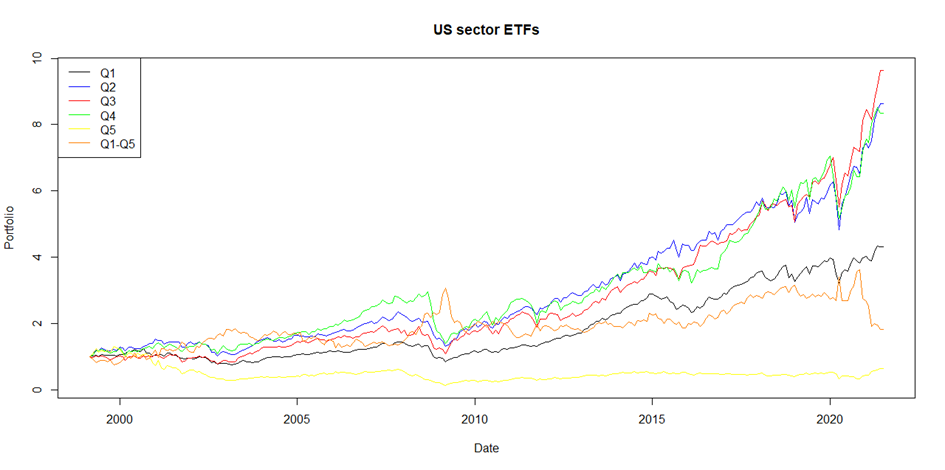
The US Sector Exchange-traded Funds
The investment universe consists of 9 exchange-traded funds: XLK, XLY, XLV, XLB, XLP, XLI, XLU, XLF, XLE. The backtesting period spans from 1.1.1999 to 31.07.2021.
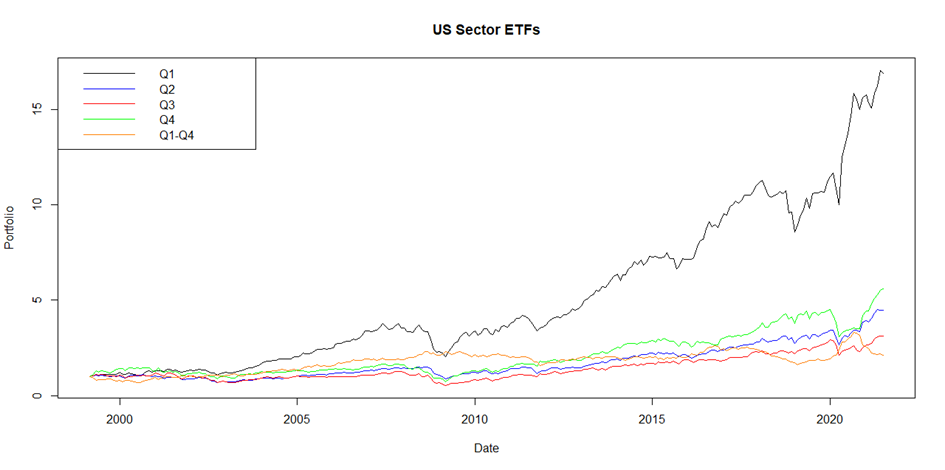
Based on the sample, we can conclude that US sector ETFs are similar to the Country ETFs. The evidence shows that the least skewed ETFs consistently outperform more skewed ones.
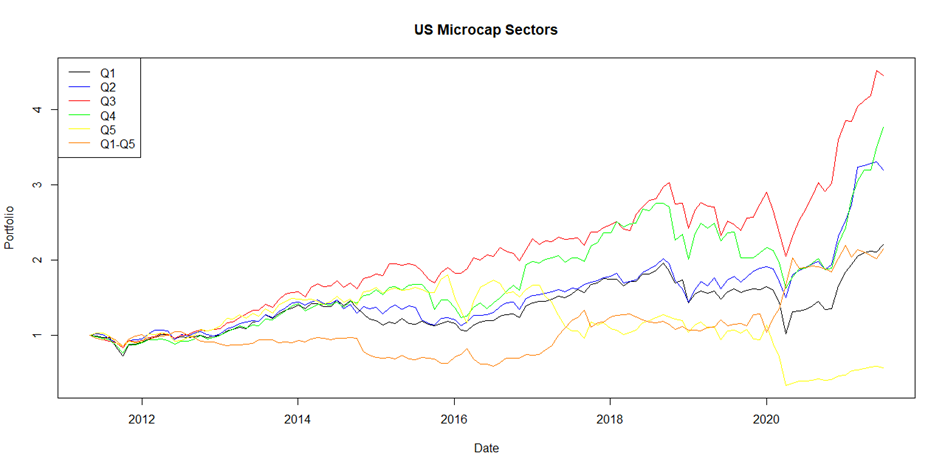
The US Microcap Sector Exchange-traded Funds
The investment universe consists of 9 exchange-traded funds: PSCD, PSCH, PSCT, PSCC, PSCM, PSCI, PSCU, PSCF, PSCE. The backtesting period spans from 01.05.2010 to 31.07.2021.
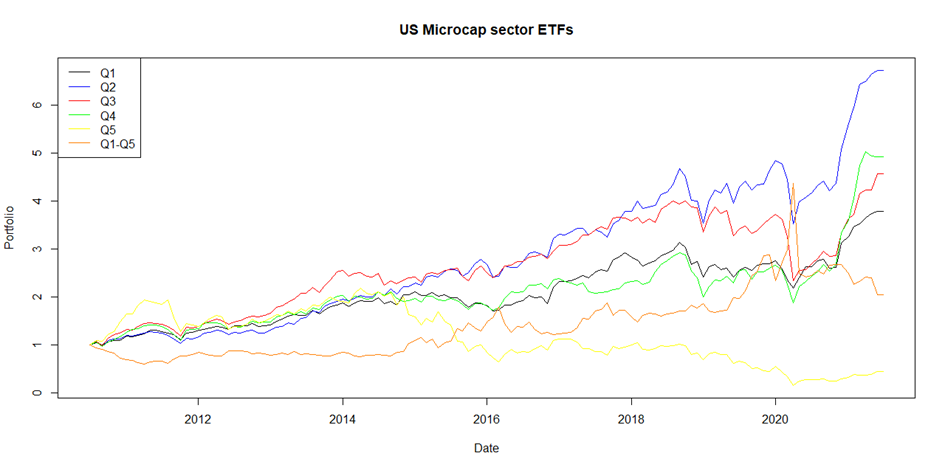
The US microcap sector ETFs share many similarities with the two other sectors universes – the skewness is not consistently priced as it would be expected based on the other literature. The “middle“ (non-extreme) quintiles deliver higher returns than both extreme quintiles – the lowest and the highest skewness ETFs. The only difference is that the highest skewness ETFs significantly underperform. Therefore, the short side can deliver a reasonable return, even though the effect is insignificant.
| 1 month rebalancing | Country ETF | US microcap ETF | US sector ETF | Global Sector ETF | Commodity ETF – small investments universe | Commodity ETF – big investments universe |
| Annualized return | 4.42 | 6.65 | 3.41 | 1.52 | -1.88 | -3.85 |
| Annualized volatility | 9.97 | 32.2 | 14.95 | 11.99 | 24.61 | 22 |
| Maximal drawdown | -25.55 | -53.29 | -37.97 | -24.79 | -60.44 | -53.36 |
Analysis – twelve-months skewness
The sample period for the longer skewness effect is the same as in the shorter skewness. The only difference is that the out-of-sample test is shorter since more data is required to construct the signals.
| 1 month rebalancing | Country ETF | US microcap ETF | US sector ETF | Global Sector ETF | Commodity ETF – small investments universe | Commodity ETF – big investments universe |
| Annualized return | 3.18 | 7.76 | 1.3 | 5.2 | 3.12 | 15.02 |
| Annualized volatility | 10.94 | 23.71 | 15.35 | 13.68 | 31.63 | 30.08 |
| Maximal drawdown | -23.33 | -43.9 | -47.75 | -27.47 | -75.8 | -44.87 |
In terms of positive overall performance, the results for the longer skewness anomaly are, on average, more promising. Except of Country ETFs and US sector ETFs, all strategies are more profitable. For the bigger commodity ETFs universe, the strategy becomes profitable, which is a result comparable to the research made in the futures. On the other hand, the smaller universe seems to be undiversified, and the skewness effect seems to be insignificant and weak. The most sizeable results are in Countries, and Global sectors, where the lowest skewness ETFs outperform, and the highest skewness ETFs underperform. Although other investment universes show positive performance, the least skewed ETFs do not seem to outperform other quintiles (quartiles) consistently. These results do not give us the confidence to say that the skewness is priced in these universes as it would be expected based on the other literature.
MAX effect
Skewness is commonly described as the lottery effect since the theory expects that investors overpay for high skewness assets that have a small probability of high returns. Consequently, the high skewness assets should be overvalued. Another common lottery measure is the MAX effect of Bali et al. (2009), calculated as the maximum daily return over the previous month. Even though the MAX effect was originally found in stocks, and it is a widely recognized paper for the lottery effect in stocks, it is common that the anomalies firstly identified in one asset class are identified also in other asset classes. Furthermore, the skewness and MAX effects should be related. From the mathematical point of view, a high daily return can skew to the distribution to the right, causing a higher realized skewness. From another point of a view, the maximal daily return is more intuitive compared to the calculation of higher moments required in the skewness estimation.
Therefore, we employ alternative lottery-effect MAX measures to investigate further whether the lottery effect is present in ETFs. The alternative strategies consist of shorting the quintile with the highest maximal daily return and going long the quintile with the lowest maximal daily returns over the previous month. The holding period is one month and the portfolios are rebalanced monthly. ETF investment universes are the same as those mentioned in the previous sections.

| 1 month rebalancing | Country ETF | US microcap ETF | US sector ETF | Sector ETF | Commodity ETF – small investments universe | Commodity ETF – big investments universe |
| Annualized return | 0.33 | 6.65 | 2.72 | -1.28 | -3.79 | -5.98 |
| Annualized volatility | 12.6 | 32.2 | 23.6 | 13.9 | 29.32 | 24.82 |
| Maximal drawdown | -42.56 | -53.23 | -49.3 | -35.38 | -57.6 | -57.15 |
The results show that the MAX effect is not priced in ETFs. Although the performance is positive for certain investment universes, there is not a clear pattern as the one identified for stocks. The lowest MAX ETFs do not consistently outperform high MAX ETFs. Overall, the results are comparable to those of the skewness effect. The only exception is the universe of Country ETFs, for which we have identified the skewness effect, but the evidence for the MAX effect is weak.
Conclusion
This research aimed to examine the widely recognized skewness effect and the possibility of using ETFs as trading instruments. The skewness was found in many asset classes, and the ETFs could be utilized as trading instruments to exploit this effect. Compared to other investment vehicles, ETFs are often more accessible to trade.
We examined two skewness anomalies – the short one-month and the long twelve-months skewness across two samples of commodity ETFs, sector ETFs, and country ETFs.
For the shorter version, the most promising results were identified in Country and US Sector ETFs, while the other universes do not seem to exhibit the effect with a similar magnitude or even do not seem to exhibit the effect at all. The long skewness effect is most significant in Country ETFs and Global Sectors, where we observe a clear outperformance of the least skewed ETFs over the most skewed ETFs. One can observe economically significant results in other universes too – for example, the more extensive commodity universe has the highest return. Unfortunately, the skewness return pattern is not that clear as the other literature suggests – the least skewed ETFs portfolio does not necessarily outperform other portfolios.
Since the skewness effect is often considered to be a lottery anomaly, we have also examined the MAX effect of Bali et al. (2011). Compared to the individual stocks, there is little convincing evidence of the presence in the examined ETF universes. In commodities, the MAX effect is comparable to the short-term skewness effect, which does not work, so it seems that commodity ETFs need a signal formed on the more extended lookback period. For equity ETFs – Country or Sector ETFs, it appears that once the stocks are aggregated into indices (large groups), the idiosyncratic lottery effect disappears, and systematic does not exist.
To sum it up, there is little evidence for short-term skewness or MAX effects in ETFs. More promising results can be found when the signal formation period is prolonged. The 12-months skewness anomaly shows some results that are in line with other skewness-related literature. Overall, the research might be vital to the literature by identifying the universes where the lottery effects are (not) present. It is of great importance to point also to the negative results, especially in modern times in the financial literature, where we have to face the factor zoo, which once rigorously tested (or in the out-of-sample period) become insignificant.
Author: Viktoria Komornikova (Edited by Matus Padysak)
Are you looking for more strategies to read about? Sign up for our newsletter or visit our Blog or Screener.
Do you want to learn more about Quantpedia Premium service? Check how Quantpedia works, our mission and Premium pricing offer.
Do you want to learn more about Quantpedia Pro service? Check its description, watch videos, review reporting capabilities and visit our pricing offer.
Or follow us on:
Facebook Group, Facebook Page, Twitter, Linkedin, Medium or Youtube
References
Amaya, Diego, Christoffersen, Peter, Jacobs, Kris and Vasquez, Aurelio, (2015), Does realized skewness predict the cross-section of equity returns?, Journal of Financial Economics, 118, issue 1, p. 135-167.
Baltas, Nick and Baltas, Nick and Salinas, Gabriel, Cross-Asset Skew (December 16, 2019). Available at SSRN: https://ssrn.com/abstract=3505422 or http://dx.doi.org/10.2139/ssrn.3505422
Fernandez-Perez, Adrian, Frijns, Bart, Fuertes, Ana-Maria and Miffre, Joelle, (2018), The skewness of commodity futures returns, Journal of Banking & Finance, 86, issue C, p. 143-158.
Kumar, Alok: Who Gambles in the Stock Market? (July 16, 2009). Th Journal of Finance, August 2009, Vol 64, Issue 4, p. 1889 – 1933. Available at: https://onlinelibrary.wiley.com/doi/epdf/10.1111/j.1540-6261.2009.01483.x
Turan G. Bali, Nusret Cakici, Robert F. Whitelaw, Maxing out: Stocks as lotteries and the cross-section of expected returns, Journal of Financial Economics, Volume 99, Issue 2, 2011, Pages 427-446, ISSN 0304-405X, https://doi.org/10.1016/j.jfineco.2010.08.014.
Vojtko, Radovan and Lievaj, Marek, Multi-Asset Skewness Trading Strategy (October 29, 2020). Available at SSRN: https://ssrn.com/abstract=3724849 or http://dx.doi.org/10.2139/ssrn.3724849
Zaremba, Adam & Nowak, Andrzej. (2015). Skewness preference across countries. Business and Economic Horizons. 11. 115-130. 10.15208/beh.2015.09.
Share onLinkedInTwitterFacebookRefer to a friend


