One Year Later: Is ChatGPT Finally Worth Using for Quantitative Analysis?
One year ago, in our article “Can We Finally Use ChatGPT as a Quantitative Analyst?”, we explored the feasibility of leveraging ChatGPT for quantitative analysis. Since then, a lot has changed: newer models are now available (from OpenAI and also other vendors), and the ecosystem around AI-assisted analysis has evolved significantly. Back then, we encountered numerous challenges, ranging from model hallucinations and faulty code generation to excessive overfitting. In this article, we revisit these issues to assess what has improved and what remains unresolved, with the goal of finally answering whether we can use LLMs to assist with quantitative analysis tasks.
How to start a conversation
To set a solid foundation, it is crucial to provide ChatGPT with clear initial instructions. These instructions must be precise, include all necessary information, and constrain the model to operate strictly within the scope we consider reasonable.
When using LLMs, our observation is that it’s a good idea to ask directly for multiple proposals for the solution of the problem we want to solve (in this case, it’s finding a trading strategy) right at the beginning. A key strength of LLMs lies in their ability to draw on an internal network of knowledge to generate a diverse set of candidate ideas. Rather than converging prematurely on a single solution, this breadth of output allows us to leverage human judgment and domain wisdom to survey the landscape of possibilities and select the most promising candidates to explore in greater depth.
The initial proposals to generate EEM trading strategies spanned a diverse set of approaches. Several relied on momentum and relative strength, such as short-term leadership rotations, simple momentum combined with defensive filters, or cross-market lead-lag signals, aiming to capture directional moves in emerging markets. Other strategies adopted a mean-reversion or snapback perspective, seeking to exploit short-term divergences from benchmarks or between related assets. Some focused on regime and risk-on triggers, entering trades when market conditions or safe-haven behaviors signaled favorable risk appetite. A further group emphasized volatility and breadth signals, using metrics like relative volatility expansion or aggregated short-term trends across multiple assets to time positions. Finally, more complex composite factor models combined multiple normalized predictors into a single signal, effectively creating a linear timing model derived entirely from the dataset.
Auto-filter
Although ChatGPT proposed ten distinct strategies, manually evaluating each one can quickly become a time-consuming task. To streamline this process, we aimed to test the model’s ability to perform an initial exploratory analysis on its own. Specifically, we asked it to generate key performance metrics on an intuitive basis, such as annualized returns, volatility, Sharpe ratio, and similar indicators that are standard in quantitative finance. Many of these strategies also included parameterized filters, and we are particularly interested in assessing the robustness of these parameters under different scenarios.
By automating this first-pass evaluation, we can quickly identify which strategies fail to produce meaningful results, allowing us to focus our attention on the most promising candidates and discard the less useful ones without excessive manual work.
One of the most promising developments at this stage is ChatGPT’s ability to produce summaries in formats beyond simple interface text. In our case, it was able to generate performance summaries directly as tables in Excel, rather than just listing metrics in the chat window.
Evaluation of selected trading approaches
For the next phase of our analysis, we decided to focus on the following strategies.
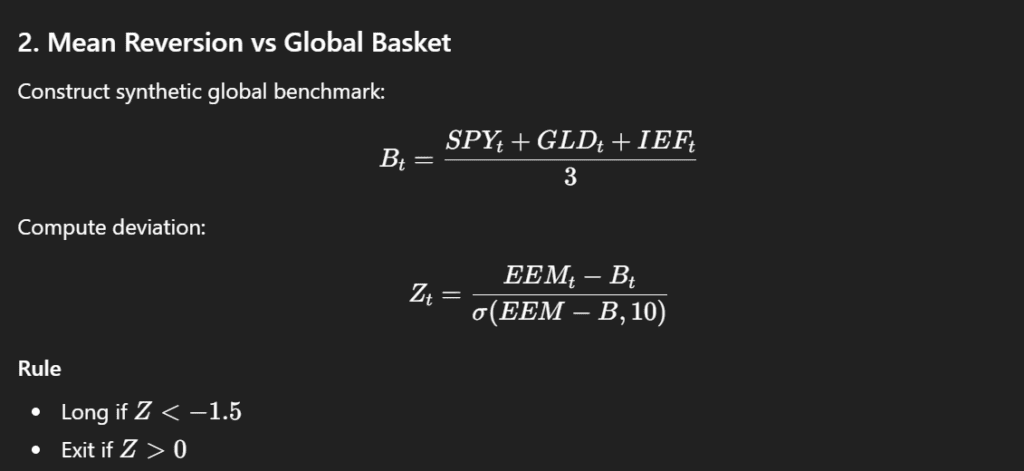
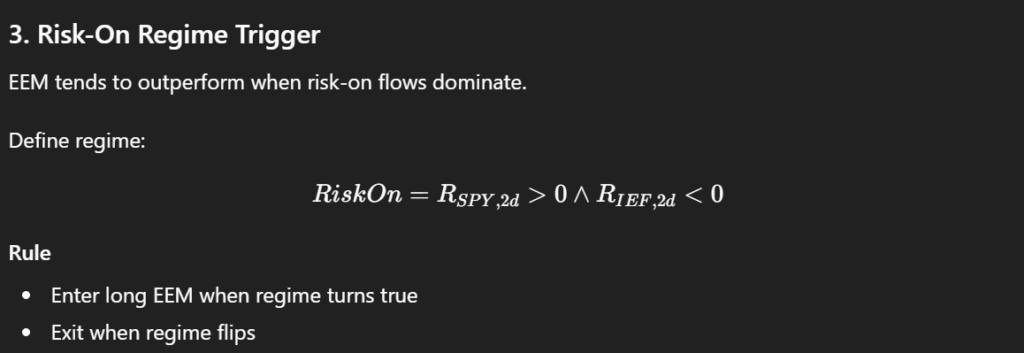
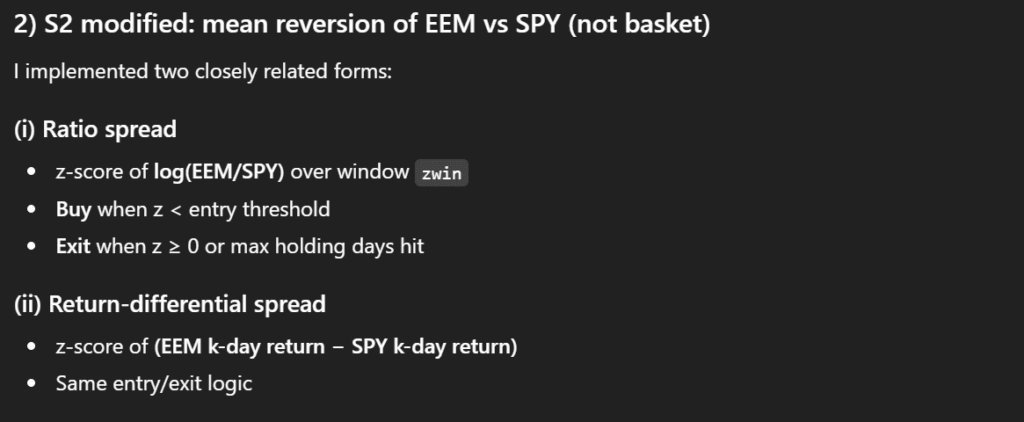
First, we take Strategy 3 (Risk-On Regime Trigger) and invert it: instead of buying EEM in a risk-on regime, we will buy during a risk-off regime to test a short-term reversal approach, exploring some variations. Second, we take Strategy 2 (Mean Reversion vs Global Basket) and adjust it to focus on mean reversion relative to SPY alone: when the spread between EEM and SPY widens, we will buy EEM for a short-term trade.
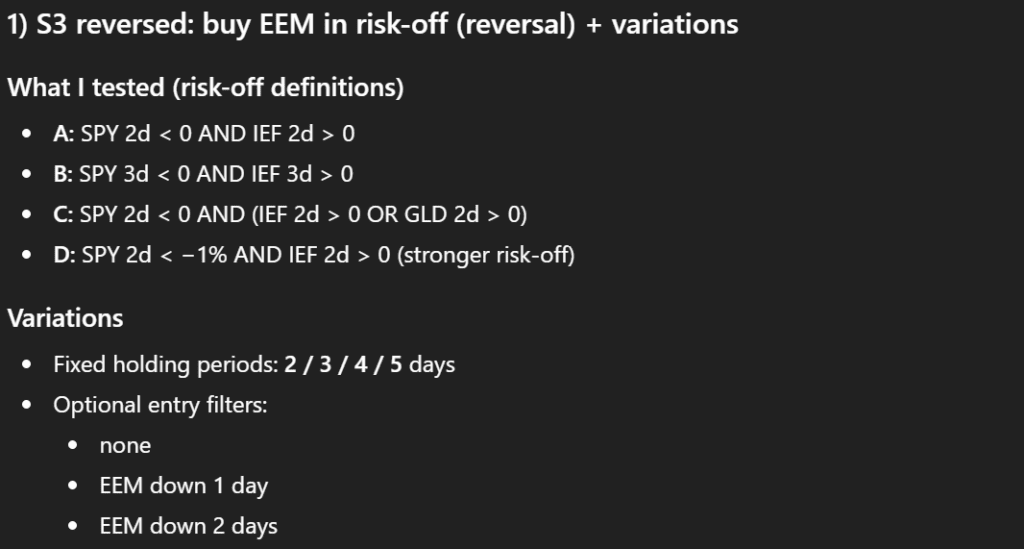
The best-performing variation of Strategy 3emerged as a model corresponding to a 3-day risk-off window without any additional EEM-down filter. It achieved a Sharpe ratio of approximately 0.524 (after accounting for 5 bps transaction costs).
The best performer in set of Strategy 2 modifications was a strategy, which uses a 5-day return differential (EEM − SPY), a 20-day z-score window, an entry threshold of −1.25, and a maximum holding period of 5 days. It achieved a Sharpe ratio of approximately 0.483 (including 5 bps transaction costs).
Handling and modifying the code
Another key objective was to investigate whether the model might be “misleading” us, given that a year ago it frequently produced hallucinations. To test this, we requested the underlying code. ChatGPT provided it in Python, complete with comments and reasonably well-formatted, making it straightforward to follow.
Having the code in hand, the next step was to check it for errors. We wanted to see if the model could identify mistakes on its own. To our pleasant surprise, it successfully caught the most obvious issues. The primary problem was a one-day shift in execution, which wasn’t necessary. Additionally, it suggested solutions for certain edge cases that, while not relevant to our specific analysis, demonstrated a proactive approach to potential anomalies. Overall, this exercise highlighted that ChatGPT can not only generate code but also self-audit it to a meaningful extent, improving reliability for subsequent quantitative testing.
This was really an upgrade in comparison to the analysis we ran approximately a year ago.
Avoiding optimisation
What became apparent in further testing of the process of the quantitative analysis is that the model generally tends to over-optimize. In practice, this manifests as an excessive widening of the search space, the addition of numerous filters, and an overall increase in model complexity. While these adjustments may seem like attempts to improve performance, they often have the opposite effect. Overcomplicated models are more prone to overfitting, capturing noise in the historical data rather than true predictive patterns. This makes the resulting strategies less robust and less likely to generalize to new, unseen market conditions. In other words, although the model may appear to produce highly refined signals, the apparent improvements can be misleading, and the real-world performance of such overengineered strategies is usually disappointing.
Fortunately, we can counteract this tendency through carefully designed prompts. If we instruct the model to limit parameter adjustments relative to the current model state, it readily adapts to this constraint. The simplest approach is to explicitly specify which parameters we consider redundant or unnecessary. By doing so, ChatGPT can focus its analysis solely on models that align with our preferences, avoiding unnecessary complexity and overfitting.
In practice, this process of constraining the model is straightforward. For example, the original Strategy 2 strategy contained too many parameters, which risked overfitting. By simplifying it, we can reduce the model to just two degrees of freedom. One parameter represents the EEM versus SPY return over X days, and the other defines the holding period, restricted to 1 – 3 days. All other parameters, such as the z-score window or additional filters, are removed. This minimal configuration allows for a clean, controlled test of the core strategy logic, reducing complexity while preserving the essential dynamics we want to evaluate.
What we find particularly useful is that when we provide these constraints, ChatGPT is able to generate a clear summary of the effects of each parameter. Instead of sifting through a long list of raw outputs, we receive a structured overview showing how changes in the holding period or the EEM versus SPY return affect performance metrics such as Sharpe ratio.
Benchmarking
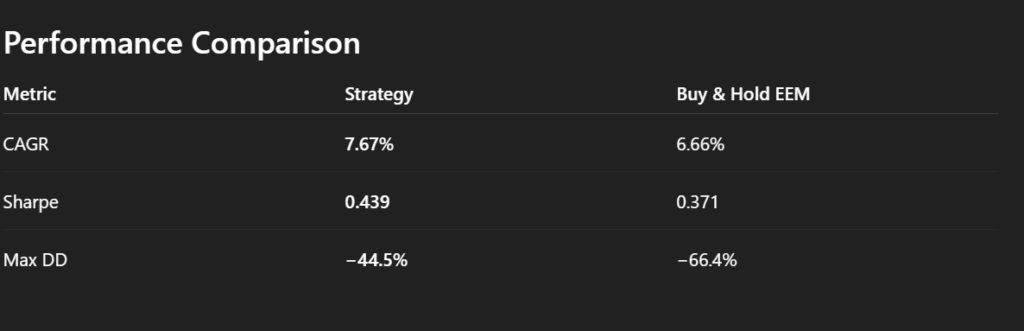
Once we have a working model, the next logical step is to benchmark its performance against a simple baseline, such as a buy-and-hold strategy on EEM. This comparison allows us to evaluate whether the strategy adds any real value beyond passive exposure.
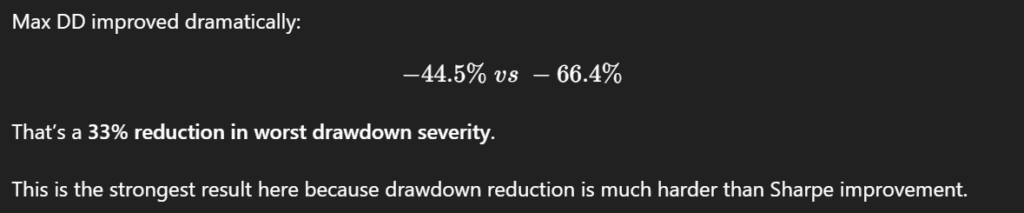
A key benefit of this approach is that, beyond receiving summary statistics for both the model and the buy-and-hold benchmark, we can also obtain a direct interpretation of the differences. ChatGPT can highlight which factors contribute most to outperformance or underperformance, contextualize risk-adjusted returns, and point out where the strategy adds value compared to passive exposure. This interpretive layer provides actionable insight, helping us decide whether pursuing this modeling direction is worthwhile, or whether adjustments are needed before further exploration.
The same approach can be applied to the third strategy as well. By generating summary statistics and direct comparisons against the buy-and-hold benchmark, we can evaluate both absolute and risk-adjusted performance.
From idea to robust strategy
So far, our exploration has focused on a single asset class and a single dataset. The expectation, however, is that if there is a truly interesting pattern in the data, it should be robust enough to persist across different datasets. To test this, we kept EEM as the primary asset but expanded the dataset to include IEF, UUP, and SPY, allowing us to explore the influence of U.S. dollar movements via the UUP ETF.
We started by running Strategy 3 (S3) on this expanded dataset, again limiting it to two parameters for clarity and interpretability: the risk-off definition, defined as SPY X-day return < 0 AND IEF X-day return > 0, and the holding period Y (1 – 3 days). This setup allowed us to see how the core strategy performs on a shorter, slightly different data range.
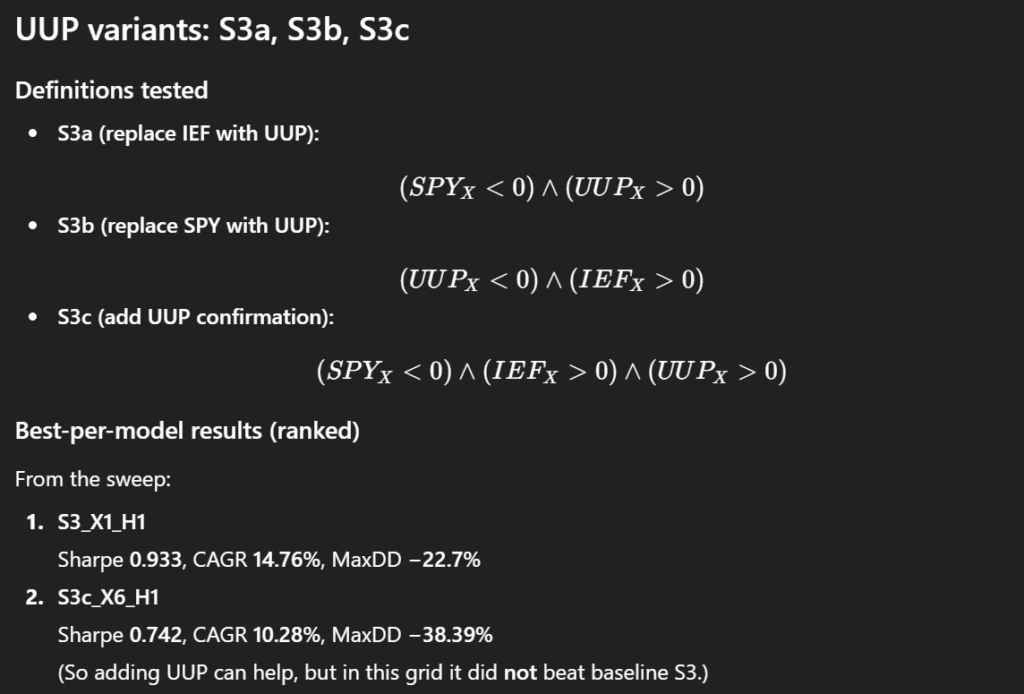
Next, we considered ways to incorporate UUP into the model. Several options were explored:
-
S3a: Replace IEF with UUP in the risk-off definition.
-
S3b: Replace SPY with UUP.
-
S3c: Add a UUP-based signal alongside SPY and IEF.
By comparing the original S3 with these variations (S3a, S3b, S3c), we assessed whether the inclusion of UUP improves robustness, enhances predictive power, or simply adds complexity without meaningful gains. This approach allowed us to examine the stability of the pattern across related market signals and refine our understanding of which macro factors are genuinely informative for emerging-market positioning.
At first glance, these results do not appear particularly compelling. However, rather than dismissing them immediately, it is useful to examine them more gradually and in greater detail. By looking at the outcomes step by step, we can try to identify specific situations or market conditions in which the strategies may still provide useful signals. Even models that seem weak in aggregate performance can sometimes reveal localized patterns or regime-dependent behavior, where their signals become more informative. This incremental analysis allows us to better understand when, and under what circumstances, the strategies might still offer practical value.
At the same time, for each strategy we also received suggestions on how it might be used more appropriately given its internal structure. The model attempted to interpret when a particular signal could be more relevant and under what conditions it might perform better.

The same analytical procedure can also be applied to the S3b and S3c strategy variants. Among these, the results for S3c appear somewhat more interesting, which motivates a deeper follow-up analysis.
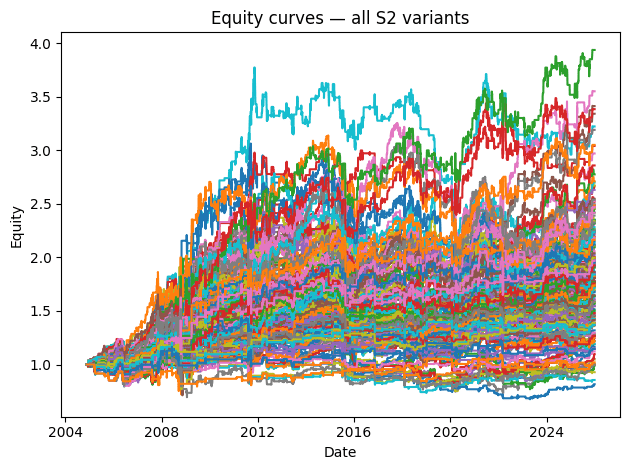
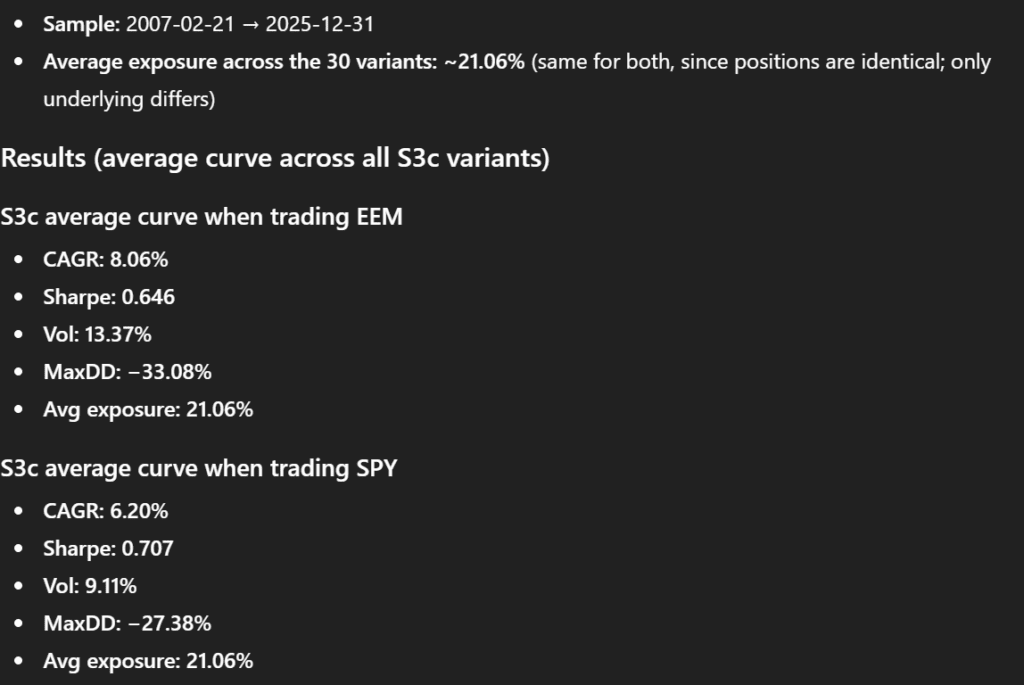
As a next step, we asked ChatGPT to compute the average equity curve across all S3c parameter configurations. From this aggregated curve, it then calculated the corresponding risk and return characteristics, providing a summary view of how the strategy behaves on average rather than focusing on individual parameter combinations.
To further test the robustness of the signal, we performed an additional experiment. We kept the same S3c signal structure, but changed the underlying asset from EEM to SPY, effectively applying the strategy logic to a different market. ChatGPT then repeated the analysis: it calculated the average equity curve for the SPY-based S3c variant and derived the same set of risk and return metrics.
Finally, the results of both experiments were compared. This allowed us to evaluate whether the signal embedded in the S3c framework is specific to emerging markets (EEM) or whether it also retains explanatory power when applied to a broader market proxy such as SPY. Such comparisons help determine whether we are observing a genuinely transferable pattern or merely a dataset-specific artifact.
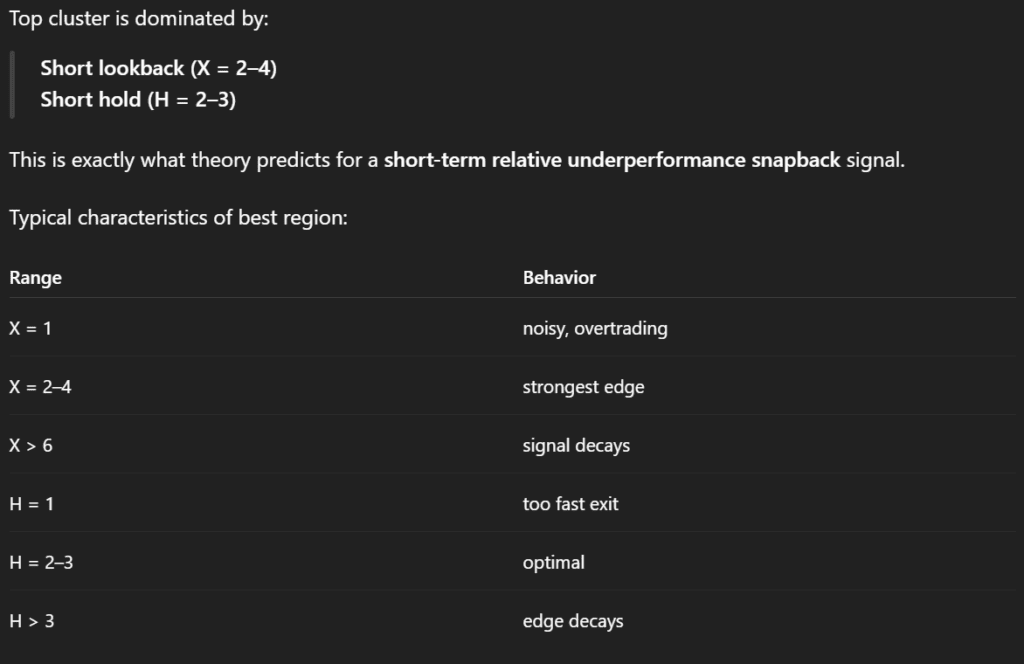
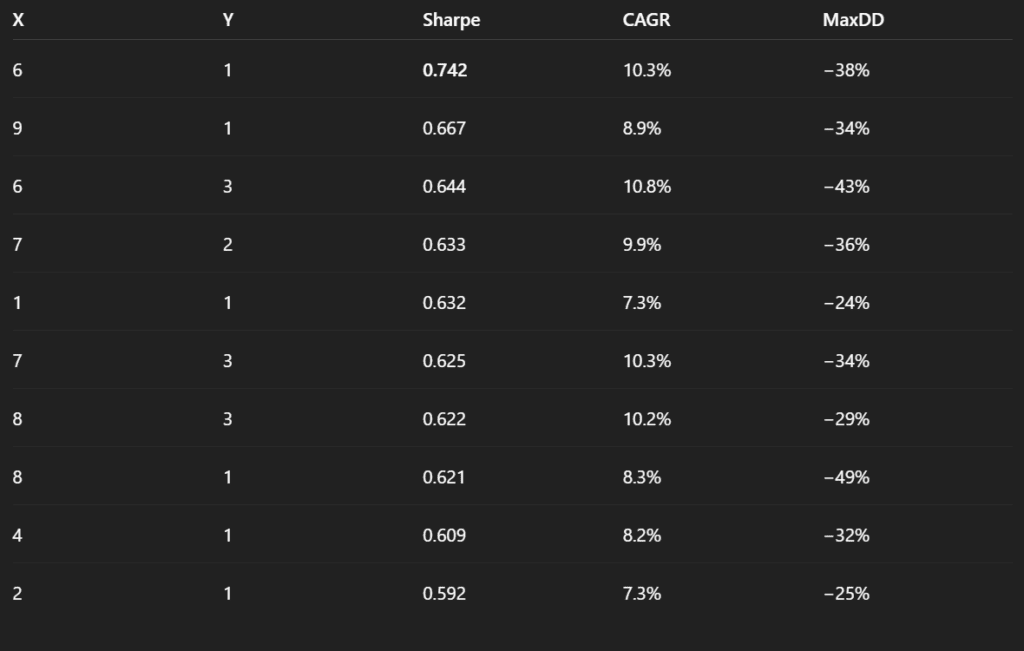
We then proceeded with a more structured analysis of the S3c strategies applied to EEM. Specifically, we asked ChatGPT to produce a table summarizing the key performance metrics across all tested parameter combinations. The goal was not only to review individual results, but to better understand whether certain clusters of parameters tend to perform more consistently than others.
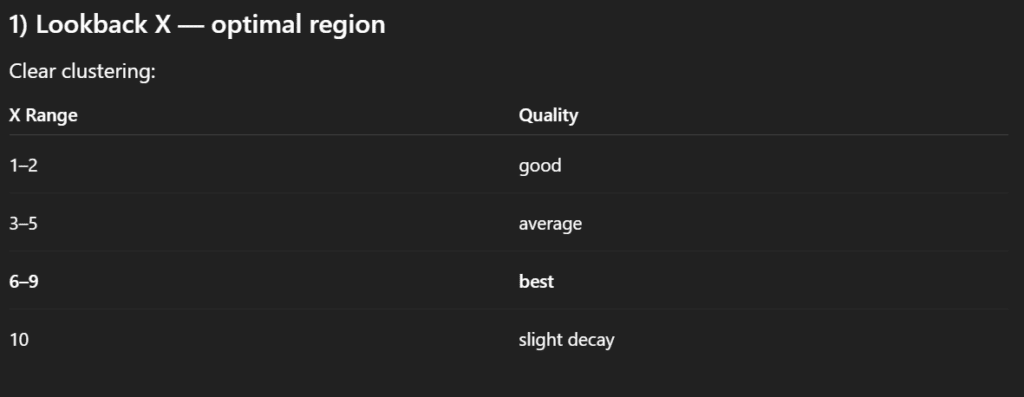
In particular, we were interested in identifying patterns related to the length of the sorting period and the holding period. By organizing the results in a tabular format, it becomes possible to observe whether strategies with shorter or longer signal windows systematically lead to better outcomes, and whether performance improves when positions are held for shorter or longer durations.
This type of clustering analysis helps move beyond evaluating isolated parameter combinations and instead reveals broader structural tendencies within the strategy space. In other words, it allows us to identify whether certain regions of the parameter grid appear more promising, which can guide further refinement and testing of the model.

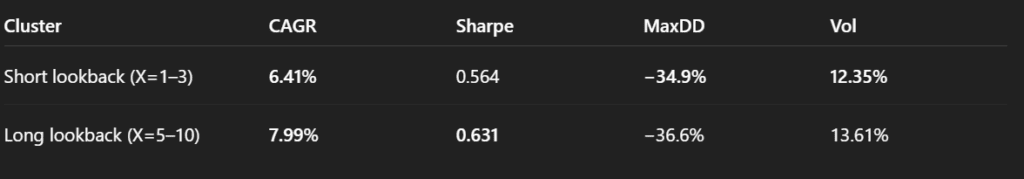
Based on these results, we can explore portfolio combinations by mixing parameter variations. Following the new instruction, we created two sets of portfolios:
-
The first set includes variants with 1, 2, or 3-day sorting periods and 1 or 2-day holding periods. ChatGPT then generated a single chart displaying all individual curves alongside the average curve for this group.
-
The second set includes variants with 5 – 10-day sorting periods and 1 or 2-day holding periods, again displayed in a single chart with the average curve.
For both average curves, ChatGPT also calculated risk and return metrics, which were summarized in a table.
It is also a good idea to visualize equity curves of individual strategies and their averages as quantitative analysis progresses. Visualizations often help uncover patterns and relationships that may not be visible from pure statistics and tables.
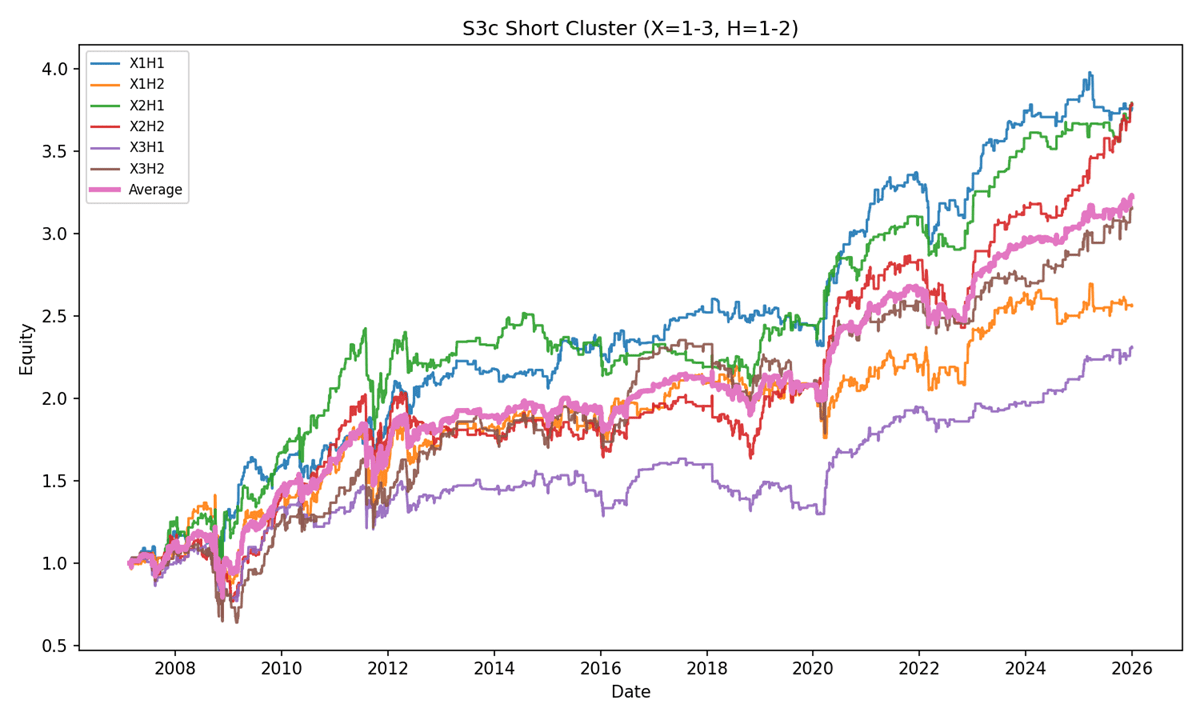
Figure 16: S3c strategies – Short Cluster
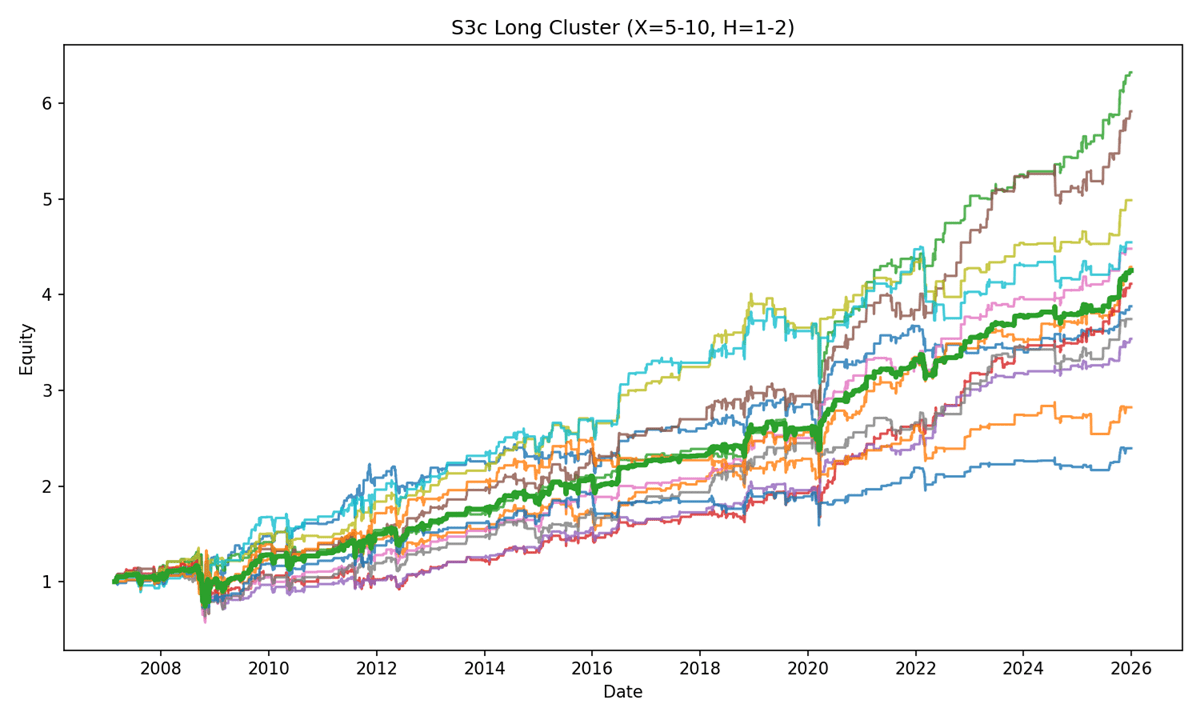
Figure 17: S3c strategies – Long Cluster
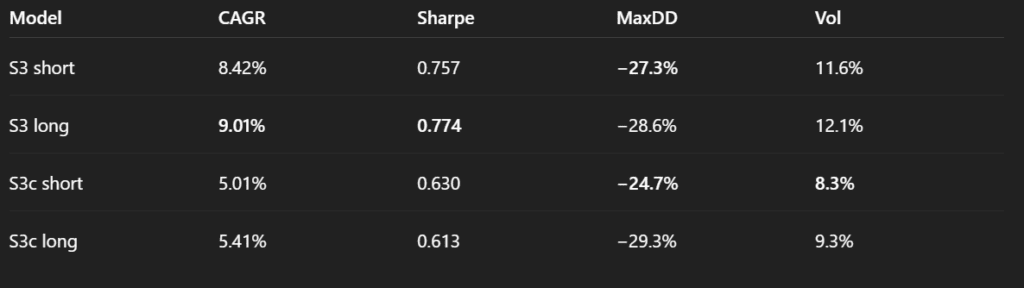
To test whether including UUP truly adds value, we repeated the same clustering analysis for the original S3 variant without any UUP signal.
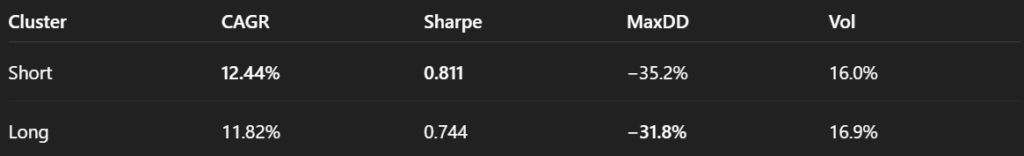
By comparing the two variants, we see that S3c only shows an advantage over S3 in terms of volatility, suggesting that adding the UUP signal may not necessarily be beneficial. In effect, it appears to act as a trade suppressor, filtering out too many opportunities and possibly over-constraining the model.
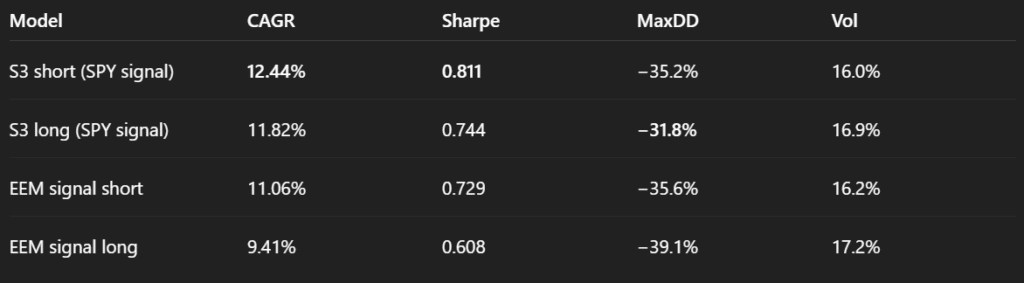
To explore this further, we ask the same question in a different context: which is more reasonable, S3c or S3, when applied to a different underlying asset. We repeat the same clusters and analyses. But instead of EEM, we now use SPY as the underlying.
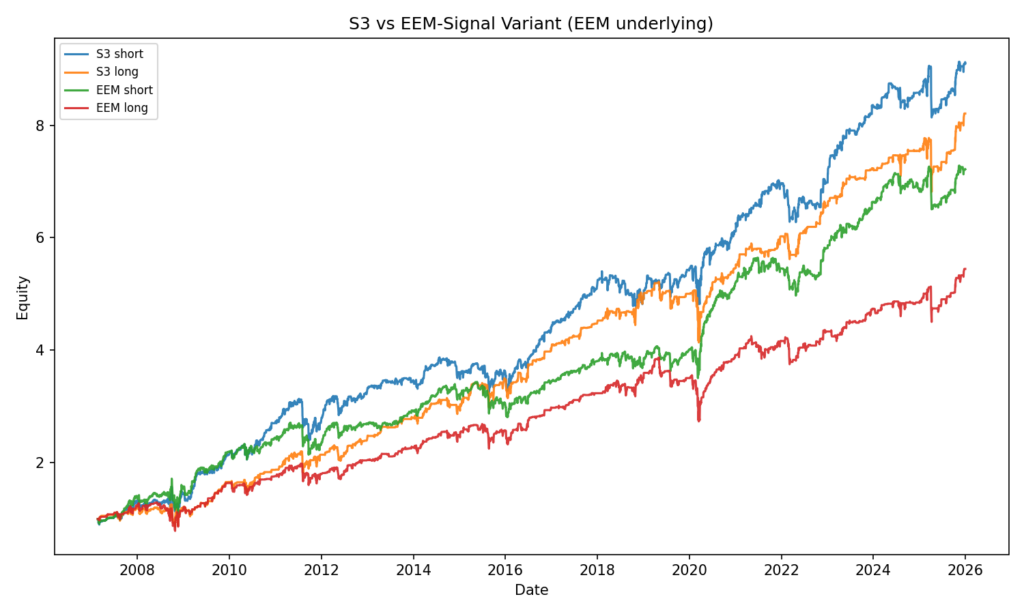
We now proceed to implement a slight modification to the S3 strategy. In this variant, we replaced SPY with EEM in the signal generation: instead of evaluating the past performance of SPY and IEF, the model now considered EEM and IEF.
Takeaway from the robustness testing
There were other tests we did (transaction cost analysis etc. etc.), however, the picture is clear by now. We can stop our analysis here.
There definitely exists a short-term reversal effect in the EEM ETF that we can profit from. Plus, there are multiple different variants of trading strategies that we can use to capture this inefficiency and which one to use is really at the discretion of each individual trader.
However, our goal was not to find the best-performing trading strategy, but to assess whether we can use the LLMs as assistants in our backtesting tasks. And can we?
We would say that yes, we finally can.
The technology is not without faults, but it finally provides a net benefit. We can finally invest time into LLM-assisted research and come out ahead — both in terms of speed and net productivity — rather than losing time debugging LLMs’ hallucinations and correcting flawed outputs, which was often the case just 6–12 months ago.
Why did we perform so many variation tests? The reason is simple – our goal was not to over-optimize, but to stress-test the reversal strategy. We wanted to understand which EEM predictors are better and which are unnecessary. Plus, we wanted to understand if those predictors also work in the SPY market, which is highly correlated with EEM.
And here comes the catch.
In a lot of the steps, the LLM tried to “help” with the robustness testing; however, it usually had the tendency to over-optimize the strategy instead of testing robustness. The LLM kept suggesting steps that were adding additional degrees of freedom to the strategy. We knew what we wanted to test and how we wanted to use the LLM in the analysis process. However, if we were just simply following suggestions from LLM, we would end up with an over-optimized, fragile backtest.
This is one of the greatest dangers of LLMs at this moment – they have improved a lot over the last year; however, their suggestions for the next step in the analysis are very often way off. It is dangerous to let LLMs run analysis in a loop without supervision.
Summary
Over the past year, our analyses with ChatGPT (and other LLMs) have shown progress. Several of the issues we encountered previously, such as data corruption and model hallucinations, have become less frequent, likely due to the controlled environment where we can review the underlying code. Interaction efficiency has improved, allowing us to reach results faster than before.
However, oversight remains necessary. For exploratory analysis, ChatGPT can be a helpful tool, but before using or publishing its models, it is still advisable to either manually validate results or implement and verify the final models independently. This ensures that small errors do not lead to significant problems.
The problem of over-optimization has not disappeared entirely. While it can be mitigated with careful guidance, the model still tends to add complexity, which requires analyst supervision. Overall, the progress is really noticeable, but the workflow remains far from fully automated: we can explore multiple options more quickly, but selecting, validating, and implementing promising candidates still requires human judgment.
In short, ChatGPT cannot replace a quantitative analyst, yet. However, it can really assist with exploratory tasks, potentially saving time and giving structured insights, provided that the analyst remains in control and interprets the results in the context of economic reality. The net benefit in terms of time spent is finally positive! However, the tool should still be used cautiously rather than relied upon unconditionally as a substitute for careful analysis.
Authors:
David Belobrad, Junior Quant Analyst, Quantpedia
Radovan Vojtko, Head of Research, Quantpedia
Are you looking for more strategies to read about? Sign up for our newsletter or visit our Blog or Screener.
Do you want to learn more about Quantpedia Premium service? Check how Quantpedia works, our mission and Premium pricing offer.
Do you want to learn more about Quantpedia Pro service? Check its description, watch videos, review reporting capabilities and visit our pricing offer.
Do you want algorithmic access to the full Quantpedia database via the API? Subscribe to Quantpedia Pro, ask for an API key, and explore the in/out-of-sample statistics, source academic papers, and code snippets — ideal for quantitative research, systematic trading workflows, and AI model training.
Are you looking for historical data or backtesting platforms? Check our list of Algo Trading Discounts.
Or follow us on:
Facebook Group, Facebook Page, Telegram, Twitter, Linkedin, Medium or Youtube
Share onLinkedInTwitterFacebookRefer to a friend


