Six Examples of Trading Strategies That Use Alternative Data
Alternative data has been booming in recent years, and a potential room for their usage in a design of systematic trading and investment strategies is huge. Whether we talk about satellite and logistics data, various surveys and sentiment data or data related to earnings calls – all of these can be categorized as alternative data. In comparison, “traditional data” are usually considered to be stock price, company fundamentals (EPS, debt, cash flow, …), macro data (inflation, payrolls, GDP, …).
So, why has been alternative data recently so much popular? The answer most of the time hovers around the notion of “seeking the new alpha sources“. First, the hunt for alpha is huge due to the low yield world and is getting only bigger. Secondly, some of the more popular strategies can become crowded, leading to diminishing alpha or the risk of a sudden reversal in performance (all of us remember this year’s growth vs. value switch). Hence, the search for alternative alpha sources is a very logical way to proceed.
We at Quantpedia don’t create nor manage any alternative data sets. But we are aware of this trend, and we strive hard to find new alpha opportunities which may lie in these new data sources.
From the database of almost 700 quantitative investment strategies Quantpedia has gathered, almost 100 strategies are based on alternative datasets. Today, we picked just 6 of them to give you a little taste of how these alternative strategies may look like, what kind of datasets they utilize and how they perform. The detailed logic behind each strategy is available to all Quantpedia Premium and Quantpedia Pro subscribers.
Alternative Data Investment Strategies
A/ Brand Value Factor
Assets: global or US single stocks
# Instruments: 100 large caps
Frequency: Monthly
Type: Long only stock-picking
Indicative performance: +11.95% p.a.
Indicative volatility: 16.73% p.a.
Strategy idea: long low brand value companies
A concept of a “brand value” definitely can’t be labeled as a traditional data source. Insights building on the brand value are pretty novel and they seem to work quite well.
The idea behind the strategy, although a bit counterintuitive, is pretty simple – buying low brand value companies and thus earning an “unpopularity premium”. This premium is described as excess return created by the risk of not being at the top of branded companies, which isn’t rational by thinking like a classical economist.
Of course, there are multiple different measures of the brand value and multiple different ways how to put them together into the (profitable) investment strategy. If you are interested in more details, the Brand Value Factor strategy in Quantpedia’s database covers these.
B/ Google Search Strategy
Assets: US single stocks
# Instruments: 188 large caps
Frequency: Weekly
Type: Long only stock-picking
Indicative performance: +19.3% p.a.
Indicative volatility: 21.4% p.a.
Strategy idea: long low attention companies
What else than the most popular search engine in the world should serve as an alternative dataset for a profitable quantitative investment strategy, right?
We’ve surely all heard about low volatility strategies. Their popularity has been immense in recent years. That being said, low volatility strategies are mostly based on price data only and are thus considered as strategies based on traditional data. However, there are now more innovative ways than just volatility to measure low risk or low attention of investors to the particular company. One of them is e.g. Google Search data.
This alternative data strategy seeks to buy stocks with low attention attached to them. It’s based on the premise that firstly, these stocks tend to be underpriced, and once the attention turns back towards them, their price tends to increase, and secondly, these stocks are usually associated with lower risk.
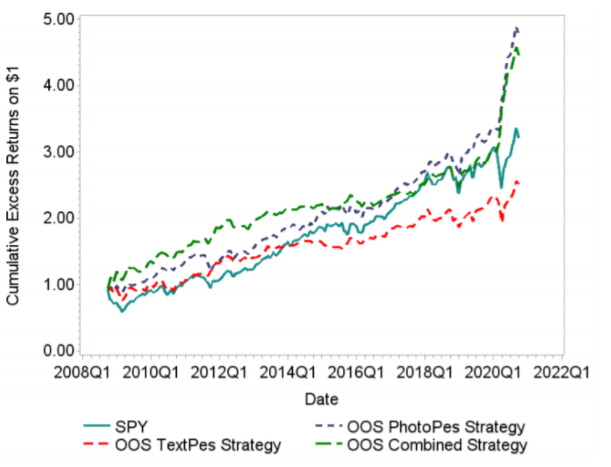
C/ Newspaper Picture and Text Pessimism
Assets: S&P 500 tracker and 1-month Treasury bill
# Instruments: 2
Frequency: Daily
Type: asset allocation
Indicative performance: +15.06% p.a.
Indicative volatility: 15.82% p.a.
Strategy idea: extract pessimism from news and pictures by machine learning and invest after too pessimistic days
With the recent massive rise of big data, the rise in data manipulation techniques helping us cope with them has come along. Many of these techniques can be summarized under machine learning methods. When used properly, machine learning may be a powerful tool as a guide for investment decisions.
Particularly in this strategy, machine learning is used to extract investor pessimism from newspaper pictures and texts. Hence, the alternative dataset used for the Newspaper Picture and Text Pessimism strategy is the newspaper articles.
The strategy is based on a novel and exciting methodology. In simple terms – it invests in the equity markets for a short time period if the investor pessimism reaches high levels, utilizing the market reversal tendency. The pessimism is, however, not measured in a conventional way of just looking at the price. The strategy rather looks at pessimism contained in newspaper articles, charts and pictures, which significantly differentiates it from other similar strategies.
Are you looking for a good Financial News API? Then check the EOD Historical Data web, a partner of this blog.
D/ Technology Momentum
Assets: US single stocks
# Instruments: 1000
Frequency: Monthly
Type: Long-short stock-picking
Indicative performance: +8.06% p.a.
Indicative volatility: 18.17% p.a.
Strategy idea: long stocks linked to technological innovations with positive momentum
A unique alternative dataset used as a basis for the Technology Momentum strategy analyzes stock returns linked to technological innovations and e.g. the number of new patents.
Investors tend to misvalue innovation or undervalue innovative efficiency and originality. The technology momentum represents a market inefficiency driven by investors’ limited attention, information processing capacity, valuation uncertainty and arbitrage costs – a stronger effect was found for firms that investors are more likely to overlook.
Despite being a bit complex, the Technology momentum strategy is built on a promising idea and, when implemented correctly, may also provide interesting investment returns as both long-only or long-short implementation.
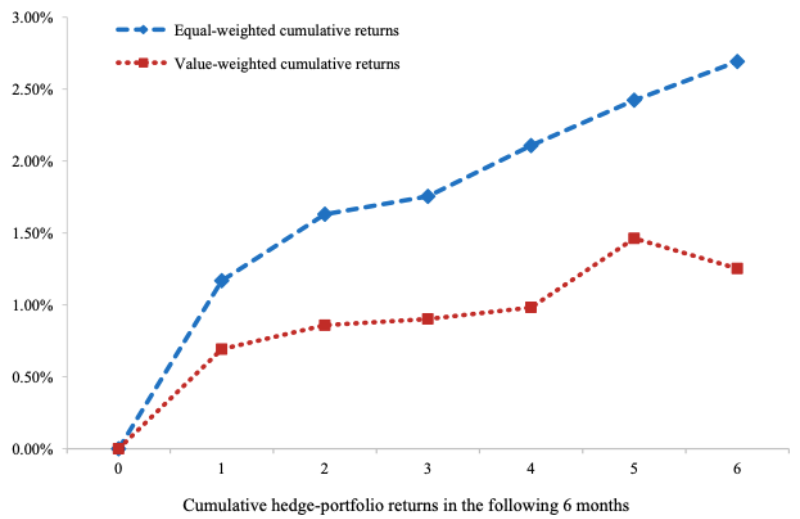
E/ Management Diversity
Assets: US single stocks
# Instruments: 1000
Frequency: Monthly
Type: Long-short stock-picking
Indicative performance: +6.55% p.a.
Indicative volatility: 7.38% p.a.
Strategy idea: long most diverse management team companies
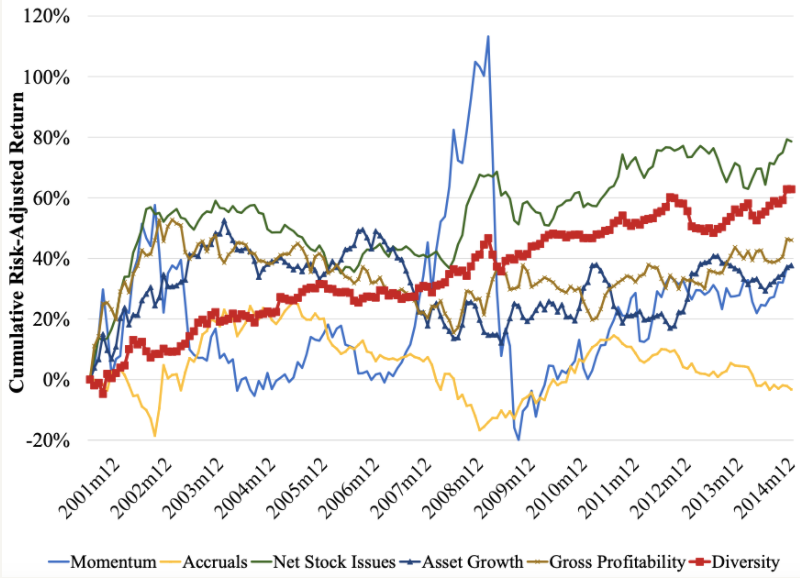
Diversity in corporations has been a longstanding issue and popular topic for discussion everywhere around the world. But does diversity also affect a company’s stock return? It seems that it does.
This alternative dataset analyzes biographical texts of hundreds of exchange-listed companies and aims to extract the management diversity out of them. Consequently, the strategy is based on going long the stocks with the highest management diversity and shorting the stocks with the lowest management diversity.
Although it doesn’t belong to the strategies with the highest return, the Management Diversity Factor strategy seems to perform quite stable in time, which may make it an attractive satellite addition to an alternative quantitative strategy portfolio.
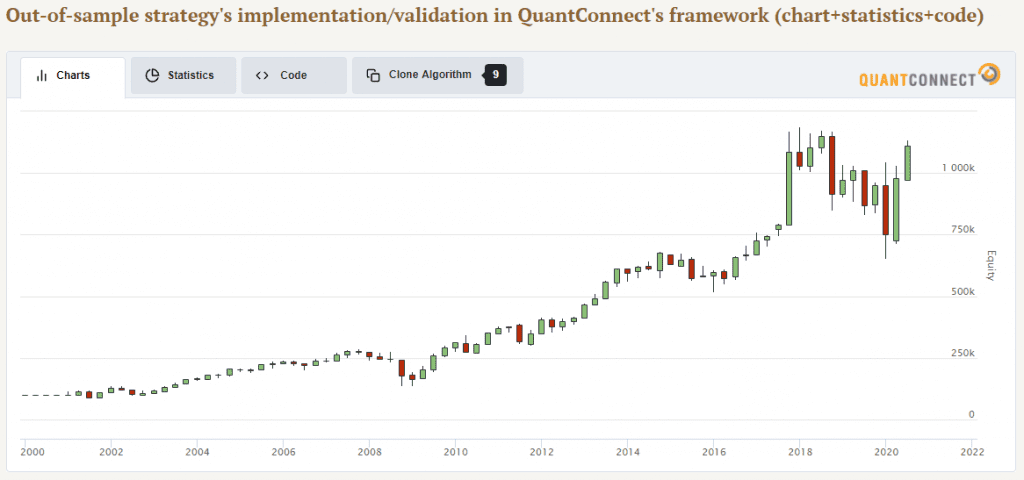
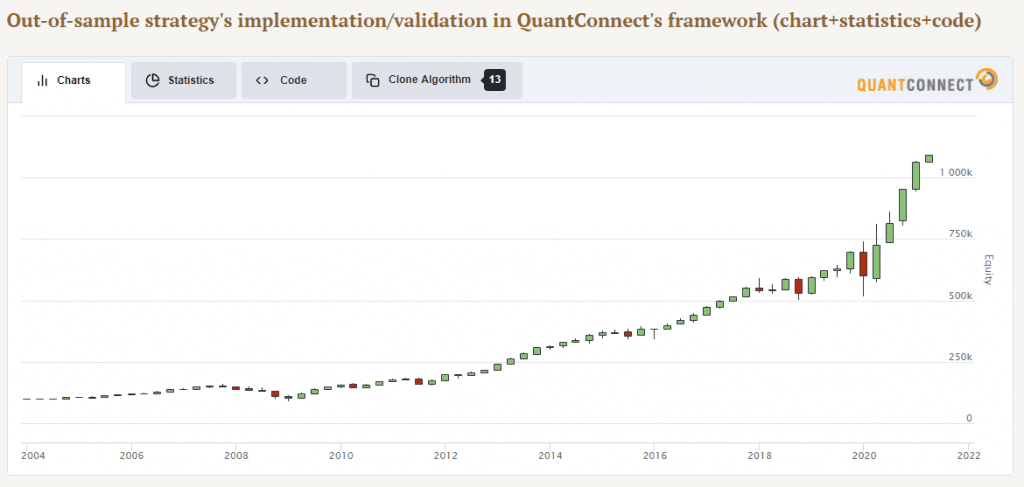
F/ Lexical Density of Filings
Assets: US single stocks
# Instruments: 500 large caps
Frequency: Monthly
Type: Long-short stock-picking
Indicative performance: +8.16% p.a.
Indicative volatility: 10.4% p.a.
Strategy idea: long stocks with large amount of information-carrying words in their company filings
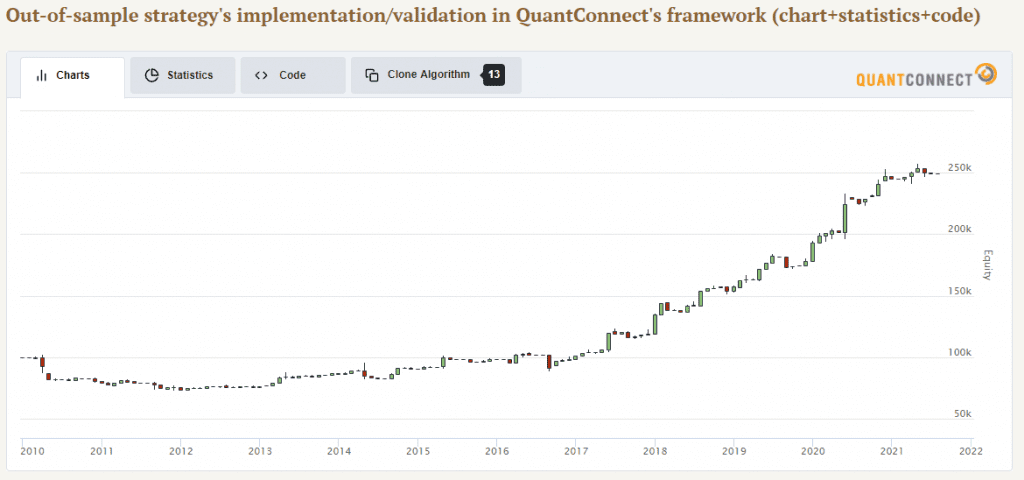
The last strategy comes from our own research article. It uses Quantconnect’s alternative data library as a source of the dataset. The alternative dataset we used applies natural language processing techniques to extract the “information richness” of the company filings, both in terms of verbal and financial content.
Lexical density measures the structure and complexity of human communication in a text. A high lexical density indicates a large amount of information-carrying words. The research suggests that the richer the vocabulary of an investor is, the higher the lexical score the company gets and the better it performs.
The machine learning strategy based on the amount of information-carrying words in company filings seems to perform particularly well in recent years when the quality of these filings improved considerably.
Conclusion
Today, we looked at several examples of interesting quantitative investment strategies based on alternative datasets. These strategies take a novel approach to looking at the traditional investment paradigms. In the investment world in which popular traditional factor strategies are becoming more crowded and more synchronized, the alternative datasets are the ones that aim to hunt for new alpha sources.
Quantpedia aims to provide you, our readers, with as much investment strategies’ inspiration as possible. We’ve done it today with a small sample of ideas, and we do it continuously with our database of almost 700 quantitative strategies, including almost 100 strategies utilizing alternative data.
Are you looking for more strategies to read about? Sign up for our newsletter or visit our Blog or Screener.
Do you want to learn more about Quantpedia Premium service? Check how Quantpedia works, our mission and Premium pricing offer.
Do you want to learn more about Quantpedia Pro service? Check its description, watch videos, review reporting capabilities and visit our pricing offer.
Do you want algorithmic access to the full Quantpedia database via the API? Subscribe to Quantpedia Pro, ask for an API key, and explore the in/out-of-sample statistics, source academic papers, and code snippets — ideal for quantitative research, systematic trading workflows, and AI model training.
Are you looking for historical data or backtesting platforms? Check our list of Algo Trading Discounts.
Or follow us on:
Facebook Group, Facebook Page, Telegram, Twitter, Linkedin, Medium or Youtube
Share onLinkedInTwitterFacebookRefer to a friend


