The Illusion of the Carbon Premium
Authors: Thijs D. Markwat, Matthias X. Hanauer, and Laurens Swinkels
Title: The Illusion of the Carbon Premium
Link: https://papers.ssrn.com/sol3/papers.cfm?abstract_id=6254118
Abstract:
Carbon that has not yet been emitted should not be used to predict stock returns. When emissions are not lagged, we closely replicate the positive carbon premium documented by Bolton and Kacperczyk (2021). Using only carbon emissions data available to investors at the time of portfolio formation, however, we find no positive relation between firms’ absolute carbon emissions and stock returns. The reported carbon premium is therefore driven by a look-ahead bias, as estimated emissions are mechanically linked to future revenues when emissions data are not sufficiently lagged. We further show that regression-based estimates of the carbon premium are sensitive to skewed dependent variables and multicollinearity with standard controls. When greenness is measured by carbon intensity rather than absolute emissions, green firms have outperformed brown firms. We provide out-of-sample evidence for a positive green-minus-brown factor over the period 2020-2025, despite the strong performance of energy stocks during the first year of the Russia-Ukraine war. Unlike earlier periods, this recent outperformance is not driven by a further widening in the cost of capital of carbon-intensive firms.
As always, we present several interesting figures and tables:
Notable quotations from the academic research paper:
“Bolton and Kacperczyk (2021, 2023) find that firms with high absolute emissions, i.e., those targeted by investors who are signatories to Climate Action 100+, have earned higher returns over the period from 2005 to 2017 in the US (and through 2018 and for the rest of the world). Interestingly, they find no evidence that companies with higher carbon intensity, defined as carbon emissions per unit of revenue, earn different returns than those with lower carbon intensity. This is particularly puzzling, as they also document that carbon intensity (or carbon footprint) is a common metric that investors use to assess whether a company is polluting.
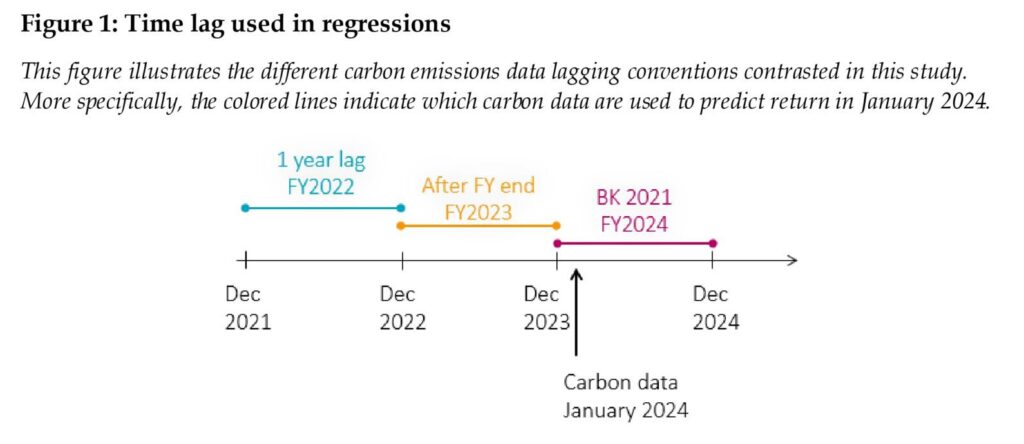
The positive excess returns earned by high carbon-emitting companies documented by Bolton and Kacperczyk (2021, 2023) are challenged by Aswani, Raghunandan, and Rajgopal (2024) and Zhang (2025). Aswani, Raghunandan, and Rajgopal (2024) report that the positive carbon premium is present only for estimated carbon emissions data, but not for reported emissions data. Furthermore, Zhang (2025) documents a look-ahead bias in estimated carbon data when no appropriate time lag is applied. Carbon emissions are typically estimated by multiplying an industry-specific carbon intensity (carbon emissions divided by revenues) by a firm’s current period’s revenues. Without sufficient data lagging, sorting firms by total carbon emissions effectively implies sorting firms by future revenues.
The main findings of our study can be summarized as follows. First, we ask whether a carbon premium exists in absolute emissions once information is properly timed. Using a sample of investable US stocks and carefully aligning emissions data with the information set available to investors, we show that firms with higher absolute carbon emissions do not earn higher returns once emissions are sufficiently lagged. When emissions are not lagged, we closely replicate the positive carbon premium documented by Bolton and Kacperczyk (2021). This result demonstrates that the reported carbon premium in emission levels is driven by a look-ahead bias inherent in estimated emissions that are mechanically linked to future revenues
Second, we explain why regression-based evidence on the carbon premium has been fragile and often contradictory. We show that panel regression estimates are highly sensitive to implementation choices that are often treated as innocuous. Carbon emissions and intensities are strongly right-skewed, requiring logarithmic transformations, and absolute emissions are highly correlated with revenues and firm size, generating severe multicollinearity. These features make coefficient estimates unstable across control sets, lag structures, and outlier treatments. This contribution clarifies why prior regression studies have reached divergent conclusions even when using similar data.
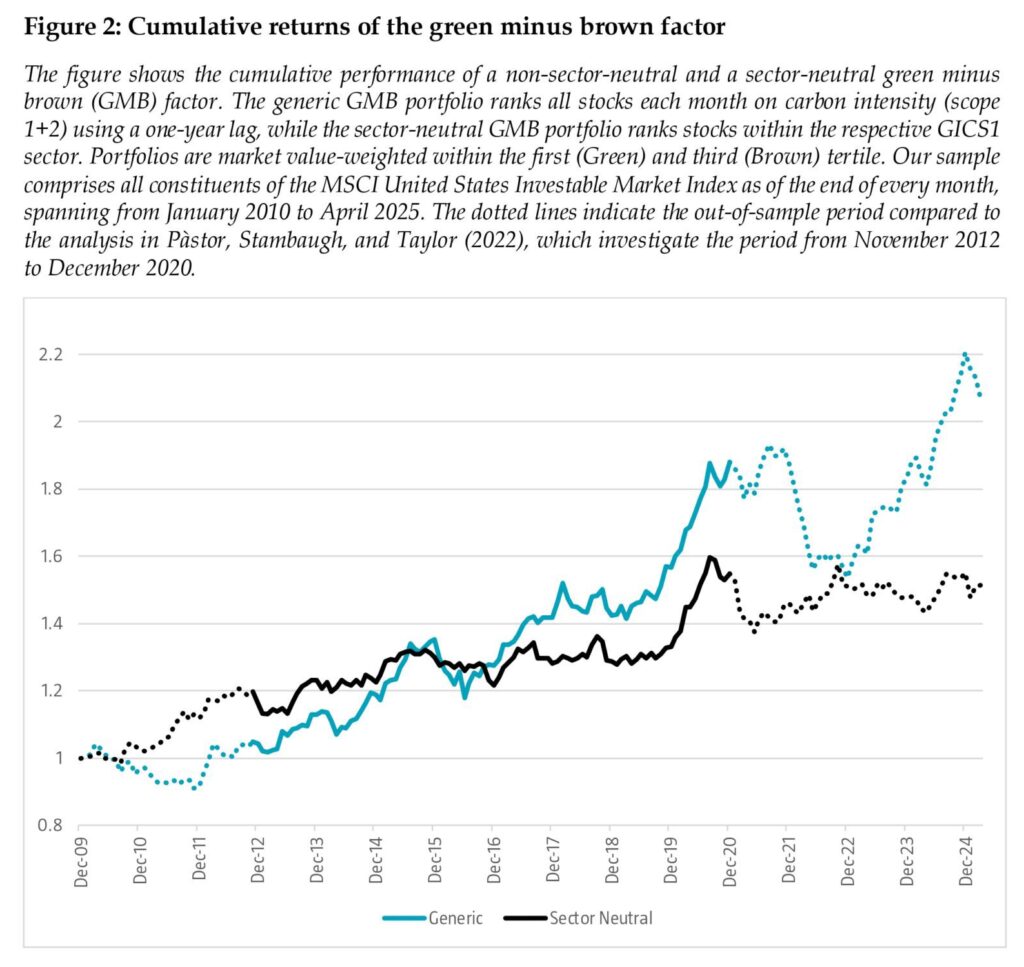
Third, we examine whether portfolio sorts reveal a robust green-minus-brown factor and under which conditions it survives. Using carbon intensity as the sorting variable, we document economically and statistically meaningful green-minus-brown return differences when sector tilts are allowed, consistent with Pàstor, Stambaugh, and Taylor (2022). However, this premium becomes substantially weaker and statistically insignificant under sector-neutral sorting. This result reconciles the portfolio evidence with the regression findings by showing that the existence of a green factor depends critically on whether industry composition effects are part of the definition of greenness.
Figure 2 shows the cumulative performance of our ‘green minus brown’ factor over the period 2010 to 2025. The dotted parts of the lines indicate the out-of-sample performance relative to Pàstor, Stambaugh, and Taylor (2022), who investigate the period from November 2012 to December 2020. Despite differences in the sample of stocks and the sorting variable, the performance in the in-sample period is very similar: green stocks strongly outperform brown stocks when sector tilts are allowed, and weaker, but still positive performance when sector neutrality is imposed.
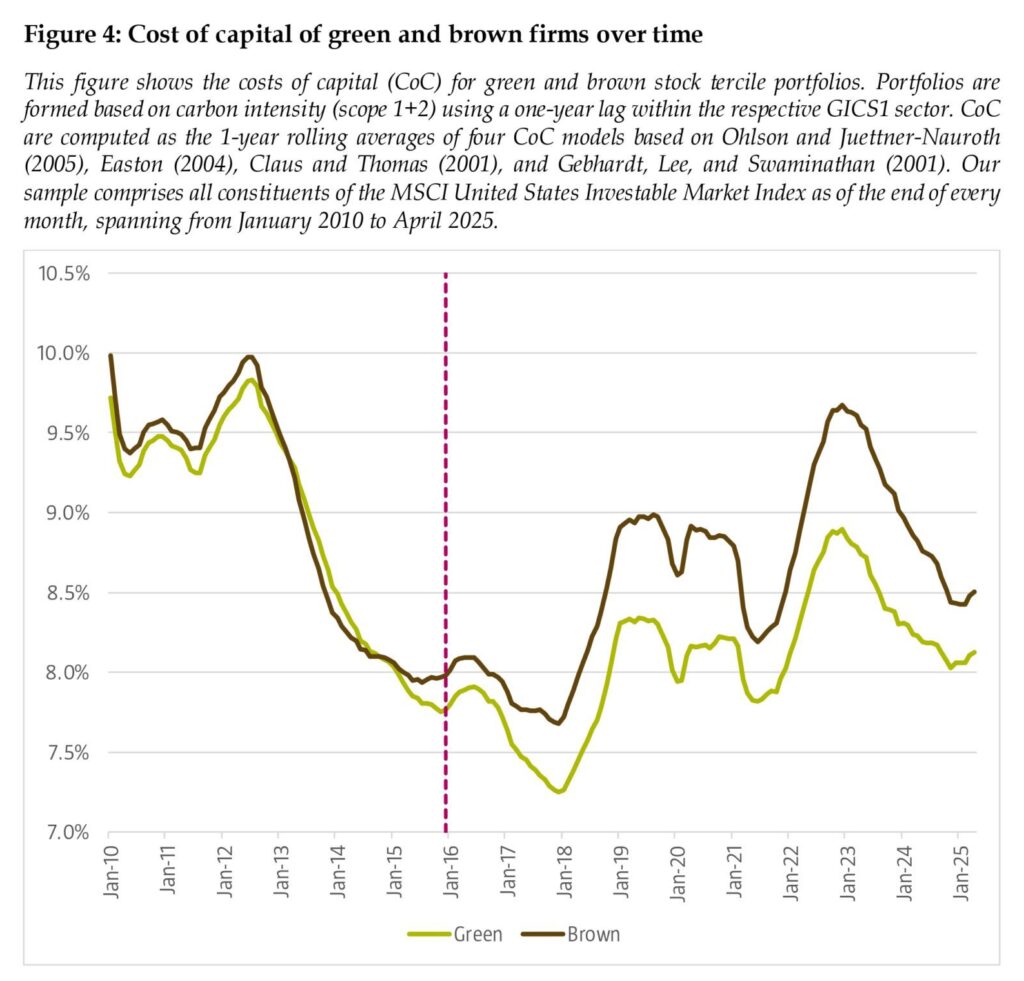
Figure 4 shows the average cost of capital for the top and bottom terciles of stocks sorted on carbon emissions within their sector. While there is substantial variation over time, the cost of capital of green and brown firms moves largely in tandem until the Paris Agreement in 2016. Afterward, the two series begin to diverge, with brown firms facing higher costs of capital. More specifically, the spread in cost of capital increases in the first years after the Paris Agreement but remains largely stable after 2019.”
Are you looking for more strategies to read about? Sign up for our newsletter or visit our Blog or Screener.
Do you want to learn more about Quantpedia Premium service? Check how Quantpedia works, our mission and Premium pricing offer.
Do you want to learn more about Quantpedia Pro service? Check its description, watch videos, review reporting capabilities and visit our pricing offer.
Are you looking for historical data or backtesting platforms? Check our list of Algo Trading Discounts.
Or follow us on:
Facebook Group, Facebook Page, Twitter, Linkedin, Medium or Youtube
Share onLinkedInTwitterFacebookRefer to a friend


