The Impact of the Inflation on the Performance of the US Dollar
Introduction
Inflation is one of the key macroeconomic forces shaping financial markets, influencing asset prices across the board. In our previous analysis, we examined how gold and Treasury prices react to changes in the inflation rate, uncovering patterns that suggested inflation dynamics also impact the US Dollar. In this follow-up, we shift our focus entirely to the dollar, analyzing how it responds to both accelerating and decelerating inflation. As the world’s reserve currency, the dollar’s movements have far-reaching implications, affecting global trade, monetary policy, and asset allocation. Our goal is to determine whether inflation serves as a clear driver of dollar performance and, if so, in what ways.
Background
As a macroeconomic variable, inflation significantly influences various asset classes, including equities, fixed-income securities, and commodities. The relationship between inflation and asset performance is complex and multifaceted. For instance, empirical studies such as those by Bernanke et al. (1996) highlight how inflationary shocks propagate through the financial accelerator mechanism, affecting credit supply and asset valuations. In the fixed-income market, inflation erodes the real returns on nominal bonds, as articulated by the Fisher equation. Our own article uncovers, that acceleration in the inflation rate is a positive for gold prices, while on the other hand, deceleration in the inflation is advantageous to the treasury prices. Furthermore, Gopinath (2015) demonstrates that prolonged low interest rates can paradoxically hinder economic growth and inflation targets, emphasizing the need for a nuanced understanding of these dynamics.
The relationship between inflation and the performance of the U.S. dollar is also complicated and many-sided. A rise in inflation can weaken the US Dollar against a basket of other currencies if it erodes purchasing power and diminishes confidence in the currency’s stability. If inflation surges without a proportional increase in interest rates or if markets anticipate that the Federal Reserve will lag in its response, the real return on dollar-denominated assets declines. This can lead to capital outflows as investors seek assets in countries with more stable or higher real yields, driving the dollar lower. Additionally, higher domestic inflation can reduce the competitiveness of US exports, widening the trade deficit and further pressuring the currency.
On the other hand, a decline in inflation can strengthen the dollar if it signals economic stability and prompts the Fed to maintain or even tighten monetary policy relative to other central banks. Lower inflation preserves the dollar’s purchasing power, making it more attractive as a store of value. If other economies continue to experience higher inflation while the US sees inflation cooling, relative monetary policy divergence can drive investors toward the dollar, increasing its value against other currencies.
Results
Let’s not waste more time with the theory and move to the outlines of our investigations.
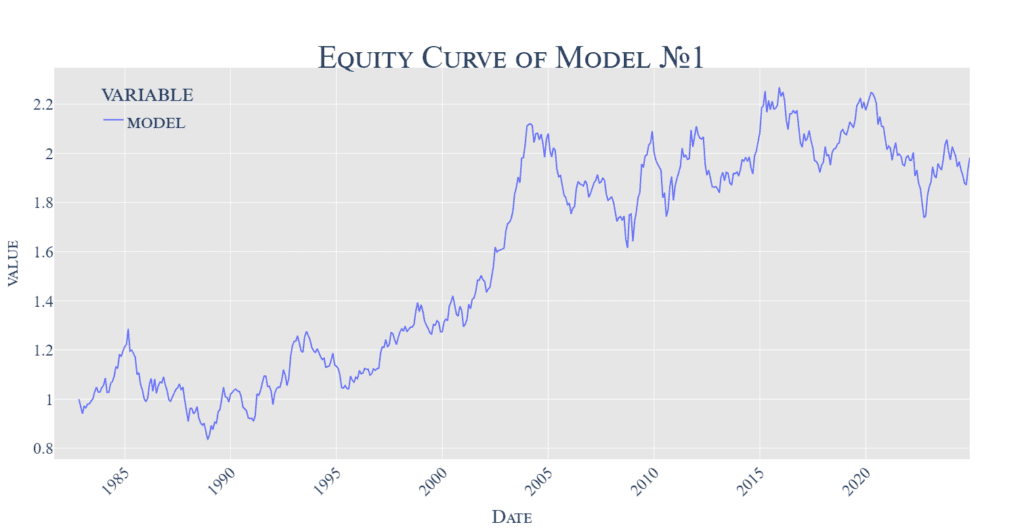
Finding 1 — Impact of Inflation Alone
As our previous analysis hinted, the US Dollar is also sensitive to inflation (albeit with a lower amplitude than gold or treasuries), and we can, therefore, define our basic simple benchmark investment strategy with the following trading decision rules:
- If inflation rises (for two consecutive months), take a short position on USD and hold it until the opposite signal arrives.
- If inflation declines (for two consecutive months), take a long position on the USD and also hold it until the opposite signal arrives.
In simple terms, we are switching between two positions (long/short USD) based on the last inflation signal (deceleration/acceleration). The equity curve graph presents the strategy’s performance (which shows a slow appreciation of capital over time). What can we say about the results? Well, there is definitely strong performance between the years 1990 and 2005, when inflation alone successfully predicted movements in the US Dollar. However, the results in the last years are mixed, so there is room for improvement.

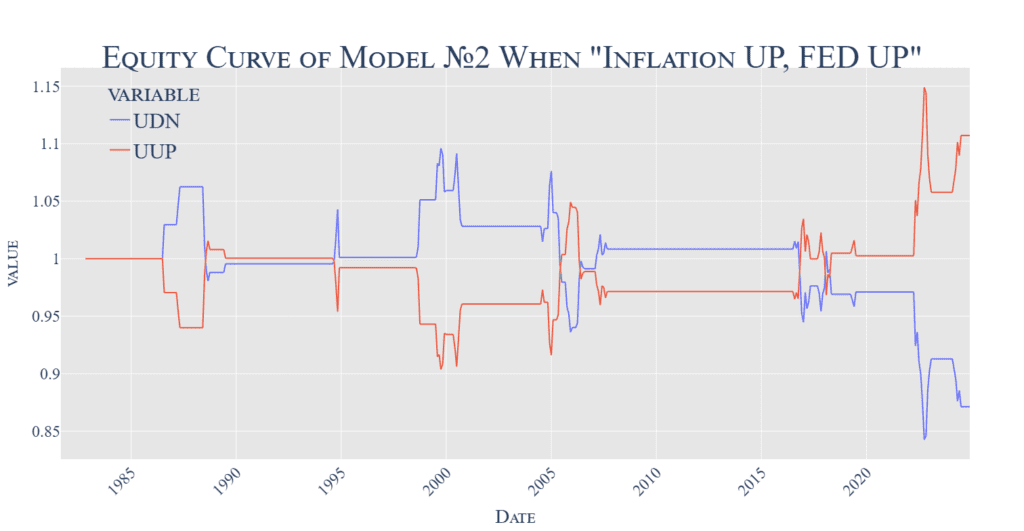
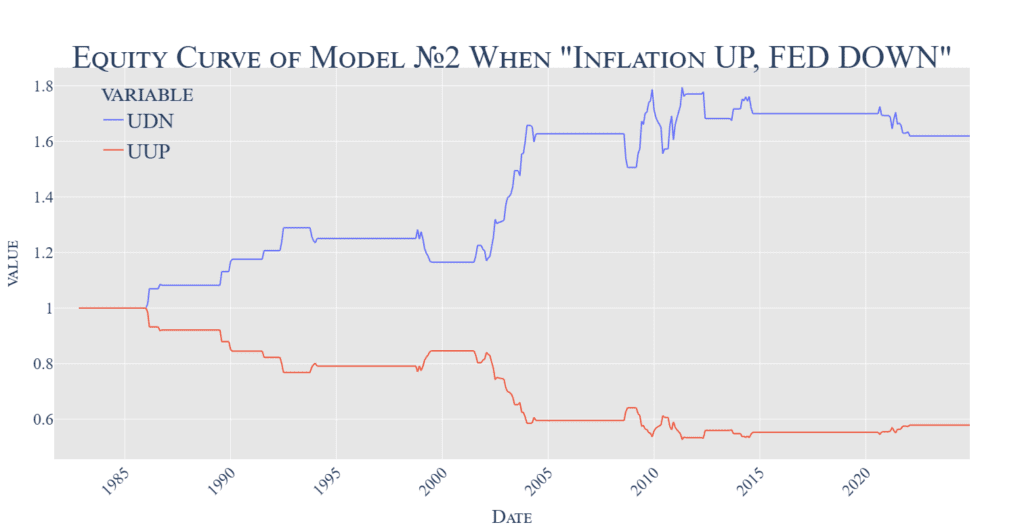
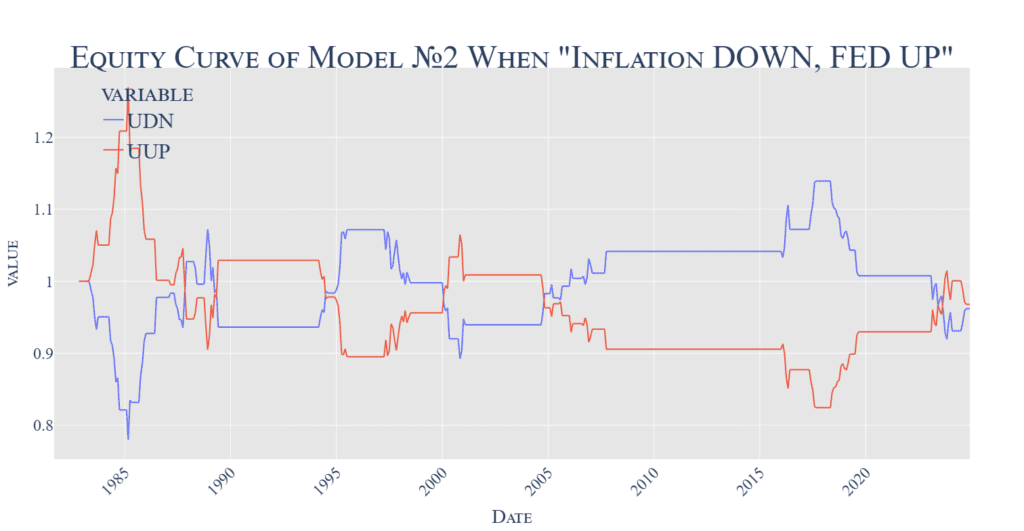
Finding 2 — Impact of FED Rate
- Naturally, the FED has a say regarding inflation and endeavors to combat it. So, we formed our second rule:
- As defined, we are in the “FED Up” period after the first rate hike, and we switch if the FED cuts rates.
- We are in the “FED Down” period after the FED cuts rates, and we switch if the FED raises rates.
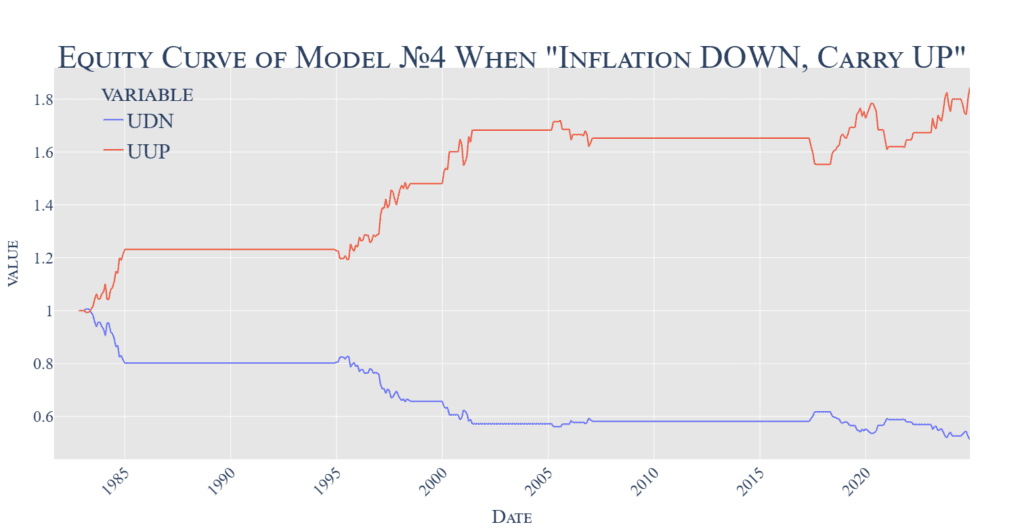
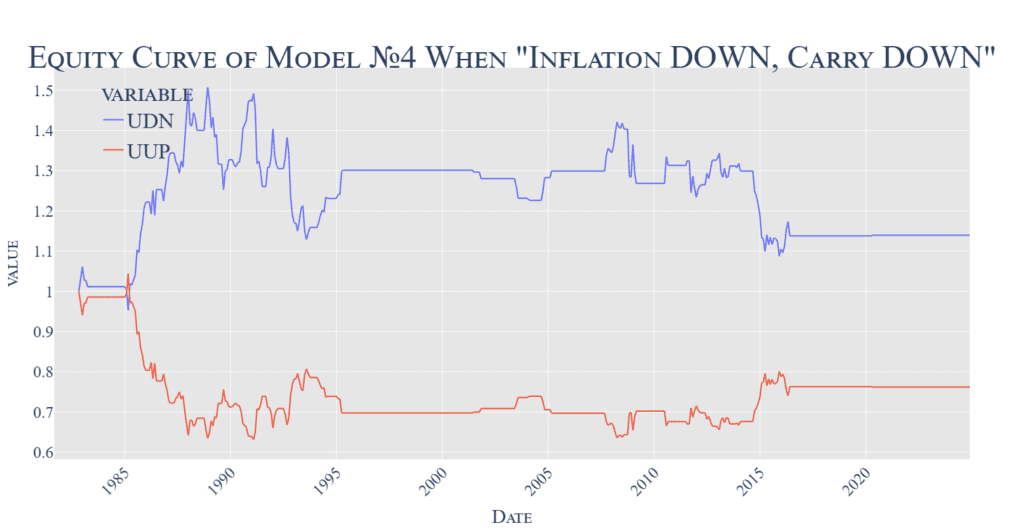
In total, we can have 4 different market epochs, based if we divide the whole history based on 2 different predictors. The four graphs below represent scenarios where inflation decelerates/accelerates and FED cuts/increases. We use 2 different ETFs as an investment vehicle, one for the short USD position (UDN – Invesco DB US Dollar Index Bearish Fund) and one for the long USD position (UUP – Invesco DB US Dollar Index Bullish Fund).

Now, what could be the takeaway?
- It’s advantageous to go long USD if inflation decelerates and the FED concurrently cuts rates.
- Secondly, it’s a good idea to short USD if inflation rises and the FED cuts rates (which might be an erroneous central bank policy).
- We can integrate those 2 rules into a mixed strategy with the following results:
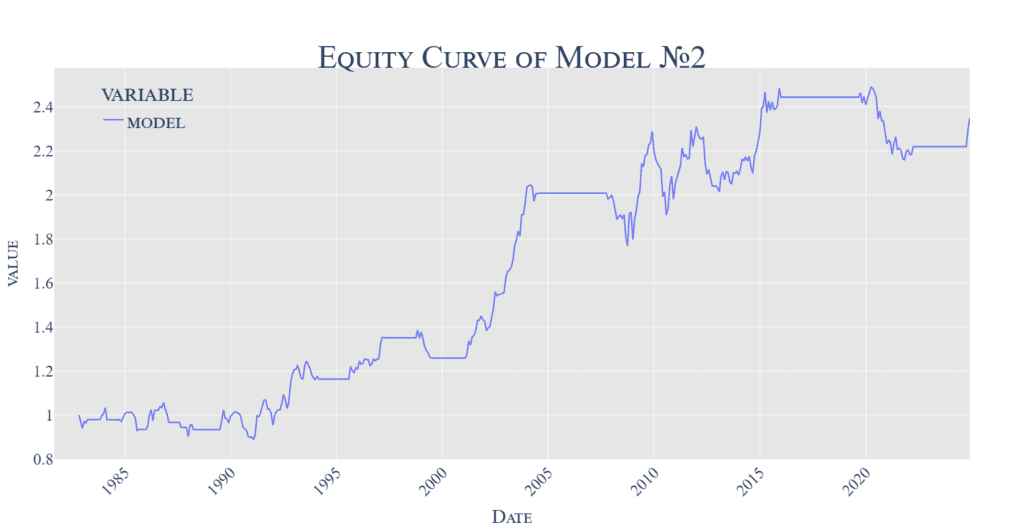
Integration of the information about the FED policy and inflation signal into one strategy clearly outperforms the basic benchmark strategy, which uses just the inflation signal alone. However, the FED policy is not the only signal we can try.
Finding 3 — Influence of the 3-Month Rate
- Instead of using the FED rate to signal an increasing or decreasing rate period, we can use the 3-month treasury rates, and base our signal on the same logic as we have for the inflation. Therefore:
- If 3-month rates rise (for two consecutive months), we are in a “Rates UP” period.
- Alternatively, if 3-month rates decrease (for two consecutive months), we are in a “Rates DOWN” period.
- Now, let’s observe the results of the long USD/short USD substrategies from four scenario-based graphs:
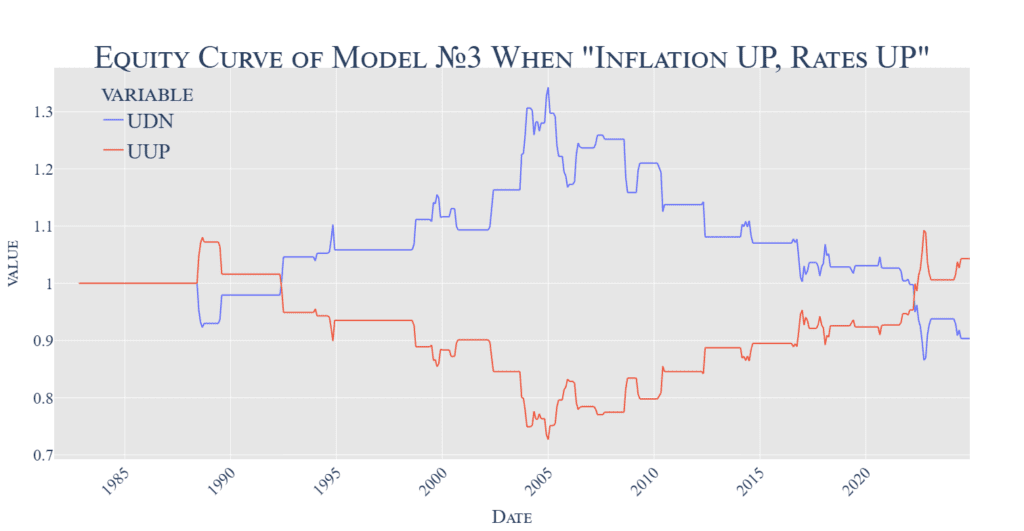
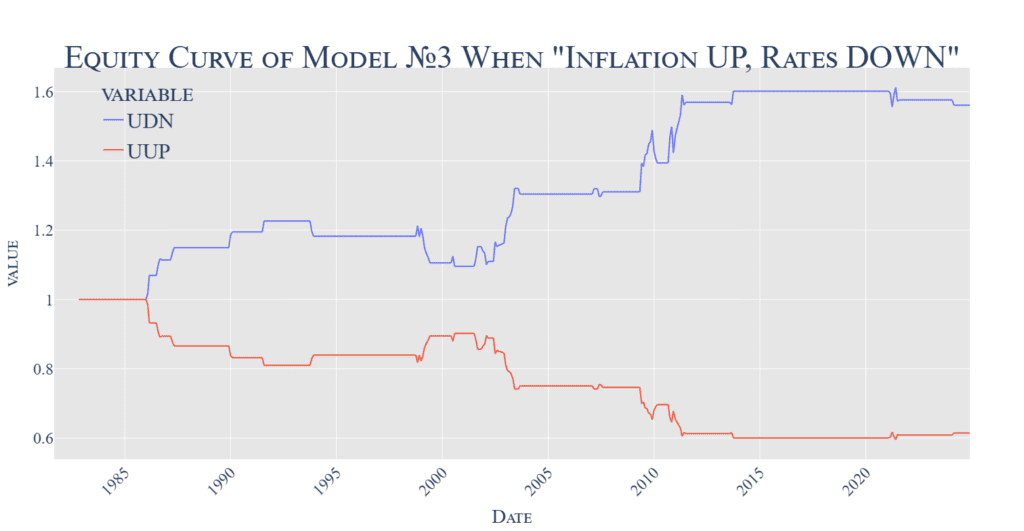
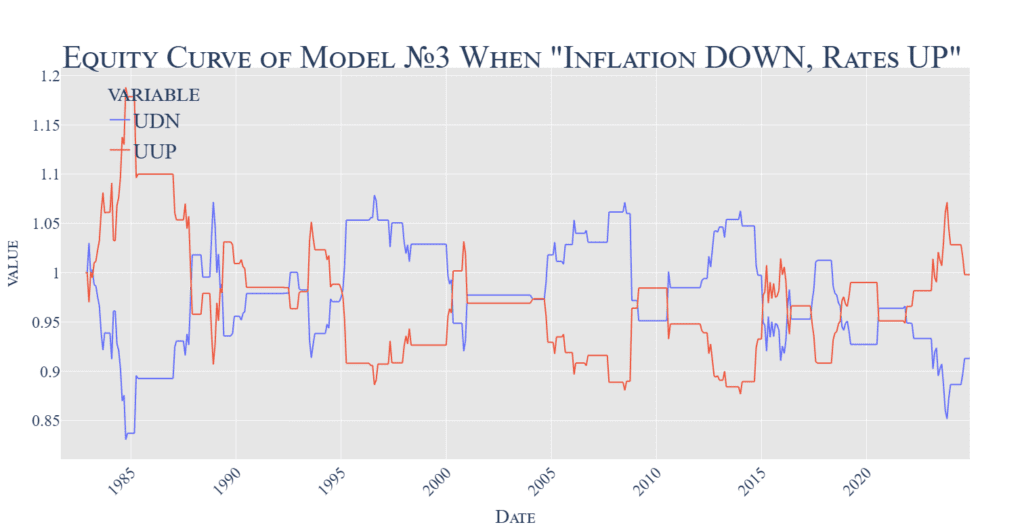
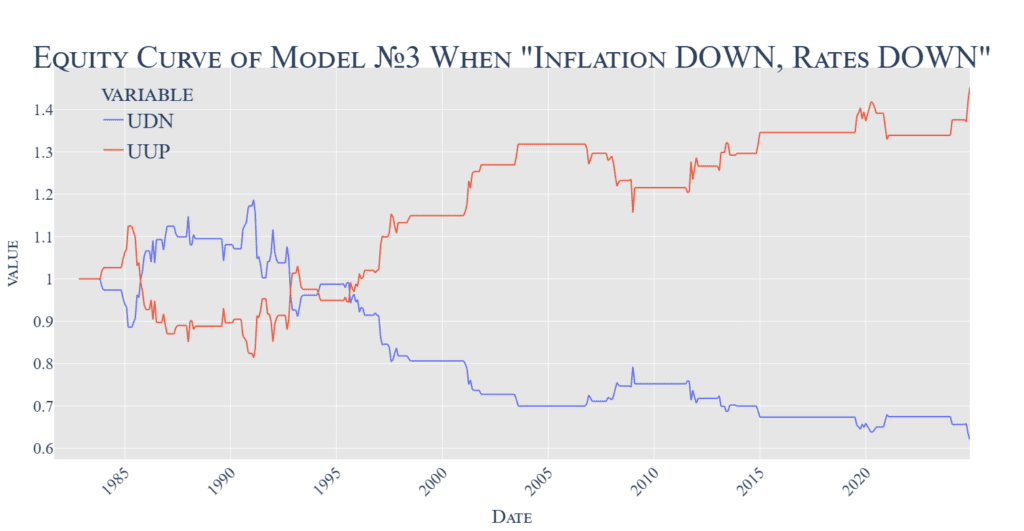
So, the combined sub-strategies using the 3-month rates and inflation are very similar than sub-strategies using the combination of the FED rate and inflation. It’s advantageous to go long USD if inflation decelerates and the 3M rates go down. Simultaneously, it’s a good idea to short USD if inflation rises and the 3M rates goe down (which might again signal an erroneous central bank policy).
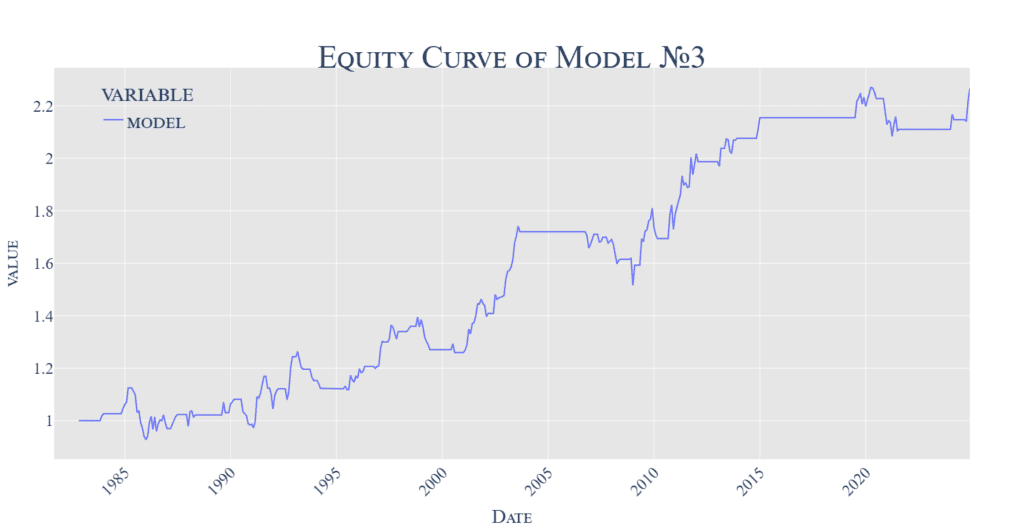
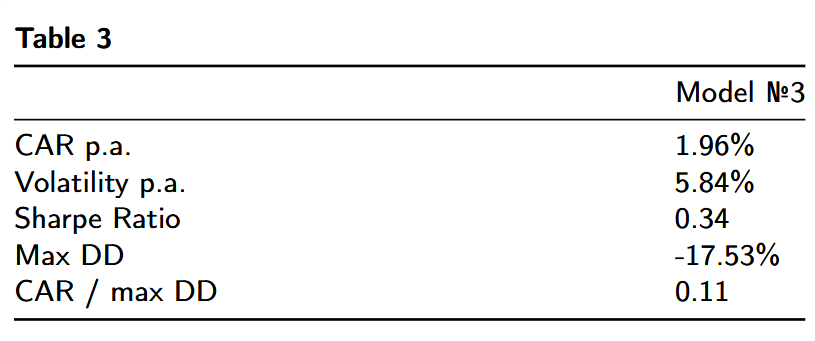
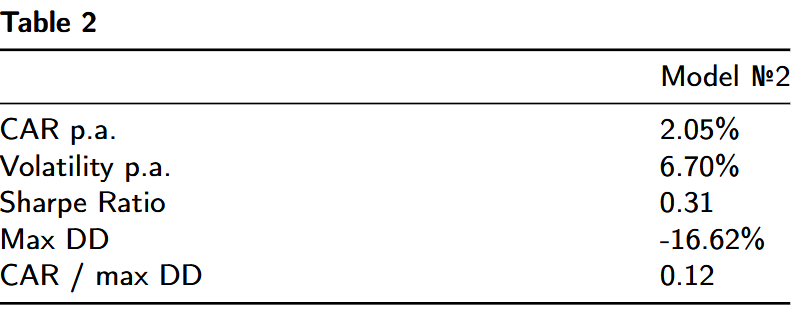
The resultant trading strategy has similar return-to-risk ratios than Model no.2, albeit with slightly different periods when it performs well. Theoretically, the signals from Model no.2 and Model no.3 can probably be combined for a more robust strategy. However, we do not plan to explore this possibility at the moment, as there is one more prediction signal that goes well in combination with the inflation signal.
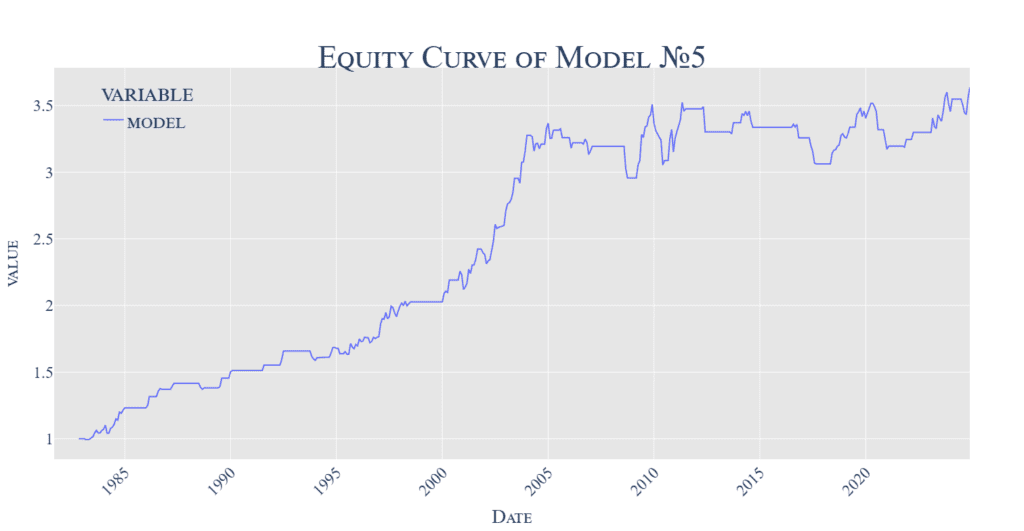
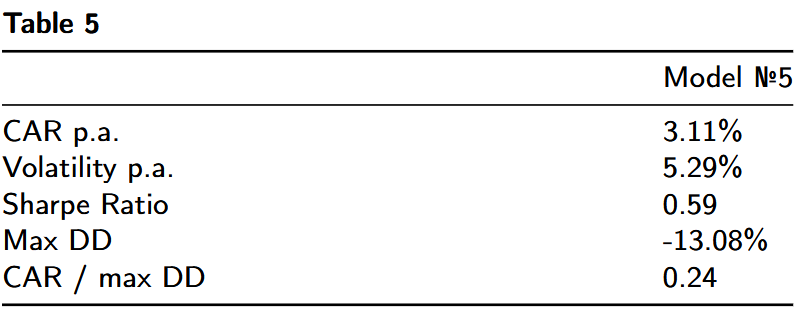
Finding 4 — Impact of Interest Rate Differentials
The US Dollar currency is not alone in our world, and the absolute measure of the US economy or the absolute measure of the level of interest rates is also not the most important driver for the performance. Relative standing and relative measures are important, too, and one of the most important measures is the interest rate differential between the risk-free rate in the US Dollar and other currencies – the Carry yield. We can use difference between the US 3-month rate and the average 3-month rate of six other major global currencies (EUR, CAD, CHF, GBP, AUD and JPY) as our predictor and define a simple US Dollar Carry Trade as:
Long USD if it has a higher rate than the average of other countries, and
short in the opposite case.
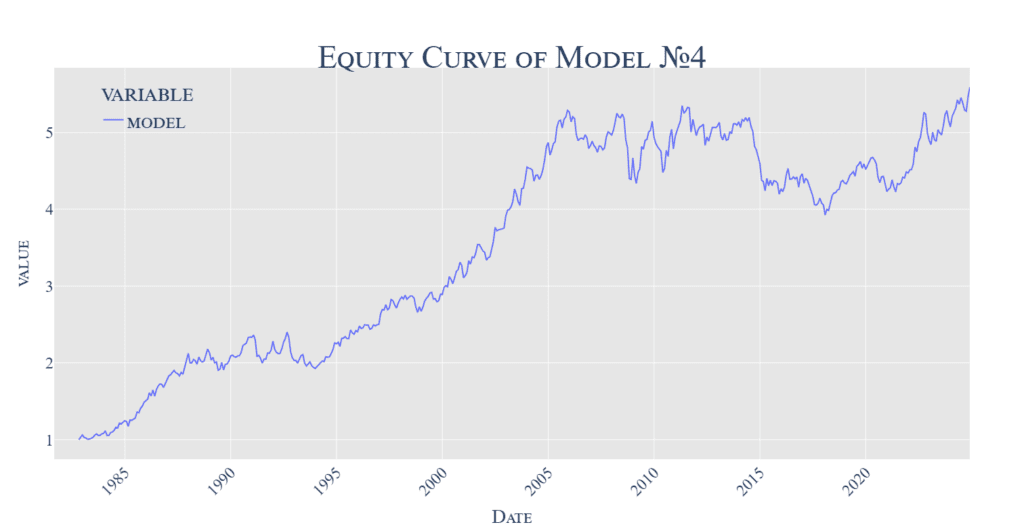
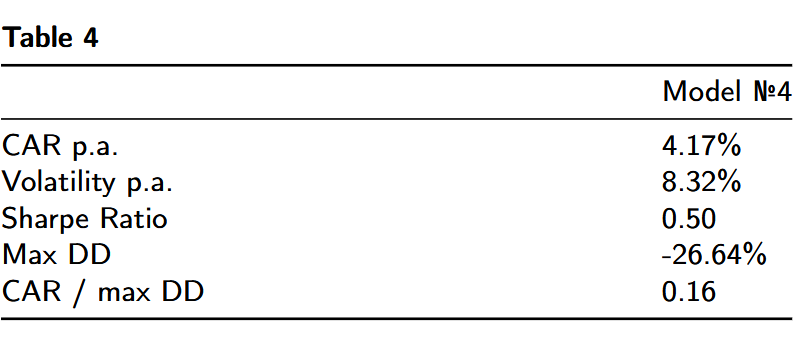
Naturally, inflation also plays a role. So, now we can try to pair the interest rate differential signal with the inflation signal in our model, too:
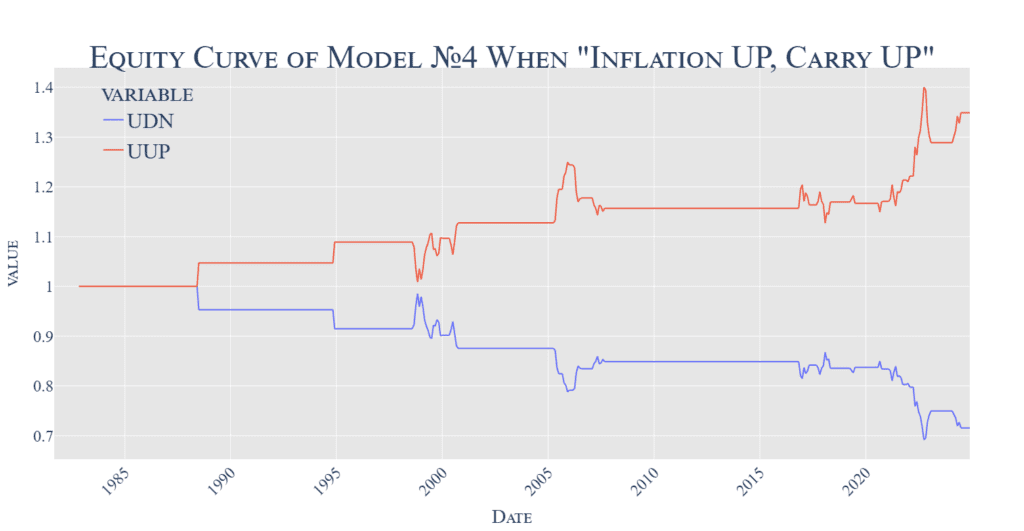
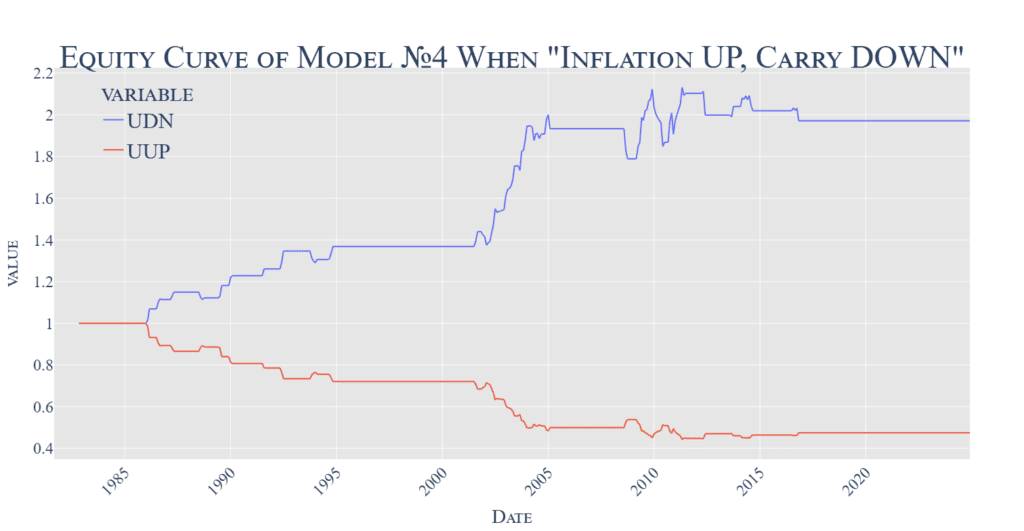
The previous figures show better performance when we go long USD if it has higher rates than the rest of the world (and it doesn’t matter, what’s the inflation doing). Conversely, short USD when inflation accelerates, and the US Dollar has lower rates than the rest of the world.
Combining the inflation signal with the carry signal achieves better ratios due to lower risk. However, the final strategy still struggled after 2010, as most of the other currency-carry strategies were due to the low yields in the financial repression era between 2008 and 2018.
Discussion & Conclusion
Our research findings provide significant insights into the complex dynamics governing the US dollar’s behavior, inflation, and interest rates. Some of our results challenge conventional wisdom, notably when the Federal Reserve cuts rates during declining inflation. The positive performance of USD in these circumstances suggests that market interpretations of monetary policy actions are more nuanced than often assumed.
In all of the cases, the inclusion of the 2nd predictor based on the interest rates signal (whether it’s FED rate, 3M rate, or interest rate differential) improves the return-to-risk ratios in comparison to the base strategy that uses just signal from the inflation alone. On the other hand, in most of the strategies, there is a visible decrease in the performance in the era of financial repression (2008-2018), when the movement in the US dollar was harder to predict. We are keen to observe how all of the strategies will perform in the next few years and if the return of inflation and higher interest rates in the last years will return, as well as the higher predictability of the US dollar exchange rate.
Author: Cyril Dujava, Quant Analyst, Quantpedia
Are you looking for more strategies to read about? Sign up for our newsletter or visit our Blog or Screener.
Do you want to learn more about Quantpedia Premium service? Check how Quantpedia works, our mission and Premium pricing offer.
Do you want to learn more about Quantpedia Pro service? Check its description, watch videos, review reporting capabilities and visit our pricing offer.
Are you looking for historical data or backtesting platforms? Check our list of Algo Trading Discounts.
Would you like free access to our services? Then, open an account with Lightspeed and enjoy one year of Quantpedia Premium at no cost.
Or follow us on:
Facebook Group, Facebook Page, Twitter, Linkedin, Medium or Youtube
Share onLinkedInTwitterFacebookRefer to a friend


